B. Aubert
D. Boutigny
J.-M. Gaillard
A. Hicheur
Y. Karyotakis
J. P. Lees
P. Robbe
V. Tisserand
Laboratoire de Physique des Particules, F-74941 Annecy-le-Vieux, France
A. Palano
Università di Bari, Dipartimento di Fisica and INFN, I-70126 Bari, Italy
G. P. Chen
J. C. Chen
N. D. Qi
G. Rong
P. Wang
Y. S. Zhu
Institute of High Energy Physics, Beijing 100039, China
G. Eigen
P. L. Reinertsen
B. Stugu
University of Bergen, Inst. of Physics, N-5007 Bergen, Norway
B. Abbott
G. S. Abrams
A. W. Borgland
A. B. Breon
D. N. Brown
J. Button-Shafer
R. N. Cahn
A. R. Clark
M. S. Gill
A. Gritsan
Y. Groysman
R. G. Jacobsen
R. W. Kadel
J. Kadyk
L. T. Kerth
S. Kluth
Yu. G. Kolomensky
J. F. Kral
C. LeClerc
M. E. Levi
T. Liu
G. Lynch
A. B. Meyer
M. Momayezi
P. J. Oddone
A. Perazzo
M. Pripstein
N. A. Roe
A. Romosan
M. T. Ronan
V. G. Shelkov
A. V. Telnov
W. A. Wenzel
Lawrence Berkeley National Laboratory and University of California, Berkeley, CA 94720, USA
P. G. Bright-Thomas
T. J. Harrison
C. M. Hawkes
D. J. Knowles
S. W. O’Neale
R. C. Penny
A. T. Watson
N. K. Watson
University of Birmingham, Birmingham, B15 2TT, United Kingdom
T. Deppermann
K. Goetzen
H. Koch
J. Krug
M. Kunze
B. Lewandowski
K. Peters
H. Schmuecker
M. Steinke
Ruhr Universität Bochum, Institut für Experimentalphysik 1, D-44780 Bochum, Germany
J. C. Andress
N. R. Barlow
W. Bhimji
N. Chevalier
P. J. Clark
W. N. Cottingham
N. De Groot
N. Dyce
B. Foster
J. D. McFall
D. Wallom
F. F. Wilson
University of Bristol, Bristol BS8 1TL, United Kingdom
K. Abe
C. Hearty
T. S. Mattison
J. A. McKenna
D. Thiessen
University of British Columbia, Vancouver, BC, Canada V6T 1Z1
S. Jolly
A. K. McKemey
J. Tinslay
Brunel University, Uxbridge, Middlesex UB8 3PH, United Kingdom
V. E. Blinov
A. D. Bukin
D. A. Bukin
A. R. Buzykaev
V. B. Golubev
V. N. Ivanchenko
A. A. Korol
E. A. Kravchenko
A. P. Onuchin
A. A. Salnikov
S. I. Serednyakov
Yu. I. Skovpen
V. I. Telnov
A. N. Yushkov
Budker Institute of Nuclear Physics, Novosibirsk 630090, Russia
D. Best
A. J. Lankford
M. Mandelkern
S. McMahon
D. P. Stoker
University of California at Irvine, Irvine, CA 92697, USA
A. Ahsan
K. Arisaka
C. Buchanan
S. Chun
University of California at Los Angeles, Los Angeles, CA 90024, USA
J. G. Branson
D. B. MacFarlane
S. Prell
Sh. Rahatlou
G. Raven
V. Sharma
University of California at San Diego, La Jolla, CA 92093, USA
C. Campagnari
B. Dahmes
P. A. Hart
N. Kuznetsova
S. L. Levy
O. Long
A. Lu
J. D. Richman
W. Verkerke
M. Witherell
S. Yellin
University of California at Santa Barbara, Santa Barbara, CA 93106, USA
J. Beringer
D. E. Dorfan
A. M. Eisner
A. Frey
A. A. Grillo
M. Grothe
C. A. Heusch
R. P. Johnson
W. Kroeger
W. S. Lockman
T. Pulliam
H. Sadrozinski
T. Schalk
R. E. Schmitz
B. A. Schumm
A. Seiden
M. Turri
W. Walkowiak
D. C. Williams
M. G. Wilson
University of California at Santa Cruz, Institute for Particle Physics, Santa Cruz, CA 95064, USA
E. Chen
G. P. Dubois-Felsmann
A. Dvoretskii
D. G. Hitlin
S. Metzler
J. Oyang
F. C. Porter
A. Ryd
A. Samuel
M. Weaver
S. Yang
R. Y. Zhu
California Institute of Technology, Pasadena, CA 91125, USA
S. Devmal
T. L. Geld
S. Jayatilleke
G. Mancinelli
B. T. Meadows
M. D. Sokoloff
University of Cincinnati, Cincinnati, OH 45221, USA
T. Barillari
P. Bloom
M. O. Dima
S. Fahey
W. T. Ford
D. R. Johnson
U. Nauenberg
A. Olivas
H. Park
P. Rankin
J. Roy
S. Sen
J. G. Smith
W. C. van Hoek
D. L. Wagner
University of Colorado, Boulder, CO 80309, USA
J. Blouw
J. L. Harton
M. Krishnamurthy
A. Soffer
W. H. Toki
R. J. Wilson
J. Zhang
Colorado State University, Fort Collins, CO 80523, USA
T. Brandt
J. Brose
T. Colberg
G. Dahlinger
M. Dickopp
R. S. Dubitzky
E. Maly
R. Müller-Pfefferkorn
S. Otto
K. R. Schubert
R. Schwierz
B. Spaan
L. Wilden
Technische Universität Dresden, Institut für Kern- und Teilchenphysik, D-01062, Dresden, Germany
L. Behr
D. Bernard
G. R. Bonneaud
F. Brochard
J. Cohen-Tanugi
S. Ferrag
E. Roussot
S. T’Jampens
Ch. Thiebaux
G. Vasileiadis
M. Verderi
Ecole Polytechnique, F-91128 Palaiseau, France
A. Anjomshoaa
R. Bernet
A. Khan
F. Muheim
S. Playfer
J. E. Swain
University of Edinburgh, Edinburgh EH9 3JZ, United Kingdom
M. Falbo
Elon University, Elon University, NC 27244-2010, USA
C. Borean
C. Bozzi
S. Dittongo
M. Folegani
L. Piemontese
Università di Ferrara, Dipartimento di Fisica and INFN, I-44100 Ferrara, Italy
E. Treadwell
Florida A&M University, Tallahassee, FL 32307, USA
F. Anulli
Also with Università di Perugia, I-06100 Perugia, Italy
R. Baldini-Ferroli
A. Calcaterra
R. de Sangro
D. Falciai
G. Finocchiaro
P. Patteri
I. M. Peruzzi
Also with Università di Perugia, I-06100 Perugia, Italy
M. Piccolo
Y. Xie
A. Zallo
Laboratori Nazionali di Frascati dell’INFN, I-00044 Frascati, Italy
S. Bagnasco
A. Buzzo
R. Contri
G. Crosetti
P. Fabbricatore
S. Farinon
M. Lo Vetere
M. Macri
M. R. Monge
R. Musenich
M. Pallavicini
R. Parodi
S. Passaggio
F. C. Pastore
C. Patrignani
M. G. Pia
C. Priano
E. Robutti
A. Santroni
Università di Genova, Dipartimento di Fisica and INFN, I-16146 Genova, Italy
M. Morii
Harvard University, Cambridge, MA 02138, USA
R. Bartoldus
T. Dignan
R. Hamilton
U. Mallik
University of Iowa, Iowa City, IA 52242, USA
J. Cochran
H. B. Crawley
P.-A. Fischer
J. Lamsa
W. T. Meyer
E. I. Rosenberg
Iowa State University, Ames, IA 50011-3160, USA
M. Benkebil
G. Grosdidier
C. Hast
A. Höcker
H. M. Lacker
S. Laplace
V. Lepeltier
A. M. Lutz
S. Plaszczynski
M. H. Schune
S. Trincaz-Duvoid
A. Valassi
G. Wormser
Laboratoire de l’Accélérateur Linéaire, F-91898 Orsay, France
R. M. Bionta
V. Brigljević
D. J. Lange
M. Mugge
X. Shi
K. van Bibber
T. J. Wenaus
D. M. Wright
C. R. Wuest
Lawrence Livermore National Laboratory, Livermore, CA 94550, USA
M. Carroll
J. R. Fry
E. Gabathuler
R. Gamet
M. George
M. Kay
D. J. Payne
R. J. Sloane
C. Touramanis
University of Liverpool, Liverpool L69 3BX, United Kingdom
M. L. Aspinwall
D. A. Bowerman
P. D. Dauncey
U. Egede
I. Eschrich
N. J. W. Gunawardane
J. A. Nash
P. Sanders
D. Smith
University of London, Imperial College, London, SW7 2BW, United Kingdom
D. E. Azzopardi
J. J. Back
P. Dixon
P. F. Harrison
R. J. L. Potter
H. W. Shorthouse
P. Strother
P. B. Vidal
M. I. Williams
Queen Mary, University of London, E1 4NS, United Kingdom
G. Cowan
S. George
M. G. Green
A. Kurup
C. E. Marker
P. McGrath
T. R. McMahon
S. Ricciardi
F. Salvatore
I. Scott
G. Vaitsas
University of London, Royal Holloway and Bedford New College, Egham, Surrey TW20 0EX, United Kingdom
D. Brown
C. L. Davis
University of Louisville, Louisville, KY 40292, USA
J. Allison
R. J. Barlow
J. T. Boyd
A. C. Forti
J. Fullwood
F. Jackson
G. D. Lafferty
N. Savvas
E. T. Simopoulos
J. H. Weatherall
University of Manchester, Manchester M13 9PL, United Kingdom
A. Farbin
A. Jawahery
V. Lillard
J. Olsen
D. A. Roberts
J. R. Schieck
University of Maryland, College Park, MD 20742, USA
G. Blaylock
C. Dallapiccola
K. T. Flood
S. S. Hertzbach
R. Kofler
T. B. Moore
H. Staengle
S. Willocq
University of Massachusetts, Amherst, MA 01003, USA
B. Brau
R. Cowan
G. Sciolla
F. Taylor
R. K. Yamamoto
Massachusetts Institute of Technology, Laboratory for Nuclear Science, Cambridge, MA 02139, USA
M. Milek
P. M. Patel
J. Trischuk
McGill University, Montréal, Canada QC H3A 2T8
F. Lanni
F. Palombo
Università di Milano, Dipartimento di Fisica and INFN, I-20133 Milano, Italy
J. M. Bauer
M. Booke
L. Cremaldi
V. Eschenburg
R. Kroeger
J. Reidy
D. A. Sanders
D. J. Summers
University of Mississippi, University, MS 38677, USA
J. P. Martin
J. Y. Nief
R. Seitz
P. Taras
A. Woch
V. Zacek
Université de Montréal, Laboratoire René J. A. Lévesque, Montréal, Canada QC H3C 3J7
H. Nicholson
C. S. Sutton
Mount Holyoke College, South Hadley, MA 01075, USA
C. Cartaro
N. Cavallo
Also with Università della Basilicata, I-85100 Potenza, Italy
G. De Nardo
F. Fabozzi
C. Gatto
L. Lista
P. Paolucci
D. Piccolo
C. Sciacca
Università di Napoli Federico II, Dipartimento di Scienze Fisiche and INFN, I-80126, Napoli, Italy
J. M. LoSecco
University of Notre Dame, Notre Dame, IN 46556, USA
J. R. G. Alsmiller
T. A. Gabriel
T. Handler
Oak Ridge National Laboratory, Oak Ridge, TN 37831, USA
J. Brau
R. Frey
M. Iwasaki
N. B. Sinev
D. Strom
University of Oregon, Eugene, OR 97403, USA
F. Colecchia
F. Dal Corso
A. Dorigo
F. Galeazzi
M. Margoni
G. Michelon
M. Morandin
M. Posocco
M. Rotondo
F. Simonetto
R. Stroili
E. Torassa
C. Voci
Università di Padova, Dipartimento di Fisica and INFN, I-35131 Padova, Italy
M. Benayoun
H. Briand
J. Chauveau
P. David
Ch. de la Vaissière
L. Del Buono
O. Hamon
F. Le Diberder
Ph. Leruste
J. Lory
L. Roos
J. Stark
S. Versillé
Universités Paris VI et VII, LPNHE, F-75252 Paris, France
P. F. Manfredi
V. Re
V. Speziali
Università di Pavia, Dipartimento di Elettronica and INFN, I-27100 Pavia, Italy
E. D. Frank
L. Gladney
Q. H. Guo
J. H. Panetta
University of Pennsylvania, Philadelphia, PA 19104, USA
C. Angelini
G. Batignani
S. Bettarini
M. Bondioli
M. Carpinelli
F. Forti
M. A. Giorgi
A. Lusiani
F. Martinez-Vidal
M. Morganti
N. Neri
E. Paoloni
M. Rama
G. Rizzo
F. Sandrelli
G. Simi
G. Triggiani
J. Walsh
Università di Pisa, Scuola Normale Superiore and INFN, I-56010 Pisa, Italy
M. Haire
D. Judd
K. Paick
L. Turnbull
D. E. Wagoner
Prairie View A&M University, Prairie View, TX 77446, USA
J. Albert
C. Bula
P. Elmer
C. Lu
K. T. McDonald
V. Miftakov
S. F. Schaffner
A. J. S. Smith
A. Tumanov
E. W. Varnes
Princeton University, Princeton, NJ 08544, USA
G. Cavoto
D. del Re
Università di Roma La Sapienza, Dipartimento di Fisica and INFN, I-00185 Roma, Italy
R. Faccini
University of California at San Diego, La Jolla, CA 92093, USA
Università di Roma La Sapienza, Dipartimento di Fisica and INFN, I-00185 Roma, Italy
F. Ferrarotto
F. Ferroni
K. Fratini
E. Lamanna
E. Leonardi
M. A. Mazzoni
S. Morganti
G. Piredda
F. Safai Tehrani
M. Serra
C. Voena
Università di Roma La Sapienza, Dipartimento di Fisica and INFN, I-00185 Roma, Italy
S. Christ
R. Waldi
Universität Rostock, D-18051 Rostock, Germany
P. F. Jacques
M. Kalelkar
R. J. Plano
Rutgers University, New Brunswick, NJ 08903, USA
T. Adye
B. Franek
N. I. Geddes
G. P. Gopal
S. M. Xella
Rutherford Appleton Laboratory, Chilton, Didcot, Oxon, OX11 0QX, United Kingdom
R. Aleksan
G. De Domenico
S. Emery
A. Gaidot
S. F. Ganzhur
P.-F. Giraud
G. Hamel de Monchenault
W. Kozanecki
M. Langer
G. W. London
B. Mayer
B. Serfass
G. Vasseur
Ch. Yèche
M. Zito
DAPNIA, Commissariat à l’Energie Atomique/Saclay, F-91191 Gif-sur-Yvette, France
N. Copty
M. V. Purohit
H. Singh
F. X. Yumiceva
University of South Carolina, Columbia, SC 29208, USA
I. Adam
P. L. Anthony
D. Aston
K. Baird
E. Bloom
A. M. Boyarski
F. Bulos
G. Calderini
R. Claus
M. R. Convery
D. P. Coupal
D. H. Coward
J. Dorfan
M. Doser
W. Dunwoodie
R. C. Field
T. Glanzman
G. L. Godfrey
S. J. Gowdy
P. Grosso
T. Himel
M. E. Huffer
W. R. Innes
C. P. Jessop
M. H. Kelsey
P. Kim
M. L. Kocian
U. Langenegger
D. W. G. S. Leith
S. Luitz
V. Luth
H. L. Lynch
H. Marsiske
S. Menke
R. Messner
K. C. Moffeit
R. Mount
D. R. Muller
C. P. O’Grady
M. Perl
S. Petrak
H. Quinn
B. N. Ratcliff
S. H. Robertson
L. S. Rochester
A. Roodman
T. Schietinger
R. H. Schindler
J. Schwiening
V. V. Serbo
A. Snyder
A. Soha
S. M. Spanier
J. Stelzer
D. Su
M. K. Sullivan
H. A. Tanaka
J. Va’vra
S. R. Wagner
A. J. R. Weinstein
W. J. Wisniewski
D. H. Wright
C. C. Young
Stanford Linear Accelerator Center, Stanford, CA 94309, USA
P. R. Burchat
C. H. Cheng
D. Kirkby
T. I. Meyer
C. Roat
Stanford University, Stanford, CA 94305-4060, USA
A. De Silva
R. Henderson
TRIUMF, Vancouver, BC, Canada V6T 2A3
W. Bugg
H. Cohn
A. W. Weidemann
University of Tennessee, Knoxville, TN 37996, USA
J. M. Izen
I. Kitayama
X. C. Lou
M. Turcotte
University of Texas at Dallas, Richardson, TX 75083, USA
F. Bianchi
M. Bona
B. Di Girolamo
D. Gamba
A. Smol
D. Zanin
Università di Torino, Dipartimento di Fisica Sperimentale and INFN, I-10125 Torino, Italy
L. Bosisio
G. Della Ricca
L. Lanceri
A. Pompili
P. Poropat
M. Prest
E. Vallazza
G. Vuagnin
Università di Trieste, Dipartimento di Fisica and INFN, I-34127 Trieste, Italy
R. S. Panvini
Vanderbilt University, Nashville, TN 37235, USA
C. M. Brown
R. Kowalewski
J. M. Roney
University of Victoria, Victoria, BC, Canada V8W 3P6
H. R. Band
E. Charles
S. Dasu
F. Di Lodovico
A. M. Eichenbaum
H. Hu
J. R. Johnson
R. Liu
J. Nielsen
Y. Pan
R. Prepost
I. J. Scott
S. J. Sekula
J. H. von Wimmersperg-Toeller
S. L. Wu
Z. Yu
H. Zobernig
University of Wisconsin, Madison, WI 53706, USA
T. M. B. Kordich
H. Neal
Yale University, New Haven, CT 06511, USA
Abstract
We present a limit on the branching fraction for the decay
using data collected at the resonance with the BABAR detector at the PEP-II
asymmetric–energy collider.
Based on the observation of one event in the signal region, out of a sample of
21.3 106
decays, we establish an upper limit on the branching fraction of
at the 90% confidence level.
This result substantially improves upon existing limits.
pacs:
12.15.Hh, 11.30.Er, 13.25.Hw
Figure 1: Examples of possible diagrams responsible for
the decay . In these diagrams
q = u, c, or t, and H is a hypothetical charged non-Standard Model Higgs boson.
In the Standard Model the decay proceeds via a
second-order weak transition, including gluonic penguins, followed by annihilation
(Fig. 1).
Standard Model predictions for the branching fraction of
these effective flavor–changing weak neutral current processes
range from 0.1 to b0gammagammaSUSY .
Physics beyond the Standard Model can enhance this branching fraction
by as much as two orders of magnitude, particularly in the case of
two–Higgs models b0gammagamma2Higgs .
Other particles from the supersymmetric spectrum can further modify the Standard Model
expectation b0gammagammaSUSY .
The current best limit on the branching fraction for ,
from the L3 experiment L3 at the CERN LEP collider, is
(90% confidence level).
In this Letter we present an analysis based on
data taken with the BABAR detector detector , which operates at the
PEP–II asymmetric–energy collider at the Stanford Linear Accelerator Center
pep .
The sample
consists of 19.4 taken at the resonance,
corresponding to
events.
An additional sample of 2.2 accumulated
40 below the resonance is used to estimate non– background.
Charge conjugation invariance is assumed for all channels quoted in this
paper, and the charge conjugate reactions are included in the analysis.
Quantities evaluated in the rest frame are denoted by an asterisk;
e.g., is the energy of the and beams in the
rest frame.
The BABAR detector, a general purpose solenoidal magnetic spectrometer, is
described in detail elsewhere detector . A silicon vertex detector and a
cylindrical drift chamber in a 1.5-T solenoidal magnetic field are used to measure momenta and
ionization energy loss of charged particles.
Electrons and photons are identified by a
CsI electromagnetic calorimeter (EMC).
This analysis exploits in particular the information provided by the
EMC
consisting of 6580 CsI crystals, covering 90% of 4
in the rest frame.
The energy resolution has been measured directly with a radioactive source at low energy
and with electrons from Bhabha scattering at high energy.
The mass resolution of and candidates in which the two photons
in the decay have approximately equal energy can be used to infer the energy resolution
at an energy less than 1; the decay provides
an additional measurement at 500.
A fit to the energy dependence results in detector .
Energy deposits in the EMC are reconstructed
by grouping adjacent crystals with energy deposits greater than
1 into clusters. Clusters with more than one local energy maximum are then split
into bumps.
The energy of each crystal is divided among the bumps by an iterative adjustment of the
centers and energies of the bumps assuming electromagnetic shower shapes detector .
Next, all tracks reconstructed in the tracking volume are extrapolated to the
EMC entrance and a track–bump matching probability is calculated for each pair.
All bumps with a matching probability smaller than are treated as photon candidates.
Photons are selected by requiring the bump shape to be compatible with an electromagnetic
shower, and by requiring the bump to have a minimum energy of 30.
In addition we accept only photon candidates which are isolated from any other bump in the event.
This requirement selects against background from high–energy mesons, where the two
photons from the decay of the meson strike the calorimeter in close proximity
(merged ).
The BABAR detector is simulated by a GEANT–based Monte Carlo procedure geant that includes
beam–related background by mixing random trigger events into the Monte Carlo generated events.
The simulated events are processed in the same manner as data.
The simulation is used to study background and optimize selection criteria, but
only enters the analysis directly through the calculation of the signal efficiency.
In order to select events, we require at least three tracks of good quality
in the event. The quality requirements for these tracks include a small impact parameter with respect to
the collision point along the beam direction (10) and transverse to it (1.5),
a minimum number of 13 hits in the drift chamber and a momentum of
in the laboratory frame. To help reject continuum background, the ratio of the
second Fox–Wolfram moment to the zeroth Fox–Wolfram moment FoxWolfram must be less than 0.9.
We further require that there be two high–energy photon candidates with
an energy in the rest frame between 1.5 and 3.5.
At this point, all remaining pairs of photons are considered candidates
for the decay .
If the event contains more than one such candidate all of them are kept for further analysis.
After this preselection additional requirements are imposed on the
candidates.
Photon bumps from the candidate must not contain noisy crystals or crystals which produce no
signals.
The second moment of the energy distribution around the cluster’s centroid
must be smaller than 0.002. This value has been optimized
to
reject
remaining background from merged mesons.
Since mesons at the resonance are produced nearly at rest, the decay
will contain two nearly back–to–back photons with
in the rest frame. This represents a clean signature and
makes this channel relatively easy to study experimentally. We exploit this
feature by considering only candidates
which have at least one photon with .
In order to reject photons from () decays
we combine each photon from the candidate with all the other
photons in the event having energy greater than 50(250). The resulting ()
candidates are required to have an invariant
mass beyond three standard deviations, or ,
of the nominal () mass PDG .
Reconstruction of exclusive final states from mesons produced at the resonance benefits
from the beam energy constraint . Thus, in the
rest frame the energies of the meson decay products must add up to the beam energy.
We calculate the energy difference
between the candidate meson and the beam energy
in the rest frame. The distribution of this quantity peaks at 0 GeV for true mesons,
and has a tail towards negative
due to
shower leakage in the EMC.
The resolution in is obtained from signal Monte Carlo events with a fit of the
distribution to an empirical function CrystalBall and
is .
The meson mass resolution is improved
with the use of the
beam energy constraint.
We use the beam energy substituted mass
.
The resolution on is obtained from signal Monte Carlo events with a fit of the distribution
to an empirical function CrystalBall and
is .
For the purpose of determining numbers of events and efficiencies a rectangular
signal region is defined. This region extends 2
in about 0 and 2 in about the nominal mass of the meson.
The search for was performed as a blind analysis by hiding
a 3 region in and in on–resonance data until the development of
the selection procedure was complete.
This allows optimization of the selection and estimation of the background
without the bias of knowing the number of events in the signal region.
Monte Carlo studies indicate that the main background arises from the process
(, , ), referred to as continuum background
and modeled with the JETSET event generator JETSET .
Such events
exhibit a two–jet structure and contain
high momentum, approximately back–to–back tracks.
One source of background includes photons
from initial-state radiation, others are photons from
and decays, where the decay is very asymmetric in the
final-state photon energy.
Background from merged mesons is negligible.
Table 1:
Cumulative signal reconstruction efficiency as selection criteria are applied.
The first row shows the cumulative event selection efficiency. The additional rows give
individual contributions to the candidate selection efficiency. The cumulative signal
reconstruction efficiency is
given by the product of event selection and final reconstruction efficiency.
selection criteria
efficiency [%]
cumulative event preselection
39.8
photon energy
92.9
bump quality and second moment
86.8
and veto
72.8
and
40.1
signal region
27.0
cumulative
10.7
To reduce continuum background, we calculate the angle between one of the photons
(chosen randomly) of the candidate and the thrust axis of the remaining tracks and neutral bumps
in the event. The distribution of is uniform for signal events and
strongly peaked at 1 for continuum background events.
We also calculate the angle between the momentum vector of the candidate
and the beam axis in the rest frame.
The distribution of is uniform
for continuum background and follows a distribution for signal events.
The requirements for both and have been
optimized to maximize the statistical significance , where is the number of
signal candidates expected assuming for the branching fraction
b0gammagammaSUSY
and is the expected number of background candidates determined from continuum
Monte Carlo simulation and off–resonance data.
We require and .
If more than one meson candidate per event remains after this selection, which occurs in
less than 0.1% of the events analyzed, we select the candidate with the smallest .
After all these selection criteria
the overall efficiency for decays is determined from
the Monte Carlo simulation to be , where the error is purely statistical.
Table 1 shows the cumulative signal reconstruction efficiency as the
selection criteria are applied.
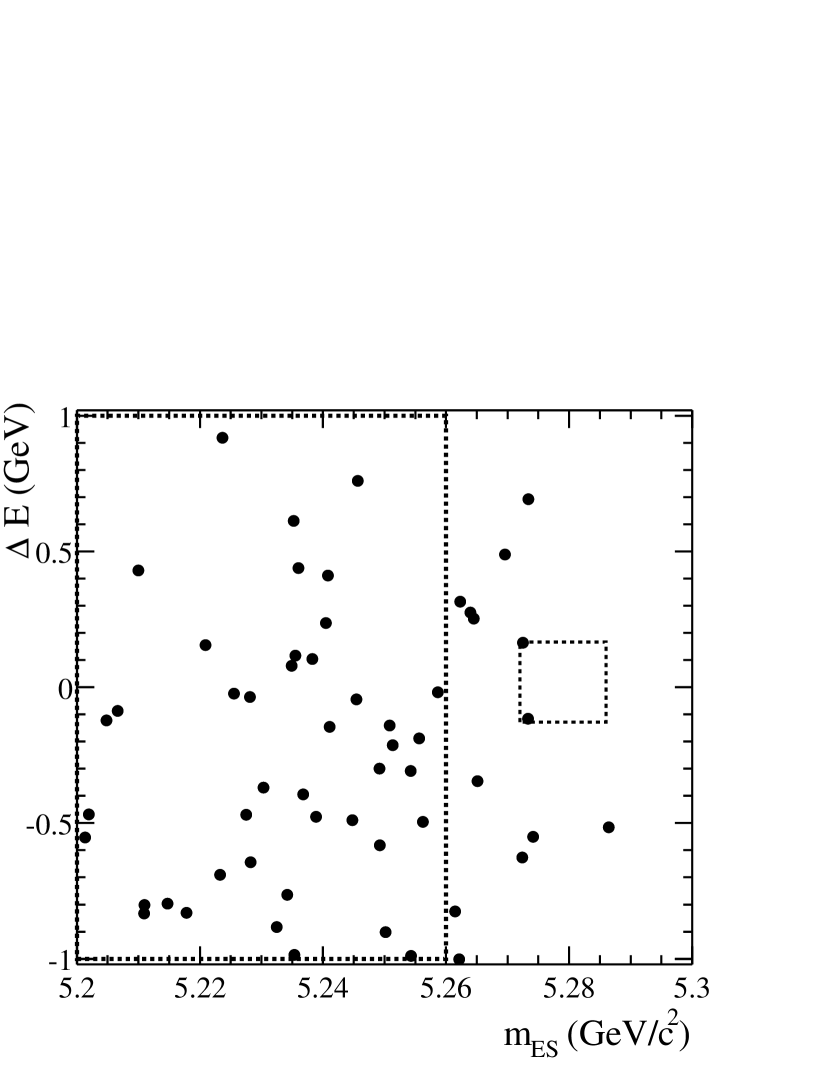
Figure 2:
Energy difference
between the candidate meson and the beam energy
in the rest frame versus
beam energy substituted mass
for on–resonance data.
We observe one event in the signal region, outlined as a black dashed box about ,
consistent with the expected background. The dashed box on the left shows the sideband used
for background estimation.
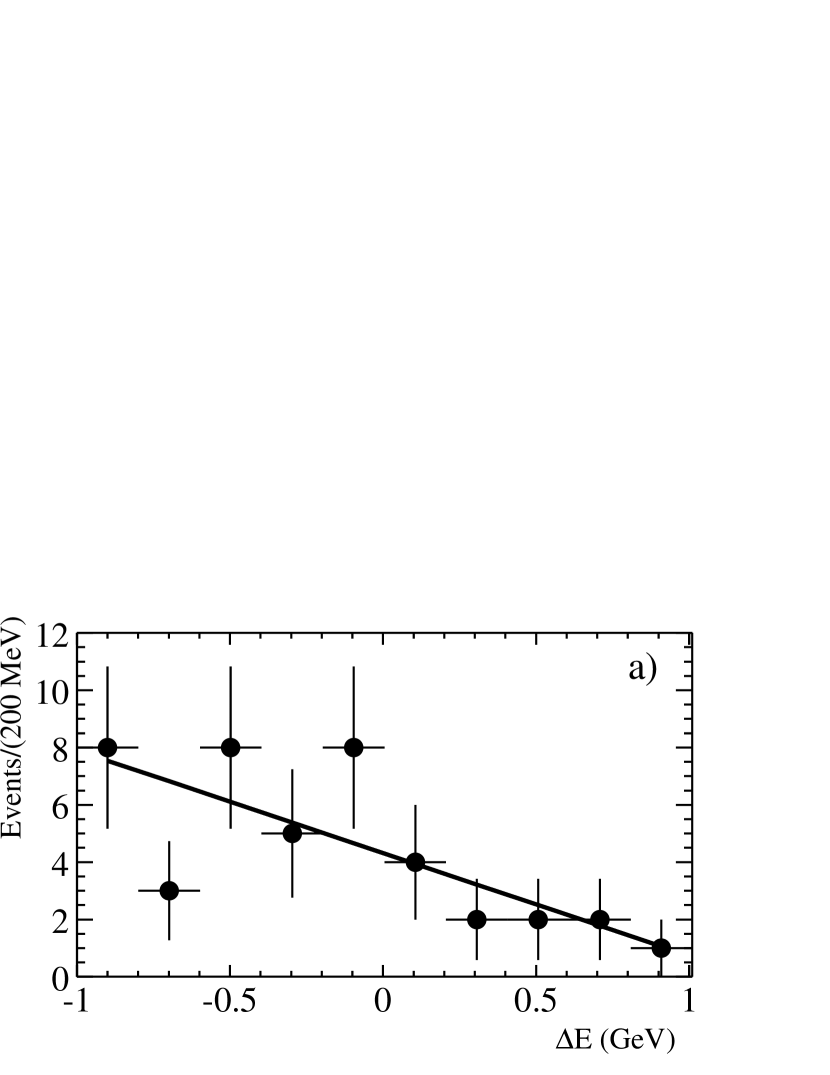
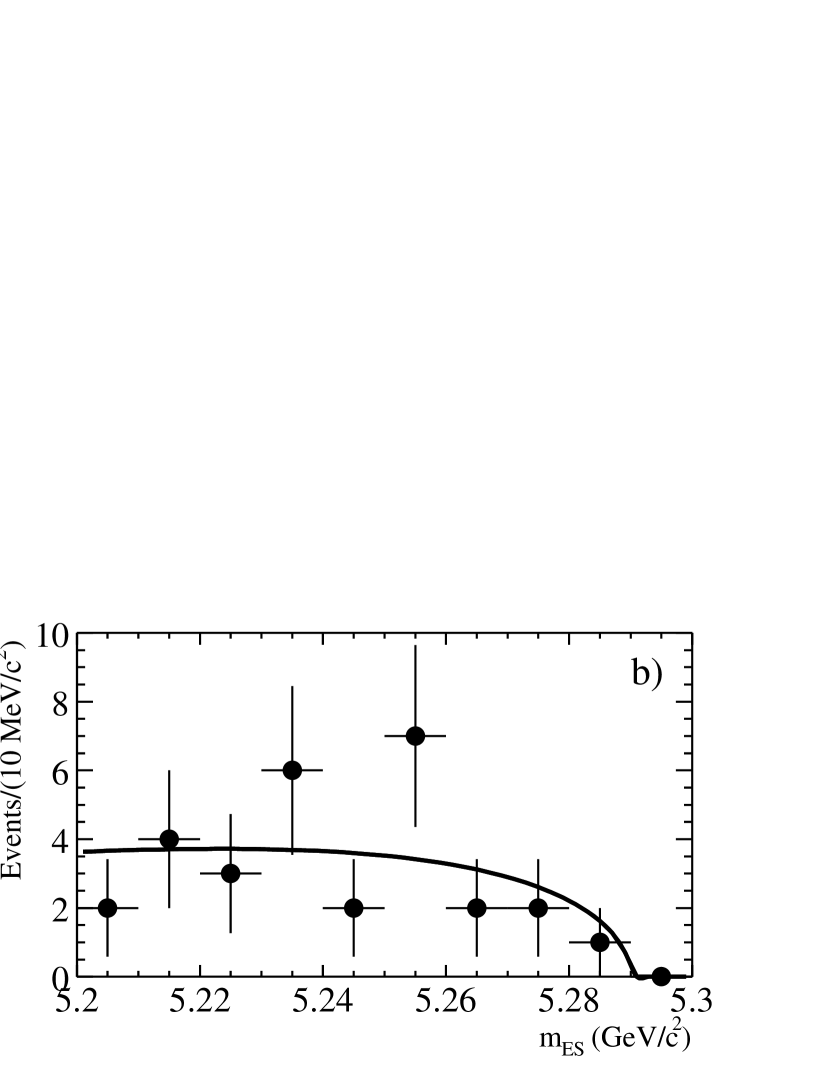
Figure 3:
a) Fit to the distribution in the grand sideband
to a first-order polynomial; b) fit of the distribution in the lower
sideband
with the ARGUS function Argus . See text for the definition of the
sidebands.
A single event in the on–resonance data meets these selection criteria, as shown in Fig. 2.
A number of
exclusive decay modes that can mimic decays have been studied
with high statistics (equivalent to assuming branching fractions
of the order of
10-6). We expect negligible contributions from
, , , and , and a combined
contribution of events from and
.
To further explore the question of remaining background in the signal region,
we define the grand sideband
consisting of a rectangular region within the limits
and
(see Fig. 2, left dashed box).
In this region we find a prediction of events from continuum
Monte Carlo simulations, in good agreement
with the observation of () events from on–resonance data (off-resonance data
of 2.2 fb-1 scaled to the full analyzed luminosity of 19.4 fb-1).
We parameterize the background using on–resonance data.
The background in is parameterized in the grand sideband
with a first-order polynomial (see Fig. 3a); the background in is parameterized in the lower sideband, which is a rectangular region within the limits
and , with an empirical threshold function
first employed by the ARGUS collaboration Argus (see Fig. 3b).
Both parameterizations describe the corresponding distribution very well with a , normalized
to the number of degrees of freedom, of about 0.8.
Using this parameterization we are able to extrapolate the on–resonance grand sideband data
into the signal region and find an expectation of events.
This is consistent
with the hypothesis that the observed event in the signal region is due to continuum background.
Nevertheless,
we choose to
quote a conservative upper limit, assuming that the observed event in the signal region is
in fact due to the decay .
We use Poisson statistics to set an upper limit on the branching fraction.
The upper limit on the branching fraction is obtained from
,
where is the upper limit on the number of observed events,
the signal reconstruction efficiency of (10.7 0.2)% and
is the number of produced and mesons.
is equal to the number
of events since we assume the number of events to be 50 % of the number
of produced events.
This yields an upper limit on the branching fraction, based on statistics alone,
of
at the 90% confidence level.
Table 2: Summary of systematic uncertainties on the signal efficiency and the number
of produced as an error on the branching fraction determination.
The total systematic uncertainty is the sum of the individual contributions added
in quadrature.
systematic uncertainty
(/)%
Number of produced
1.6
Photon detection efficiency
6.5
veto
2.0
veto
2.0
selection
5.3
selection
2.6
Track finding efficiency
1.8
Number of signal Monte Carlo events
2.0
Total
9.6
Systematic effects arise from the modeling of the signal efficiency and the estimation
of the number of mesons in the data sample.
A summary of all systematic errors
is provided in Table 2.
The most significant sources are
the photon detection efficiency
and
the selection
due to the
uncertainty in the photon energy scale and photon energy resolution.
The systematic uncertainty on the photon detection efficiency has been
determined from a study which compares the precisely know ratio PDG of
the and rate
in Monte Carlo events and data.
This uncertainty depends on the event multiplicity, whose effect is estimated by embedding
photon bumps from radiative Bhabha events into both generic meson
and generic meson Monte Carlo events.
The uncertainty in the energy scale is estimated with a study of symmetric
decays,
where both photons are within a narrow energy range.
Systematic shifts of the reconstructed
mass from the nominal value measure the uncertainty in the energy scale in this
energy range.
In order to include our systematic uncertainty in the determination of the upper limit,
we follow a prescription given by Cousins .
The branching fraction is calculated as , where is the number of
observed events and is the sensitivity,
given by the product of the number of events
and the overall selection efficiency.
Assuming a normal distribution for the uncertainty in ,
the systematic uncertainty is accounted for by convoluting the Poisson probability
distribution for the assumed branching fraction with a Gaussian error distribution for .
Our total systematic uncertainty of 9.6% included in this way has a negligible effect on the upper limit.
In summary,
we have performed a search for the decay . We observe one event in
the signal region and infer an upper limit on the branching fraction
of
at the 90% confidence level.
This result improves the existing limit
L3
by over a factor of 20.
We are grateful for the
extraordinary contributions of our PEP-II colleagues in
achieving the excellent luminosity and machine conditions
that have made this work possible.
The collaborating institutions wish to thank
SLAC for its support and the kind hospitality extended to them.
This work is supported by
DOE
and NSF (USA),
NSERC (Canada),
IHEP (China),
CEA and
CNRS-IN2P3
(France),
BMBF
(Germany),
INFN (Italy),
NFR (Norway),
MIST (Russia), and
PPARC (United Kingdom).
Individuals have received support from the Swiss NSF,
A. P. Sloan Foundation,
Research Corporation,
and Alexander von Humboldt Foundation.
References
(1)
G. G. Devidze and G. R. Jibuti, Phys. Lett. B 429, 48 (1998).
(2)
T. M. Aliev and G. Turan, Phys. Rev. D48, 1176 (1993).
(3)
L3 Collaboration, M. Acciarri et al., Phys. Lett. B 363, 137 (1995).
(4)BABAR Collaboration, B. Aubert et al.,
hep-ex/0105044,
submitted to Nucl. Instr. Methods A.
(5)
PEPII – An Asymmetric Factory,
Conceptual Design Report SLAC-0418.
(6)
GEANT – Detector Description and Simulation Tool,
CERN Program Library Long Writeup W5013, 1994.
(7)
G. C. Fox and S. Wolfram, Phys. Rev. Lett. 41, 1581 (1978).
(8)
Particle Data Group, D. E. Groom et al., Eur. Phys. Jour. C 15, 1 (2000).
(9)
For signal Monte Carlo events the and distribution are fitted with the Crystal Ball function
where and
.
is a normalization factor, and are the fitted peak position and width
of the Gaussian portion of the function, and and are the fitted point at which the function
transitions to the power function and the exponent of the power function, respectively.
D. Antreasyan, Crystal Ball Note 321 (1983).
(10)
T. Sjöstrand, Comput. Phys. Commun. 82, 74 (1994).
(11)
H. Albrecht et al., Z. Phys. C48, 543 (1990).
(12) R. D. Cousins and V. L. Highland, Nucl. Instr. and Methods A 320, 331 (1992).