Study of three-body charmless decays at Belle
Abstract
Using a data sample of fb-1 collected by the Belle detector, three body charmless decays have been studied. With no assumptions on the intermediate mechanisms, the following branching fractions have been measured for the first time and . We also present the first observations of the decay mode with a branching fraction of and the decay mode with a product branching fraction of .
pacs:
PACS numbers: 13.20.HK. Abe9, K. Abe37, R. Abe27, I. Adachi9, Byoung Sup Ahn16, H. Aihara39, M. Akatsu20, K. Asai21, M. Asai10, Y. Asano44, T. Aso43, V. Aulchenko2, T. Aushev14, A. M. Bakich35, E. Banas25, S. Behari9, P. K. Behera45, D. Beiline2, A. Bondar2, A. Bozek25, T. E. Browder8, B. C. K. Casey8, P. Chang24, Y. Chao24, K.-F. Chen24, B. G. Cheon34, R. Chistov14, S.-K. Choi7, Y. Choi34, L. Y. Dong12, J. Dragic19, A. Drutskoy14, S. Eidelman2, V. Eiges14, Y. Enari20, C. W. Everton19, F. Fang8, H. Fujii9, C. Fukunaga41, M. Fukushima11, N. Gabyshev9, A. Garmash2,9, T. J. Gershon9, A. Gordon19, K. Gotow46, H. Guler8, R. Guo22, J. Haba9, H. Hamasaki9, K. Hanagaki31, F. Handa38, K. Hara29, T. Hara29, N. C. Hastings19, H. Hayashii21, M. Hazumi29, E. M. Heenan19, Y. Higasino20, I. Higuchi38, T. Higuchi39, T. Hirai40, H. Hirano42, T. Hojo29, T. Hokuue20, Y. Hoshi37, K. Hoshina42, S. R. Hou24, W.-S. Hou24, S.-C. Hsu24, H.-C. Huang24, Y. Igarashi9, T. Iijima9, H. Ikeda9, K. Ikeda21, K. Inami20, A. Ishikawa20, H. Ishino40, R. Itoh9, G. Iwai27, H. Iwasaki9, Y. Iwasaki9, D. J. Jackson29, P. Jalocha25, H. K. Jang33, M. Jones8, R. Kagan14, H. Kakuno40, J. Kaneko40, J. H. Kang48, J. S. Kang16, P. Kapusta25, N. Katayama9, H. Kawai3, H. Kawai39, Y. Kawakami20, N. Kawamura1, T. Kawasaki27, H. Kichimi9, D. W. Kim34, Heejong Kim48, H. J. Kim48, Hyunwoo Kim16, S. K. Kim33, T. H. Kim48, K. Kinoshita5, S. Kobayashi32, S. Koishi40, H. Konishi42, K. Korotushenko31, P. Krokovny2, R. Kulasiri5, S. Kumar30, T. Kuniya32, E. Kurihara3, A. Kuzmin2, Y.-J. Kwon48, J. S. Lange6, G. Leder13, S. H. Lee33, C. Leonidopoulos31, Y.-S. Lin24, D. Liventsev14, R.-S. Lu24, J. MacNaughton13, D. Marlow31, T. Matsubara39, S. Matsui20, S. Matsumoto4, T. Matsumoto20, Y. Mikami38, K. Misono20, K. Miyabayashi21, H. Miyake29, H. Miyata27, L. C. Moffitt19, G. R. Moloney19, G. F. Moorhead19, S. Mori44, T. Mori4, A. Murakami32, T. Nagamine38, Y. Nagasaka10, Y. Nagashima29, T. Nakadaira39, T. Nakamura40, E. Nakano28, M. Nakao9, H. Nakazawa4, J. W. Nam34, Z. Natkaniec25, K. Neichi37, S. Nishida17, O. Nitoh42, S. Noguchi21, T. Nozaki9, S. Ogawa36, T. Ohshima20, Y. Ohshima40, T. Okabe20, T. Okazaki21, S. Okuno15, S. L. Olsen8, H. Ozaki9, P. Pakhlov14, H. Palka25, C. S. Park33, C. W. Park16, H. Park18, L. S. Peak35, M. Peters8, L. E. Piilonen46, E. Prebys31, J. L. Rodriguez8, N. Root2, M. Rozanska25, K. Rybicki25, J. Ryuko29, H. Sagawa9, Y. Sakai9, H. Sakamoto17, M. Satapathy45, A. Satpathy9,5, S. Schrenk5, S. Semenov14, K. Senyo20, Y. Settai4, M. E. Sevior19, H. Shibuya36, B. Shwartz2, A. Sidorov2, S. Stanič44, A. Sugi20, A. Sugiyama20, K. Sumisawa9, T. Sumiyoshi9, J.-I. Suzuki9, K. Suzuki3, S. Suzuki47, S. Y. Suzuki9, S. K. Swain8, H. Tajima39, T. Takahashi28, F. Takasaki9, M. Takita29, K. Tamai9, N. Tamura27, J. Tanaka39, M. Tanaka9, G. N. Taylor19, Y. Teramoto28, M. Tomoto9, T. Tomura39, S. N. Tovey19, K. Trabelsi8, T. Tsuboyama9, T. Tsukamoto9, S. Uehara9, K. Ueno24, Y. Unno3, S. Uno9, Y. Ushiroda9, S. E. Vahsen31, K. E. Varvell35, C. C. Wang24, C. H. Wang23, J. G. Wang46, M.-Z. Wang24, Y. Watanabe40, E. Won33, B. D. Yabsley9, Y. Yamada9, M. Yamaga38, A. Yamaguchi38, H. Yamamoto8, T. Yamanaka29, Y. Yamashita26, M. Yamauchi9, S. Yanaka40, J. Yashima9, M. Yokoyama39, K. Yoshida20, Y. Yusa38, H. Yuta1, C. C. Zhang12, J. Zhang44, H. W. Zhao9, Y. Zheng8, V. Zhilich2, and D. Žontar44
1Aomori University, Aomori
2Budker Institute of Nuclear Physics, Novosibirsk
3Chiba University, Chiba
4Chuo University, Tokyo
5University of Cincinnati, Cincinnati OH
6University of Frankfurt, Frankfurt
7Gyeongsang National University, Chinju
8University of Hawaii, Honolulu HI
9High Energy Accelerator Research Organization (KEK), Tsukuba
10Hiroshima Institute of Technology, Hiroshima
11Institute for Cosmic Ray Research, University of Tokyo, Tokyo
12Institute of High Energy Physics, Chinese Academy of Sciences, Beijing
13Institute of High Energy Physics, Vienna
14Institute for Theoretical and Experimental Physics, Moscow
15Kanagawa University, Yokohama
16Korea University, Seoul
17Kyoto University, Kyoto
18Kyungpook National University, Taegu
19University of Melbourne, Victoria
20Nagoya University, Nagoya
21Nara Women’s University, Nara
22National Kaohsiung Normal University, Kaohsiung
23National Lien-Ho Institute of Technology, Miao Li
24National Taiwan University, Taipei
25H. Niewodniczanski Institute of Nuclear Physics, Krakow
26Nihon Dental College, Niigata
27Niigata University, Niigata
28Osaka City University, Osaka
29Osaka University, Osaka
30Panjab University, Chandigarh
31Princeton University, Princeton NJ
32Saga University, Saga
33Seoul National University, Seoul
34Sungkyunkwan University, Suwon
35University of Sydney, Sydney NSW
36Toho University, Funabashi
37Tohoku Gakuin University, Tagajo
38Tohoku University, Sendai
39University of Tokyo, Tokyo
40Tokyo Institute of Technology, Tokyo
41Tokyo Metropolitan University, Tokyo
42Tokyo University of Agriculture and Technology, Tokyo
43Toyama National College of Maritime Technology, Toyama
44University of Tsukuba, Tsukuba
45Utkal University, Bhubaneswer
46Virginia Polytechnic Institute and State University, Blacksburg VA
47Yokkaichi University, Yokkaichi
48Yonsei University, Seoul
I Introduction
During the last few years, a considerable amount of new information on charmless hadronic decays of B-mesons has been reported, primarily by the CLEO Collaboration. The discoveries of the and decay modes [1] have provided a real basis for searches for direct-CP violating effects in the B-meson system.
However, because of large combinatoric backgrounds, studies of charmless B decays have concentrated mainly on two-body decay processes. In this paper, we report the results of a study of decays ( stands for a charged pion or kaon) where no assumptions are made about intermediate hadronic resonances. The inclusion of charge conjugate states is implicit throughout this report unless explicitly stated otherwise.
II The Belle detector
Belle is large-solid-angle spectrometer based on a 1.5 Tesla superconducting solenoid magnet. Charged particle tracking is provided by a silicon vertex detector (SVD) and a cylindrical drift chamber (CDC) that surround the interaction region. The SVD consists of three approximately cylindrical layers of double-sided silicon strip detectors; one side of each detector measures the coordinate and the other the - coordinate. The CDC has 50 cylindrical layers of anode wires; the inner three layers have instrumented cathodes for coordinate measurements [4]. Twenty of the wire layers are inclined at small angles to provide small-angle stereo measurements of coordinates along the particle trajectories. The charged particle acceptance covers the laboratory polar angle between and corresponding to about 92% of the full solid angle in the CMS.
Tracks are fit using an incremental Kalman filtering technique, where individual measurements found by the CDC pattern recognition algorithm are added successively to update the track’s parameters and covariance matrix at each measurement surface. This approach to track fitting minimizes the effects of multiple Coulomb scattering on the determination of the track parameters. Hits from the SVD are associated and included during the last steps of this recursion. The momentum resolution is determined from cosmic rays and events to be , where is the transverse momentum in GeV/.
Charged hadron identification is provided by measurements in the CDC, a mosaic of 1188 aerogel Čerenkov counters (ACC), and a barrel-like array of 128 time-of-flight scintillation counters (TOF). The measurements have a resolution for hadron tracks of 6.9% and are useful for separation for GeV/ and GeV/ where is the laboratory momentum. The TOF system has a time resolution for hadrons that is ps and provides separation for GeV/ [5]. The indices of refraction of the ACC elements vary with polar angle to match the kinematics of the asymmetric energy environment of Belle and cover the range GeV/ [6].
Hadron identification is accomplished by combining the information from these three subsystems into a single number using the likelihood method:
where stands for the hadron type (, , ). High momentum tagged kaons and pions from kinematically selected ; decays are used to determine a charged particle identification efficiency of about 90% and a misidentification probability of about 8%.
Electromagnetic showering particles are detected in an array of 8736 CsI(Tl) crystals located in the magnetic volume and covering the same solid angle as the charged particle tracking system [7]. The energy resolution for electromagnetic showers is , ( in GeV). Neutral pions are detected via their decay. The mass resolution varies slowly with energy, averaging MeV.
Electron identification in Belle is based on a combination of measurements in the CDC, the response of the ACC, and the position, shape and total energy (i.e. ) of the shower registered in the CsI calorimeter. The electron identification efficiency, determined by embedding Monte Carlo tracks in multihadron data, is greater than 92% for tracks with GeV/ and the hadron misidentification probability, determined from decays, is below 0.3%.
The 1.5 T magnetic field is returned via an iron yoke that is instrumented to detect muons and mesons. This detection system, called the KLM, consists of alternating layers of charged particle detectors and 4.7 cm thick steel plates. The total steel thickness of 65.8 cm plus the material of the inner detector corresponds to 4.7 nuclear interaction lengths at normal incidence. The system covers polar angles between and and the overall muon identification efficiency, determined by a track embedding study similar to that used in the electron case, is greater than 87% for tracks reconstructed in the CDC with GeV/. The corresponding pion misidentification probability determined from decays is less than 2%.
III Event selection
Charged tracks are required to satisfy a set of track quality cuts based on the average hit residual and the impact parameters in both the - and - planes. We require that the transverse track momenta be greater than 100 MeV/ to reduce low momentum combinatoric background. All the cuts used for the selection of charged tracks are listed in Table I.
| Parameter | Cut value |
|---|---|
| Transverse momentum, | GeV/c |
| Impact parameter, | cm |
| Impact parameter, | cm |
| Number of CDC axial hits, | |
| Number of CDC stereo hits, |
Charged particles are identified as ’s or ’s by cutting on the likelihood ratio (PID):
At large momenta (2.5 GeV/) only the ACC and are used since here the TOF provides no significant separation of kaons and pions. For all three-body final states except the final state the likelihood ratio for kaon candidates is required to be greater than 0.8. Otherwise the charged track is identified as a pion. For the final states, we require to maintain high efficiency.
All charged tracks are also required to satisfy an electron veto requirement, which demands that the electron likelihood is less than 0.95. In addition, all charged kaon candidates are required to satisfy a proton veto:
The candidate events are identified by using the beam-constrained mass and the energy difference , where and are the measured energy and 3-momentum of the candidate in the rest frame and is the total energy in rest frame.
The signal distribution is well modeled by a single Gaussian function. The central value and width of the Gaussian function are determined from the , signal to be 5.2805 GeV/ and 2.75 MeV/ respectively. The resolution is primarily due to the energy spread of the and beams and is found to be independent of the particular three charged track final state. We use the ARGUS function [8] to describe the background in the distribution: , where and is a free fit parameter.
The signal shape is parameterized by the sum of two Gaussians with the same mean. The shape of the background in the distribution from non-resonant continuum events is parameterized by a first order polynomial. The shape due to background from other and decay processes has a substantial dependence on the final state being studied. Unless explicitly stated otherwise, the contributions from these backgrounds are also parameterized by a first order polynomial.
In the following, we refer to the “ signal region;” this is defined as:
GeV/; MeV.
IV Background suppression
An important issue for this analysis is the suppression of the large combinatoric background that is dominated by continuum events. To suppress this background, we use a set of variables that characterize the event topology.
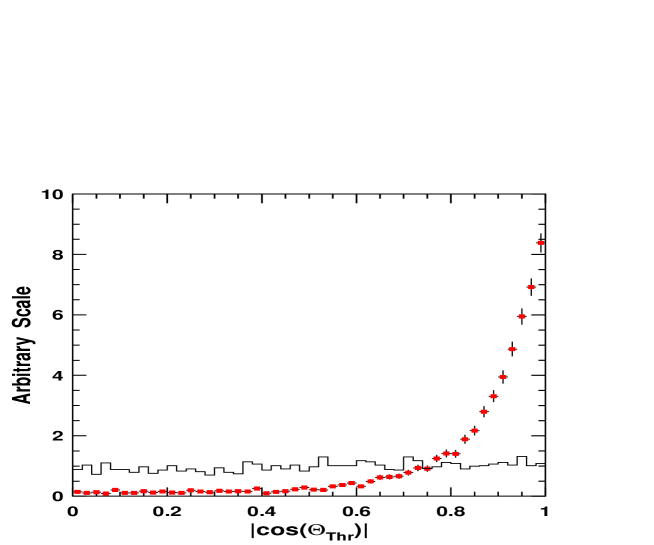
Since the two mesons produced from the decay are nearly at rest in the CMS frame, the angles of the decay products of two ’s are uncorrelated and the events tend to be spherical. In contrast, hadrons from continuum events tend to exhibit a two-jet structure. Figure 1a shows distributions of , where is the angle between the thrust axis of the candidate and that of the rest of the event. The distribution is strongly peaked near for events while it is nearly flat for events. We require for all modes under consideration; this eliminates 83% of the continuum background and retains 79% of the signal events.
After the imposition of the , and requirements, the remaining events still have some differences in topology that are exploited for further continuum suppression. We construct a “Virtual Calorimeter” [9] by dividing the space around the candidate thrust axis into nine polar angle intervals of each; the -th interval covers angles from ( - 1) to . We define the momentum flows, , into the -th interval as a scalar sum of the momenta of all charged tracks and neutral showers directed in that interval. The momentum flow in corresponding forward and backward intervals are combined.
Angular momentum conservation provides some additional discrimination between and continuum events. In production, the direction of the candidate thrust axis, , with respect to the beam axis in the cms frame tends to maintain the distribution of the primary quarks. The direction of the candidate thrust axis for events is uniform. The candidate direction, , with respect to the beam axis exhibits a distribution for events and is uniform for events.
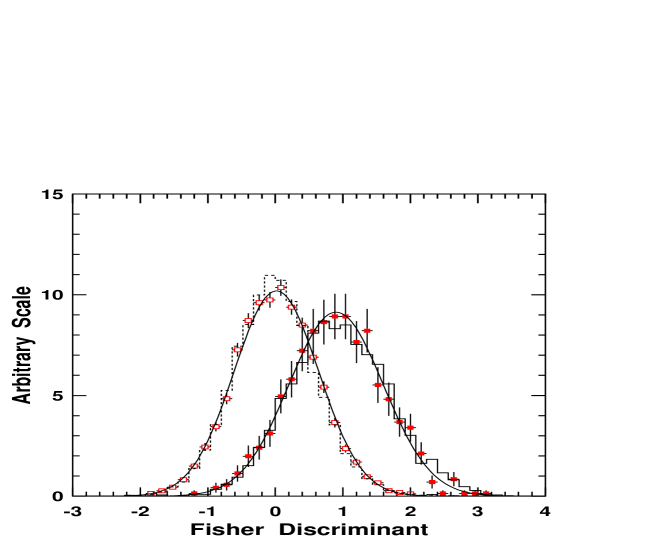
A Fisher discriminant [10] is formed from 11 variables: the nine variables of the “Virtual Calorimeter”, , and . The discriminant is the linear combination
of the input variables, , that maximizes the separation between signal and background. The coefficients are determined from the Monte Carlo simulation using a large set of continuum events and signal events modeled as . We use the same set of coefficients for all modes under study. Figure 1b shows the distributions for the Monte Carlo signal in the mode , and the data signal in the mode followed by . The distributions for Monte Carlo background and below-threshold background data for modes comprising three charged tracks are also presented in Fig. 1b. The distributions for both the signal and background are fitted to Gaussian functions. The separation between the mean values of the signal and background distributions is approximately 1.3 times the signal width.
For the and final states we make the requirement on the Fisher discriminant variable ; this rejects 90% of continuum background with about 54% efficiency for the signal. In case of the final states, the continuum background is much smaller and we make the looser requirement . This rejects 53% of continuum background with about 89% efficiency for the signal.
To determine the dominant sources of background from other -meson decay modes we use a large set of Monte Carlo generated events where both mesons decay generically. Most of the related background is found to originate from and decays. To suppress this type of background we apply the requirements on invariant masses of two-particle combinations that are described below. The background from the semileptonic decays is additionally suppressed by the electron veto requirement. The most significant background to final state from the rare decays is found to originate from the followed by . We expect about 3% of the events of this type to satisfy all the selection criteria. We find no significant background to the final state from other rare decays of mesons.
V Results of the Analysis
A
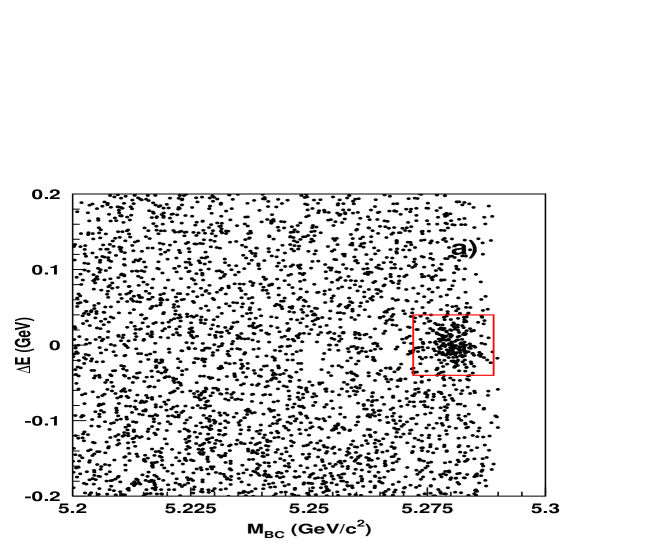
For the final state, we select candidates formed from three charged tracks where one track is positively identified as a kaon and the other two tracks are consistent with the pion hypothesis. The resulting two dimensional versus plot for all selected combinations is presented in Fig. 2a where the signal region is inside the box. Figure 2b shows the Dalitz plot for candidates in the signal region. Large contributions from where and where are apparent in the Dalitz plot. Modes with contribute to this final state due to the muon-pion misidentification. The contribution from the submode is found to be negligible (less than 0.5%) after the electron veto requirement. For further analysis we exclude and signals by imposing requirements on the invariant masses of two intermediate particles:
GeV/;
GeV/; GeV/,
where and are pion candidates. For the rejection, we use the muon mass hypothesis for charged tracks to calculate .
The and distributions for the events remaining after the exclusion of these large signals are presented in Fig. 3a and Fig. 3b, respectively. Here a significant enhancement in the signal region is still observed; the results of a fit to this distribution are presented in Table IV. The expected and distributions, which are the sum of luminosity-scaled off-resonance data and Monte Carlo, are shown as open histograms in Figs. 3a and 3b, respectively; the contributions from only the Monte Carlo sample are shown as hatched histograms. In the spectrum, the shape of the background component is approximated as an exponential function with a parameter determined from the Monte Carlo. As can be seen from the hatched histograms in Figs. 3a and 3b, there is no significant contribution to the signal from generic decays after the large known backgrounds have been removed.
To examine possible intermediate two-body states in the observed signal, we analyze the and invariant mass spectra shown in Figs. 4a and 4b, respectively. To suppress the feed-across between the and states we require the () invariant mass to be larger than 2.0(1.5) GeV/c2 when making the () projection. The hatched histograms shown in Figs. 4a and 4b are the invariant mass spectra for background events in the sidebands:
GeV/ and
orGeV,
scaled by area.
The invariant mass spectrum is characterized by a narrow peak around 0.9 GeV/ which is identified as and a broad enhancement above 1.0 GeV/ which is subsequently referred to as .
In the invariant mass spectrum two distinct structures in the low mass region are observed. One is slightly below 1.0 GeV/ which is identified as and the other between 1.0 GeV/ and 1.5 GeV/ and referred to as . The peak around 3.4 GeV/ is consistent with the process , , and is the subject of a different analysis [11]. In this paper we exclude the candidates from the analysis of two-body final states by applying the requirement on the invariant mass: GeV/.
For further analysis we subdivide the Dalitz plot area into seven non-overlapping regions as defined in Table II. Regions from I to V are arranged to contain the major part of the signal from the , , , , and final states, respectively. The area in the Dalitz plot where and resonances overlap is covered by the region VI, and region VII covers the rest of the Dalitz plot. The and distributions for each region are shown in Fig. 5 and the results of the fits are summarized in Table II. As can be seen from Fig. 5 and Table II, the contribution from region VII to the total number of signal events is negligibly small.
| Region | Mass range, GeV/ | Efficiency, % | Yield, event | Significance, |
|---|---|---|---|---|
| I | ; | 6.1 | ||
| II | ; | 4.7 | ||
| III | ; | 1.3 | ||
| IV | ; | 6.9 | ||
| V | ; | 4.3 | ||
| VI | ; | 2.9 | ||
| VII | ; | 0.9 |
B
For the selection of events, we use events with three charged tracks that are positively identified as kaons. To suppress the background caused by misidentification, we exclude candidates if the invariant mass of any pair of oppositely charged tracks from the candidate is consistent with the hypothesis within 12 MeV (), independently of the PID information.
Figure 6a shows the two-dimensional versus plot for all selected combinations and Fig. 6b shows the Dalitz plot for candidate events in the signal region. Since in this case there are two same-charge kaons, we distinguish the combinations with smaller, , and larger, , invariant masses. We avoid double entries by forming the Dalitz plot as versus , as shown in Fig. 6b.
The signal from the Cabibbo-suppressed , decay mode is apparent as a vertical strip in the Fig. 6b Dalitz plot. The notation means that the meson decays to the CP eigenstate. The corresponding Cabibbo-allowed , decays can also contribute to this final state as a result of pion-kaon misidentification. The detailed analysis of the decays of type is described in ref. [12].
We exclude candidates consistent with the , hypothesis from further analysis by imposing the requirement on the invariant mass:
GeV.
The and distributions after the exclusion of mesons are presented in Figs. 7a and 7b, respectively. A large peak in the signal region is apparent in both distributions. The results of a fit to the distribution are presented in Table IV.
The open histograms in Figs. 8a and 8b show the and distributions for selected events, respectively; the hatched histograms show the corresponding spectra for the sidebands:
GeV/ and
orGeV,
scaled by area. The spectrum, Fig. 8a, is characterized by a narrow peak at 1.02 GeV/ corresponding to the meson and a broad structure around 1.5 GeV/, which is subsequently referred to as . To exclude the possible contribution from the , final state we apply the requirement on the invariant mass: GeV/. The study of this final state is described in ref. [11].
For further analysis we subdivide the area of the Dalitz plot into the four non-overlapping regions defined in Table III. Regions I and II are arranged to contain the major part of the signal from the and final states respectively. Regions III and IV cover the rest part of the Dalitz plot. The and distributions for each region are shown in Fig. 9 and the results of the fit are summarized in Table III.
| Region | Mass range, GeV/ | Efficiency, % | Yield, event | Significance, |
|---|---|---|---|---|
| I | 6.7 | |||
| II | 8.9 | |||
| III | ; | 3.3 | ||
| IV | ; | 6.7 |
VI Branching Fractions Results
To determine branching fractions we normalize our results to the observed , signal. Although this introduces a % systematic error due to the uncertainty in the branching fraction, it removes systematic effects in the particle identification efficiency, charged track reconstruction efficiency and the systematic uncertainty due to the cuts on event shape variables.
We calculate the branching fraction for meson decay to a particular final state via the relation:
| (1) |
where and are the numbers of reconstructed events for the particular final state and for the reference process, respectively; and are the corresponding reconstruction efficiencies.
The number of signal events for the normalization processes and is found to be for the selection requirements and for requirements used for the other combinations with the reconstruction efficiencies of 31.3% and 16.8% respectively.
A Three-body branching fractions
For branching fraction calculations we use the signal yield extracted from the fit to the corresponding distribution since the distribution suffers more from background. The reconstruction efficiency for three-body final states is determined from the Monte Carlo simulations of events that are generated to have a uniform distribution over the Dalitz plot.
The branching fraction results are summarized in Table IV. The first quoted error is statistical and the second is systematic. We do not observe a statistically significant signal in the , or final states and place 90% confidence level upper limits on their respective branching fractions.
| Mode | Efficiency, % | Yield, event | |
|---|---|---|---|
| 16.6 | |||
| 24.5 | |||
| 16.2 | |||
| 13.3 | |||
| 13.2 |
The following sources of systematic errors are found to be the dominant:
-
uncertainty due to the nonuniformity of the reconstruction efficiency over the Dalitz plot. It is found to be 7.6% for and 3.7% for ;
-
uncertainty in and branching fractions: 9.7%;
-
uncertainty in the parameterization of the signal and background shape in . This is 8.5% for and 4.7% for ;
-
kaon identification efficiency for modes with more than one kaon in the final state: 3% per kaon;
B Exclusive two-body branching fractions in the final state.
In the determination of the branching fractions for exclusive two-body final states, we take into account the possibility of interference between wide resonances. This requires some assumptions about the states that are being observed and, as a consequence, introduces some model dependence into the extraction of the exclusive branching fractions. The present level of statistics does not permit unambiguous interpretation of the and states and, thus, it is not possible to use the data to fix all of the input model parameters. For this analysis we assume that the observed and states are scalars. While this does not contradict the observed signal, some contributions from vector () and tensor () resonances can not be excluded. The uncertainty related to this assumption is included in the model-dependent error described below. We ascribe to the state the parameters of ( = 1412 MeV/, = 294 MeV) and to state the parameters of ( = 1370 MeV/, = 400 MeV) [13].
For further analysis we make following assumptions:
-
The observed signal in the final state can be described by some number of two-body final states. We restrict ourselves with the following set of exclusive two-body final states: , , , and . We enumerate these final states as 1 through 5 in the order they are mentioned above.
-
Given this set of two-body final states, we determine the exclusive branching fractions neglecting the effects of interference. The uncertainty due to possible interference between different intermediate states is included in the final result as a model-dependent error.
In order to extract the signal yield for each two-body final state, we perform a simultaneous likelihood fit to the distributions for the seven regions of the Dalitz plot (see Fig. 5 and Table II). We express the expected number of signal events in the -th region of the Dalitz plot as a linear combination:
where is the total number of signal events in the -th two-body final state and is the probability for the -th final state to contribute to the -th region in the Dalitz plot. The matrix is determined from a Monte Carlo simulation and includes the reconstruction efficiency. This procedure takes correlations between different channels into account when determining the statistical errors.
The results of the fit are summarized in Table V. Combining all the relevant numbers and using Eq. 1, we calculate the product of branching fractions , where denotes the two-body intermediate resonant state. The branching fraction result for the final state is in agreement with the results of a separate study of meson decays to the pseudo-scalar and vector final states [14].
We present three types of error for the branching fractions: the first error is statistical, the second is systematic, and the third reflects the model-dependent uncertainty. In general, the model-dependent error is due to uncertainties in the effects of interference between different resonant states. We estimate this error by means of a Monte Carlo simulation that includes interference effects between all final states mentioned above. We vary the relative phases of resonances and determine the signal yield using the procedure described above. The maximal deviations from the central values are used as an estimate of the model dependence of the obtained branching fractions.
| Two body mode | Efficiency, % | Yield, events | Significance, | , |
|---|---|---|---|---|
| 19.1 | 6.2 | |||
| 17.0 | 4.1 | |||
| 18.9 | 0.2 | |||
| 19.3 | 6.0 | |||
| 17.3 | 3.2 |
We find that the model-dependent errors associated with the wide resonances introduce significant uncertainties into the branching fraction determination. In the case of the final state, this effect is enhanced by the smallness of the signal itself. The effects of interference of a small signal with the large signal or with a broad resonance could result in as much as a doubling of the observed final state or its total suppression. Since we do not observe a significant signal in this channel, we report a 90% confidence level upper limit.
C Exclusive two-body branching fractions in final state.
In the case of the three charged kaons final state we clearly observe the presence of the meson plus a very broad structure that we currently cannot interpret unambiguously. It could be a complex superposition of several intermediate states and some contribution from non-resonant decay is also possible. For our study of systematic and model-dependent uncertainties, we construct a simplified model and parameterize the structure as a hypothetical scalar state with MeV/ and MeV. We find qualitative agreement between the experimental Dalitz plot distribution of the signal events and that obtained from the Monte Carlo simulation with this simple model.
Then we extract the signal yield for the two-body final states: and the so-called , which is, in fact, all of the remaining signal. We follow the same procedure as we used for the final state. The signal yields are determined from a simultaneous fit to the distributions for four separate regions of the Dalitz plot (see Fig. 9 and Table III). The results of the fit are summarized in Table VI. The branching fraction result for the final state is in good agreement with the results of a dedicated analysis of the and final states [15], . This latter number should be considered as the current “official” Belle result for the branching fraction.
| Two body mode | Efficiency, % | Yield, events | Significance, | , |
|---|---|---|---|---|
| 25.1 | 6.4 | |||
| 22.1 | 12.1 |
We determine the model-dependent error the same way as we did for the final state. In the case of the final state the model dependent error is found to be much smaller then in final state. This is mainly due to the narrow width of the meson.
VII Discussion & Conclusion
The high quality Belle’s separation allows us to measure for the first time the branching ratios for the three-body modes and without assumptions about particular intermediate mechanisms. CLEO [16] and BaBar [17] have previously placed upper limits on non-resonant three-body decays; the reported numbers for (CLEO: , BaBar: ) and (CLEO: ) are lower than those presented in this paper. A comparison of the applied selection criteria shows that CLEO and BaBar restricted their analyses to the region of the invariant masses above 2 GeV/ for any pair of the particles. This requirement effectively removes most of the low mass resonances that provide the dominant contribution to our observed signal. They assume a uniform distribution of events over the Dalitz plot to obtain the limits quoted above.
The upper limits reported here for the , and modes are considerably more restrictive than previous limits from CLEO [16] (, ) and OPAL [18] ().
Significant signals are observed for the first time in the decay modes and with branching fraction products of and , respectively. The latter final state is of interest since this is the first observation of a decay to a charmless scalar-pseudoscalar final state. The significant enhancement in the invariant mass spectrum above the mass (referred to as ) agrees with the scalar hypothesis. This is also in agreement with theoretical predictions [19, 20] for the branching fraction made based on the factorization model. Nevertheless, we cannot exclude some contribution from the tensor state.
Large uncertainties arise in the interpretation of the peak with a invariant mass around 1300 MeV/ in the system. There are two known candidate states: the and [13]. Attributing the peak to the , with its rather small coupling to [21], would lead to an unusually large branching fraction for a charmless decay mode. On the other hand, as recently shown in [22], factorization model predicts a very small branching ratio for . If our observation is, in fact, due to the , this would provide evidence for a significant nonfactorizable contribution.
We cannot identify the broad structure observed in the final state above meson. It is hardly compatible with the presence of single scalar state either and [13]. We also cannot exclude the presence of a non-resonant contribution or the case of several resonances contributing to the excess in the invariant mass spectrum seen around 1.5 GeV/.
We find that effects of interference between different two-body intermediate states can have a significant influence on the observed two-particle mass spectra and a full amplitude analysis of three-body meson decays is required for a more complete understanding. This will be possible with increased statistics.
Acknowledgement
We wish to thank the KEKB accelerator group for the excellent operation of the KEKB accelerator. We acknowledge support from the Ministry of Education, Culture, Sports, Science, and Technology of Japan and the Japan Society for the Promotion of Science; the Australian Research Council and the Australian Department of Industry, Science and Resources; the Department of Science and Technology of India; the BK21 program of the Ministry of Education of Korea and the CHEP SRC program of the Korea Science and Engineering Foundation; the Polish State Committee for Scientific Research under contract No.2P03B 17017; the Ministry of Science and Technology of Russian Federation; the National Science Council and the Ministry of Education of Taiwan; the Japan-Taiwan Cooperative Program of the Interchange Association; and the U.S. Department of Energy.
REFERENCES
-
[1]
G. Godang et al. (CLEO Collaboration),
Phys. Rev. Lett. 80, 3456 (1998).
C.P. Jessop et al. (CLEO Collaboration), Phys. Rev. Lett. 85, 2881 (2000).
D. Cronin-Hennessy et al. (CLEO Collaboration), Phys. Rev. Lett. 85, 515 (2000). - [2] K. Abe et al. (Belle Collaboration), KEK Progress Report 2000-4 (2000), to be published in Nucl. Inst. and Meth. A.
- [3] KEKB B Factory Design Report, KEK Report 95-7 (1995), unpublished; Y. Funakoshi et al., Proc. 2000 European Particle Accelerator Conference, Vienna (2000).
- [4] H. Hirano et al., KEK Preprint 2000-2, submitted to Nucl. Inst. Meth.; M. Akatsu et al., DPNU-00-06, submitted to Nucl. Inst. Meth.
- [5] H. Kichimi et al., Nucl. Inst. Meth. A 453, 315 (2000).
- [6] T. Iijima et al., Proceedings of the 7th International Conference on Instrumentation for Colliding Beam Physics, Hamamatsu, Japan, Nov 15-19, 1999.
- [7] H. Ikeda et al., Nucl. Inst. Meth. A 441, 401 (2000).
- [8] H. Albrecht et al. (ARGUS Collaboration), Phys. Lett. B 229, 304 (1989).
- [9] D.M. Asner et al. (CLEO Collaboration), Phys. Rev. D 53, 1039 (1996).
-
[10]
R.A. Fisher, Ann. Eugenics 7, 179 (1936);
M.G. Kendall and A. Stuart, The Advanced Theory of Statistics, 2nd ed. (Hafner Publishing, New York, 1968), Vol. III. - [11] K. Abe et al. (Belle Collaboration), BELLE-CONF-0138; Submitted as a contribution paper to LP2001.
- [12] K. Abe et al. (Belle Collaboration), BELLE-CONF-0108; Submitted as a contribution paper to LP2001.
- [13] D.E. Groom et al. (Particle Data Group), Eur. Phys. J. C 15, 1 (2000).
- [14] K. Abe et al. (Belle Collaboration), BELLE-CONF-0115; Submitted as a contribution paper to LP2001.
- [15] K. Abe et al. (Belle Collaboration), BELLE-CONF-0113; Submitted as a contribution paper to EPS(2001) and LP2001.
- [16] T. Bergfeld et al. (CLEO Collaboration), Phys. Rev. Lett. 77, 4503 (1996).
- [17] T.J. Champion (BaBar Collaboration), Proc. of the XXXth Int. Conf. on High Energy Phys., Osaka (2000).
- [18] G. Abbiendi et al. (OPAL Collaboration), Phys. Lett. B 476, 233 (2000).
- [19] V.L. Chernyak, hep-ph/0102217, 2001.
- [20] M. Diehl and G. Hiller, hep-ph/0105194.
- [21] V.V. Anisovich et al., hep-ph/0102338, 2001.
- [22] C.S. Kim et al., hep-ph/0101292, 2001.