Near Muon Range Detector for the K2K Experiment
- Construction and Performance -
Abstract
A muon range detector (MRD) has been constructed as a near detector for the KEK-to-Kamioka long-baseline neutrino experiment (K2K). It monitors the neutrino beam properties at the near site by measuring the energy, angle and production point of muons produced by charged-current neutrino interaction. The detector has been working stably since the start of the K2K experiment.
keywords:
muon , range , K2K , drift tube , neutrino , long baselinePACS:
14.60.Pq , 14.60.Lm , 96.40.Tv, , , , , , , , , , , , , , , , , , , , , , , , , , , , , , , , , , , , ,
1 Introduction
The KEK-to-Kamioka long-baseline neutrino experiment (K2K)[1] was planned to definitely measure the neutrino oscillation, which was originally suggested by the Kamiokande experiment[2]. An almost pure beam is generated by the decay of secondary pions from the KEK 12-GeV proton synchrotron. The K2K experiment uses a near detector newly built at the KEK site 300 m from the pion production target in order to know the beam properties just after its production, in addition to the Super–Kamiokande detector[3], the far detector 250 km away. A muon range detector (MRD) has been constructed as a near detector to measure the energy and angle of muons which are produced by charged-current interaction. This determines the spectrum of the incident neutrino beam. The detector also measures the flux and profile of the neutrino beam.
2 Design of the muon range detector
The requirements for the near detector are:
-
1.
that it be massive enough to measure the beam flux,
-
2.
that it have large enough transverse dimension to measure the beam profile,
-
3.
and that it be capable of measuring the energy of muons in the range of the expected neutrino spectrum, i.e. up to about 3 GeV, with reasonable resolutions.
To fulfill these requirements, we adopted the range method. The MRD consists of 12 layers of iron absorber sandwiched between vertical and horizontal drift-tube layers. The size of a layer is approximately 7.6 m 7.6 m. In order to have a good energy resolution for the whole energy region, the upstream four iron plates are 10 cm thick and the downstream eight are 20 cm thick. The total iron thickness of 2.00 m covers up to 2.8-GeV muons.
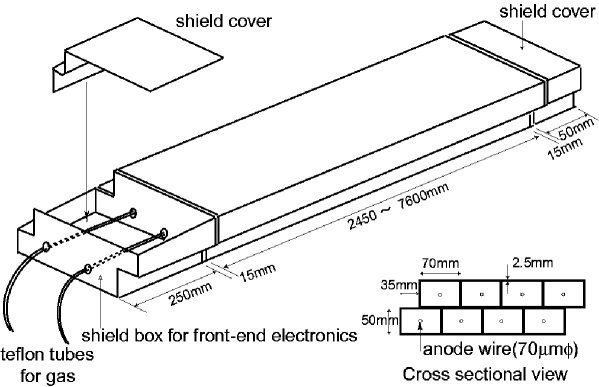
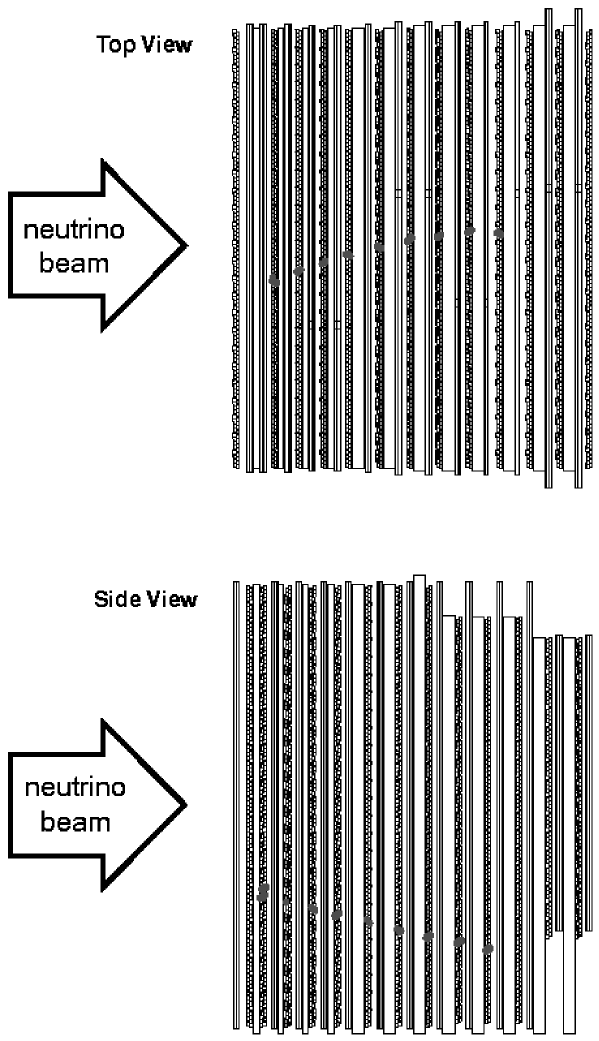
The same drift tubes were previously used by the VENUS experiment[4] at TRISTAN. Each drift-tube module consists of 8 drift tubes, which are arranged as shown in Fig. 1. The modules vary in length from 2.45 m to 7.6 m. Ideally, we make a drift-tube layer by arranging 25 modules of 7.6 m length with a 2-cm gap between consecutive modules. However, for some horizontal drift-tube layers shorter modules are combined end-to-end to make the full 7.6 m 7.6 m dimension, since there are not enough 7.6 m modules. We used 829 modules in total: 377 modules of 7.6 m length, and 452 shorter ones. The available pool from VENUS was 390 and 510 modules, respectively. The setup of the MRD is shown in Fig. 2.
The seventh through twelfth iron plates are also from the VENUS experiment; the upstream six are new. The total weight of iron is 864 tons. Including the aluminum drift tubes, the total mass is 915 tons.
3 Tests of the drift tubes
3.1 Gas tightness
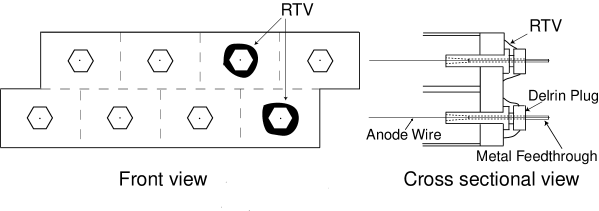
The gas tightness of the drift tubes was tested by pressurizing them to approximately and measuring the decrease in the pressure as a function of time. Nitrogen gas was used for this test. About 3% of the modules showed an excessive leak rate corresponding to more than 1 cc/min under the nominal running conditions. Most of the leaks were found at the connection part of the Delrin plug to the aluminum end-plate (Fig. 3). Two materials had been used for gas seals by the VENUS group: RTV and epoxy glue. The epoxy glue tends to form cracks after a long period. Leaking modules were repaired using RTV. After repair, they showed an average leak rate of less than 0.1 cc/min.
3.2 Wire tension
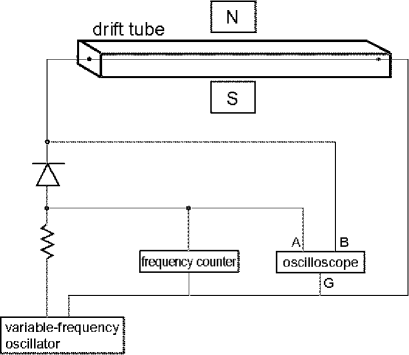
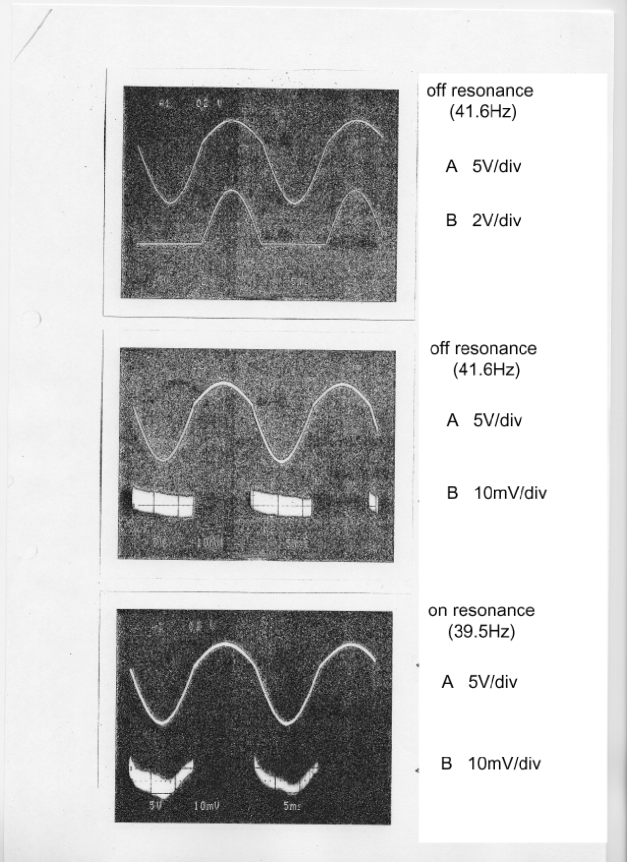
The wire tension was measured by searching for the resonant frequency while supplying a pulsed current in a magnetic field (Fig. 4). The resonant frequency ( (Hz)) is related to the wire tension ( (N)) by the following formula:
| (1) |
where is an odd integer, is the wire length in m, is the wire line density (kg/m), and . For this case, the line density of a 70 m diameter tungsten wire is kg/m. The pulsed current was made from a sine wave generated by a variable-frequency oscillator, which was trimmed by a diode to see a small signal. As shown in Fig. 5, at the resonant frequency, the wire started to oscillate in the magnetic field inducing a current, which was observed as an order of 10 mV signal at the point B of Fig. 4.
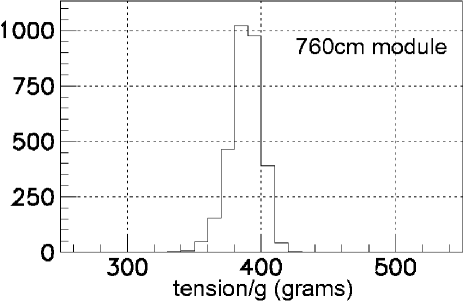
The measurement was made by a computer-controlled CAMAC system for each of the modules. At the same time, the wire resistance was measured as well, which is another important check of the continuity of the wires. We found 10 broken wires in total out of 7200 wires. Most of the broken wires had been cut inside the epoxy glue which had been used for only some of the modules to fix the wire to the pin. The measured tension distribution for the 760-cm-long modules is shown in Fig 6. The modules with other lengths have similar distributions. They are distributed around 390 g with an RMS of about 10 g, which is consistent with the VENUS measurement[5]. The broken wires were repaired by stretching a new wire, fixed to the pin only by soldering.
4 Readout electronics
4.1 Modification of the electronics
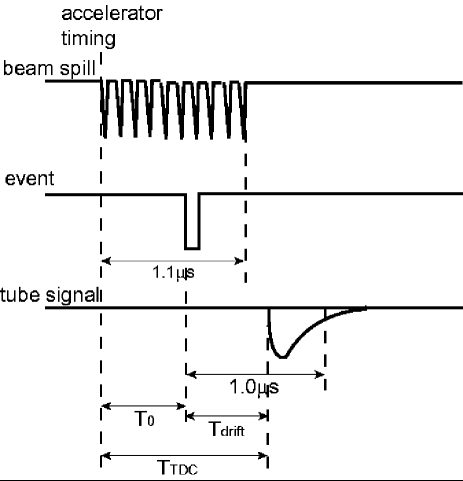
The VENUS electronics for the muon drift tubes[6] consists of single-hit TDCs operated in the common start mode. The start signal was made from the accelerator timing of every 5 sec in the TRISTAN experiment. The use of a 40MHz 6-bit TDC in the front-end electronics boards gives a range for the TDC of 1.6 sec. However, in the K2K experiment, the experimental condition is very much different from that in the TRISTAN experiment. A beam spill every 2.2 sec lasts for about 1.1 sec. If we use the accelerator timing as the start signal, the TDC range would not cover the sum of the beam spill time and the maximum drift time, which is about 2.1 sec (Fig. 7). Further, the signal from trigger counters is too late to make the start signal.
There were two choices. One was to modify the electronics to operate in a common stop mode, so that the trigger counter signal could be used for the stop signal. The other was to change the TDC range to be longer than the beam spill time plus the maximum drift time, so that we could calculate the drift time by subtracting the trigger timing delay later. We chose to make the TDC range longer by replacing the 40MHz clock chips with 20MHz ones. This resulted in a TDC range of 3.2 sec. This was a simpler modification of the electronics which adversely affects only the timing resolution slightly, which is not critical for the range measurement.
4.2 Test of the front-end electronics
We tested the front-end electronics boards both before and after modification. Test pulses were injected to the input of the preamplifier on the board. The test items were linearity of the stop timing and linearity of the start timing, as well as the efficiency versus the test-pulse amplitude. We found about 3% of the boards to be bad at each stage; most of them were repaired.
5 Cosmic-ray test of the system
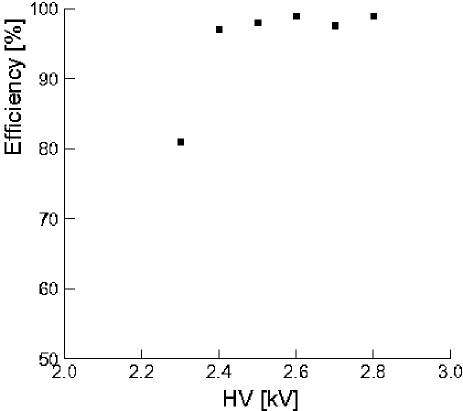
A cosmic-ray run was performed to test the complete drift-tube system. P10 gas () was flowed as in the real experiment. The results of the cosmic-ray test show that we have an efficiency plateau above 2.5 kV of high voltage (Fig. 8), and a spatial resolution of about 2 mm. We chose the nominal operating high voltage to be 2.7 kV.
The time-to-distance relation was also investigated. This study confirmed the VENUS parameterization of the relation:
| (2) |
where is the drift length in cm and is the drift time in sec.
6 Gas system
In the K2K running, P10 gas is supplied to the drift tubes using the gas recirculation system of the VENUS experiment. As is shown in Fig. 9, it is composed of a gas-supply unit, a compressor, a purifier and a gas holder. The compressor and the purifier each has a duplicate for backup. P10 gas is pressurized by the compressor and then sent to the purifier. The purifier includes a reaction column and an adsorption column. In the reaction column, oxygen contamination is trapped by flowing the gas through porous nickel metal. In the adsorption column, water contamination is removed using molecular sieves. The purified gas is flowed to the drift tubes at a rate of /min. At this flow rate, the total volume of the drift tubes of 130 is replaced every 2 days. Returned gas from the drift tubes is stored in a gas holder, which keeps the gas pressure 0.01 higher than atmospheric pressure. The gas in the gas holder is sent to the compressor and recirculated.
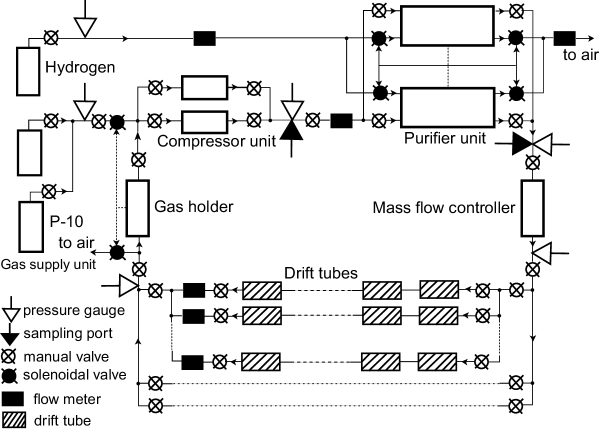
Two sampling ports are located at the input and the output of the purifier. Sampled gas is measured by gas chromatography on a weekly basis to check the purity. Normally, the oxygen contamination of the return gas is less than 100ppm, and that of the purified gas is less than 5ppm. When the contamination level becomes higher, we regenerate the purifier. To this extent, P10 gas mixed with hydrogen is flowed through the reaction column heated to C in order to deoxidize the nickel catalyst. The molecular sieves are also heated to C for regeneration.
7 Iron absorber
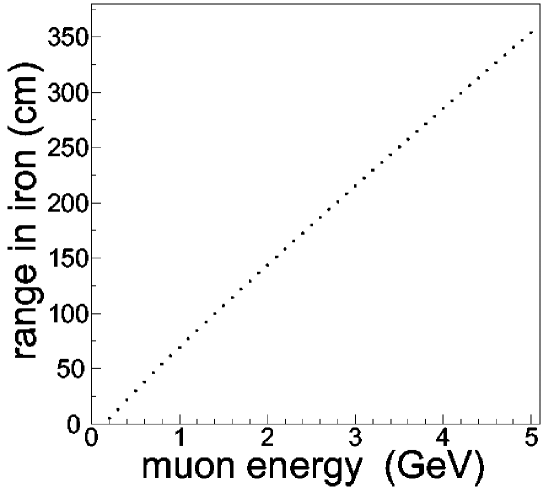
Iron plates are used not only as an absorber for range measurements, but also as a target for the neutrino beam. Accurate knowledge of the thickness of the plates is necessary for these measurements. It is guaranteed by the Japanese Industrial Standard (JIS) that the thickness of the upstream 4 plates is mm and that of downstream 8 plates is mm. The relationship between the muon energy and the muon range in iron was calculated using a GEANT based Monte Carlo code[7]. The result is shown in Fig. 10.
8 Acceptance and expected resolutions
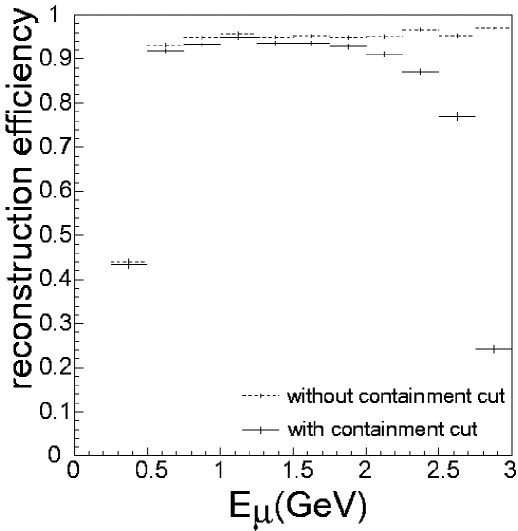
The acceptance and resolutions of the MRD were studied by a Monte-Carlo method. In the simulation, muons with various energy were injected in the forward direction from randomly chosen vertices in a radius of 1m of the 1st iron plate. They were simulated in the detector considering both ionization and multiple scattering. The hit positions were converted into drift times. The muon track was reconstructed using the tracking algorithm explained in the next section.
The reconstruction efficiency is plotted as a function of the muon energy in Fig. 11. In some analyses, we require a track to be contained in the detector to make an energy measurement possible. Tracks which exit the detector are not contained. The efficiency was derived both with and without the containment cut.
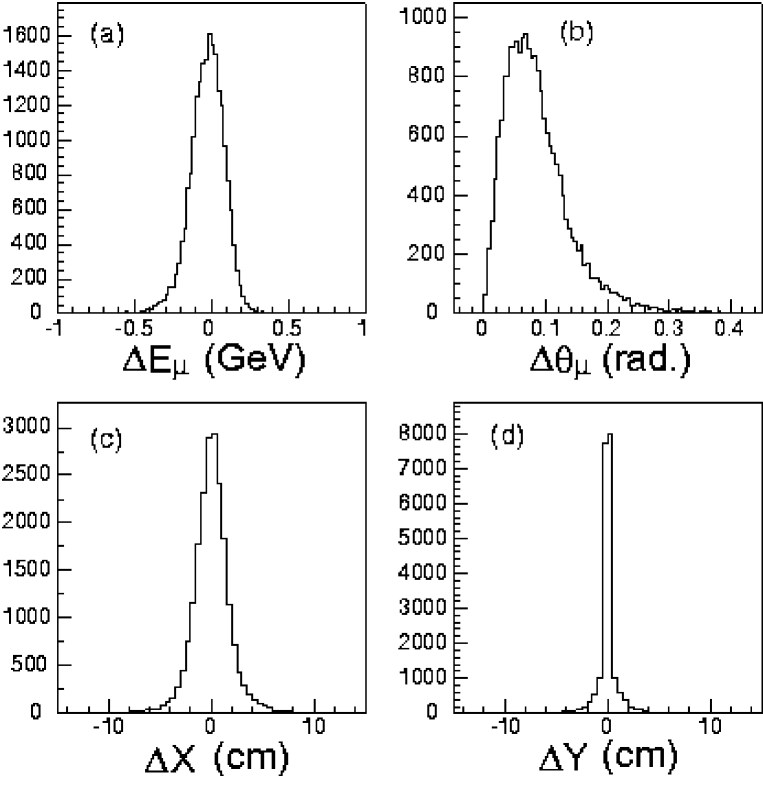
The differences in the reconstructed and generated muon energies are plotted in Fig. 12-a, which is taken as an energy resolution. The same is plotted for the muon angle, as well as the horizontal and vertical start positions in Figs. 12-b, c and d, respectively.
9 Tracking algorithm
As stated above, one drift-tube module consists of two half-cell staggered planes. The tracker treats each layer as two independent drift-tube planes. The tracking proceeds in the following 4 steps. In steps 1, 2 and 3 the x-z view and the y-z view are treated independently, where the z-axis is defined by the beam direction and the y-axis is defined by the upward direction.
-
1.
Cell fitting: in this step, the drift time is ignored and the wire positions are used as hit positions. A straight line is drawn between every combination of two hits on different planes which are apart by more than three planes. The number of hits near the line (typically closer than 7 cm) is counted. If the number of hits is large enough (typically larger than 60% of the number of planes traversed by the track), it is regarded as a cell-track.
-
2.
Fragment fitting: based on a cell-track, up to six successive planes are examined. If there exist 3 hits, it is regarded as a fragment, and a linear fit is done taking into account of the drift times and left/right ambiguity. In this fitting , the interaction time, is also varied as one of the parameters. Every other plane in a cell-track is taken as the start point of a fragment.
-
3.
2D fitting: the most upstream fragment is taken as the start of a 2D-track. A fragment which can be smoothly connected to the previous fragment is searched for. Typical connection criteria are that the distance between the two lines is shorter than 10 cm and difference of the two slopes is less than 0.15. This process is iterated until no connecting fragment can be found. This group of connected fragments is called a 2D-track. Used fragments are removed from the list, and the process is repeated for the remaining fragments.
-
4.
3D fitting: the overlap in the z-direction is examined between the xz 2D-tracks and the yz 2D-tracks. The pair of (xz,yz) 2D-tracks which has the longest overlap is taken as a 3D-track. The used 2D-tracks are removed from the list and the process is repeated for all the remaining 2D-tracks.
As a result, the shortest track reconstructed consists of one fragment which has three successive hits in both the xz and yz views. This track traverses at least one iron plate corresponding to an energy threshold of 150 MeV (300 MeV) for a 10-cm (20-cm) thick iron plate.
10 Performance of the muon range detector
The MRD measures muons produced by the charged-current neutrino interaction in the iron plates. A typical neutrino-iron interaction event is shown in Fig. 2.
10.1 Tracking efficiency and the hit efficiency
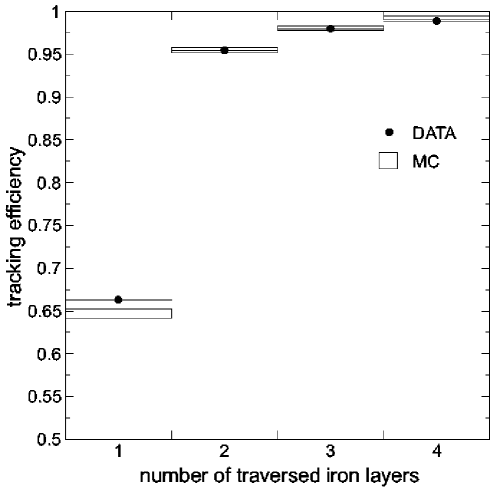
The tracking efficiency as a function of the track length (number of traversed layers) is derived as follows using beam data:
-
1.
Tracks longer than the test region by at least one iron layer both upstream and downstream are selected as sample tracks in order to assure the existence of a track in the test region.
-
2.
All hits except for those in the test region are masked.
-
3.
The masked data are fitted by the tracker to see whether the tracker finds the track or not.
The tracking efficiency is dependent on the hit efficiency of the drift tubes. We determined the effective hit efficiency so that the Monte-Carlo result on the tracking efficiency would reproduce the beam data well. The obtained effective hit efficiency is 97.5%. The inefficiency of 2.5% includes the geometrical effect coming from a possible mis-alignment of the drift tube modules, as well as the real hit inefficiency. The result of the tracking efficiency is shown in Fig. 13 with the Monte-Carlo result overlaid.
10.2 Noise rate
The noise rate was estimated from off-spill data, which are taken in the time between successive beam spills. These are one class of randomly triggered data. The average noise hits in the off-spill data amounts to approximately 27 out of 6632 total tubes, implying a 0.4% average noise rate. This rate is composed of all the non-beam-related background hits, including cosmic-rays. The main part of this comes from electronic noise, most of which is easily cut using timing information. As a result, noise hits do not change the analyzed results.
10.3 Detector stability
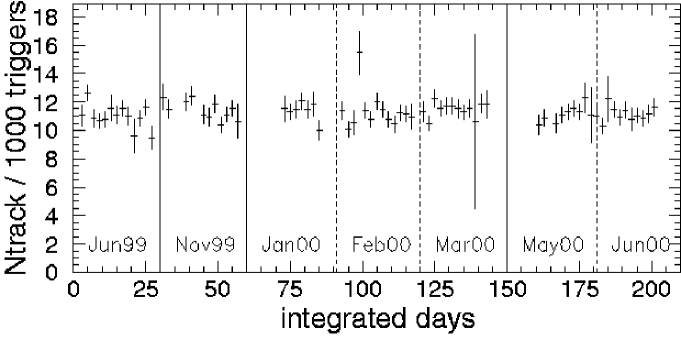
As of June 2000, the MRD has been alive 91.7% of the time since the start of the K2K data taking in June 1999. The off-spill data were analyzed to study the detector stability. Only cosmic-ray muons contribute to the off-spill data as tracks. The average number of reconstructed 3D-tracks is plotted as a function of time in Fig. 14. The average number of tracks is about 11/1000 triggers and has been stable within the statistical error.
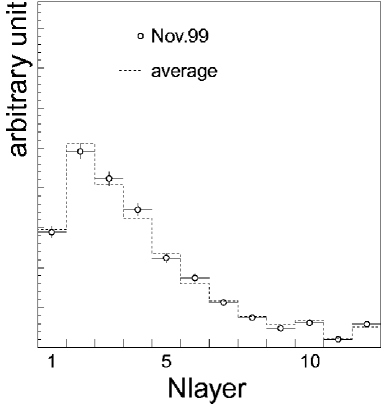
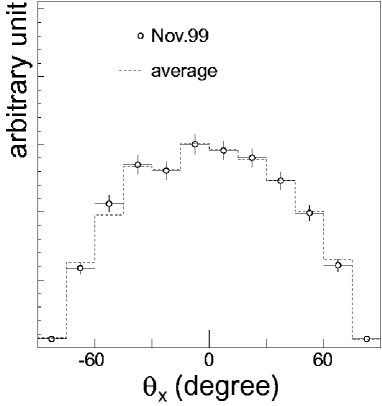
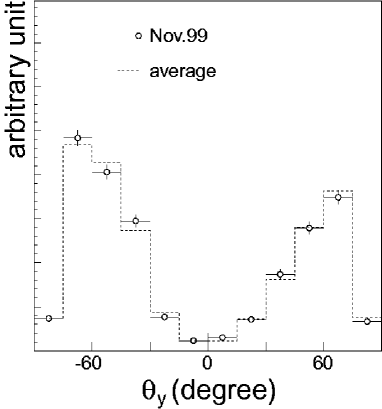
The number of traversed layers by a track is correlated with the energy loss of the particle in the MRD. This distribution is analyzed on a monthly basis. The distribution in November 1999 is compared with the averaged distribution over all experimental periods in Fig. 15. Distributions in other months are the same within statistical errors. Angular distributions, also made on a monthly basis, in the x-z and y-z views are shown for the November 1999 and total data sets in Figs. 16 and 17, respectively. Distributions in other months are same within statistical errors for both angular distributions. The reproducibility of these distributions shows that the detector has been working stably in all experimental periods.
11 Summary and conclusion
The MRD was constructed as a near detector of the K2K long-baseline neutrino experiment. It measures the position, momentum, and direction of muons produced in charged-current neutrino interactions. The coverage of the detector is mrad with respect to the production target, and the fiducial mass is 329 tons. The energy acceptance is from 0.3 GeV to 2.8 GeV with a resolution of 0.12 GeV for forward-going muons. The track angular resolution is about 0.09 rad and the vertex resolution perpendicular to the beam direction about 2 cm.
The MRD has been working stably since the start of the K2K experiment.
References
- [1] K2K Collaboration, to be published in Phys. Lett. B (2001); K. Nishikawa et al., KEK-PS proposal (E362) (1995).
- [2] K. S. Hirata et al., Phys. Lett. B 205 (1988) 416.
- [3] Y. Fukuda et al., Phys. Rev. Lett. 81 (1998) 1562.
- [4] Y. Asano et al., Nucl. Instr. and Meth. A 259 (1987) 430.
- [5] Y. Asano et al., Nucl. Instr. and Meth. A 254 (1987) 35.
- [6] Y. Ikegami et al., IEEE Trans. on N. S. 36 (1989) 665.
- [7] R. Brun et al., CERN DD/EE/84-1 (1987).