EUROPEAN ORGANIZATION FOR NUCLEAR RESEARCH
LHWG Note 2001-08
ALEPH 2001-059 CONF 2001-039
DELPHI 2001-116 CONF 539
L3 Note 2701
OPAL Technical Note TN695
July 2, 2001
Searches for Higgs Bosons Decaying into Photons: Preliminary Combined Results Using LEP Data Collected at Energies up to 209 GeV
The ALEPH, DELPHI, L3 and OPAL Collaborations
The LEP Higgs Working Group
Abstract
This note describes preliminary LEP-combined results of searches for Higgs bosons decaying into photons. The analyses use data collected at 88209 GeV. Using the combined data for , a lower bound of 108.2 GeV is set at the 95% confidence level for the “benchmark” fermiophobic Higgs boson
THE RESULTS QUOTED IN THIS NOTE ARE PRELIMINARY
1 Introduction
In the Standard Model (SM), the branching fraction for is too small to permit its observation at LEP energies. However, in particular formulations of 2-Higgs Doublet Models (2HDM) and other models, the Higgs coupling to fermions can be small and the Higgs bosons therefore decay preferentially to pairs of bosons. These are the so-called “fermiophobic” Higgs bosons (see, e.g., references [1, 2]).
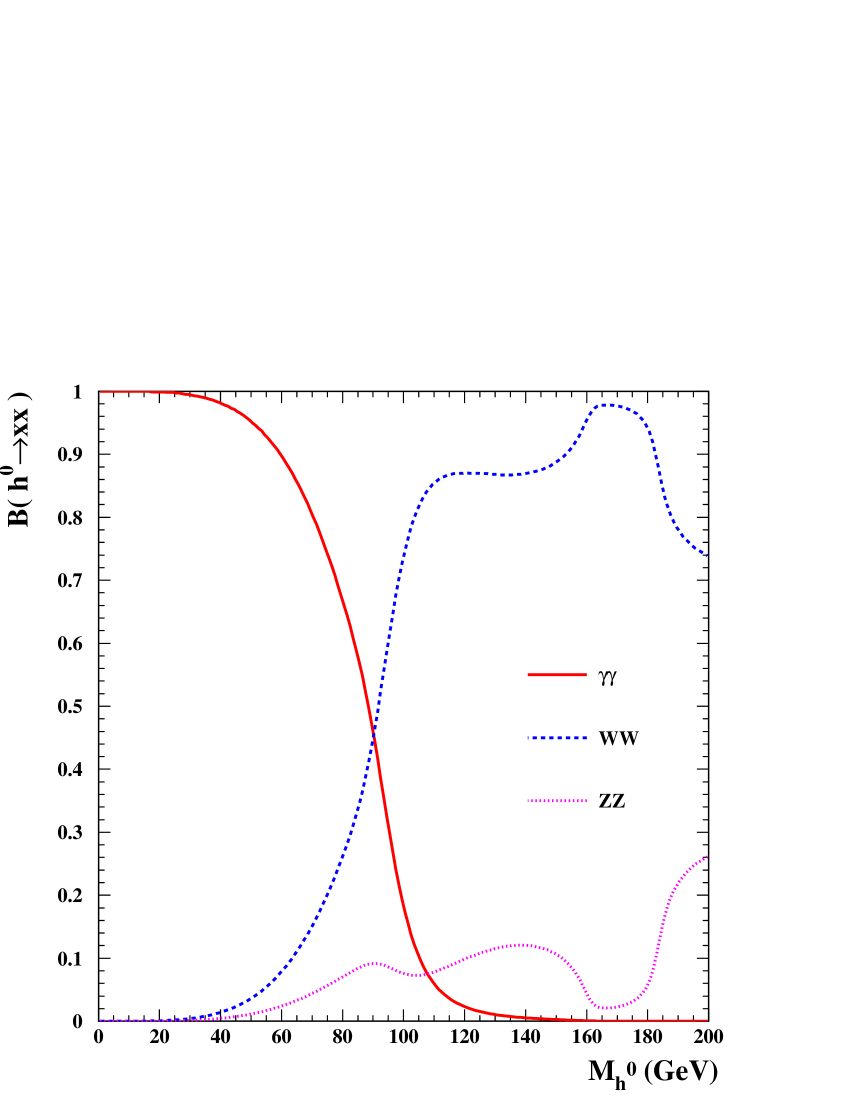
The fermiophobic models are indeed parameter dependent, but a large class of the models has near-Standard Model production strength. Therefore, we establish a “benchmark” fermiophobic model defined to be the Standard Model production rates and channels, but with the fermionic channels closed. To model Higgs boson production the four LEP experiments are using the code HZHA [3] and/or HDECAY [4]. The code HDECAY gives a slightly lower di-photon branching fraction than HZHA (the difference in mass limits near 100 GeV is about 0.6 GeV). In the interest of conservatism, we use the HDECAY branching fractions in this LEP-wide combination. The bosonic branching fractions obtained from HDECAY in the benchmark model are shown in Figure 1.
To obtain the limits, the LEP Higgs Working Group uses the frequentist confidence levels generated by the “ecl” package [5]; three of the LEP collaborations use different statistical methods, which have been shown to agree with the LHWG method to within 0.5 GeV on all mass limits. This technique includes the estimated systematic errors and the expected signal shape in setting test-mass dependent limits on Higgs boson decays to photon pairs.
2 Searches for with
The ALEPH [7], DELPHI [8], L3 [9], and OPAL [10] analyses are described in journal articles or CERN preprints. All of the LEP experiments search for hadronic, leptonic, and missing energy (neutrino) decay modes of the associated Z boson in the production channel . The ALEPH experiment does not discriminate between Z decay modes; rather, it performs a “global” analysis which focusses on identifying the di-photon state. DELPHI, L3, and OPAL seek to identify the hadronic (), leptonic (), and missing energy () classes.
The LEP data from energies just below the Z resonance to the highest LEP-2 energy of 209 GeV can be used for this search. The energies and Z decay modes used by the 4 LEP experiments are summarized in Table 1.
| ALEPH | DELPHI | L3 | OPAL | SUM | |
|---|---|---|---|---|---|
| Modes | global | ,, | ,, | ,, | |
| (GeV) | 192-209 | 189-209 | 189-209 | 88-209 | 88-209 |
| Candidates | 10 | 47 | 64 | 184 | 305 |
| Background | 10.8 | 42.2 | 69.5 | 185.7 | 308.2 |
| Benchmark limit (GeV) | 104.4 | 103.6 | 104.1 | 104.8 | 108.2 |
| Expected limit (GeV) | 104.6 | 105.1 | 104.9 | 105.2 | 109.0 |
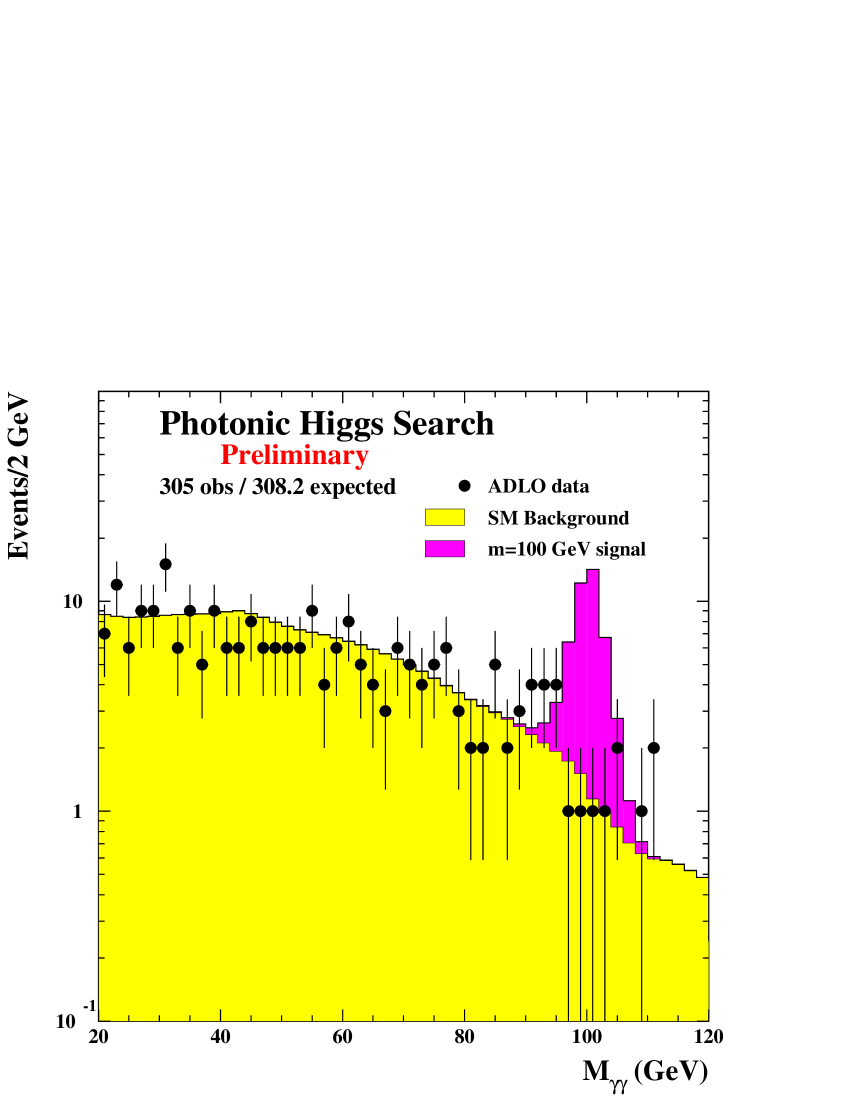
The candidates passing the selection cuts for all three decay topologies are shown in Table 1; their rate is consistent with the background calculated from SM physics generators. The selected events are used to set an upper limit on the di-photon branching ratio of a Higgs particle having SM production rate. Figure 2 showns the di-photon mass for all candidate events. The distribution appears to be well modelled by the SM background processes.
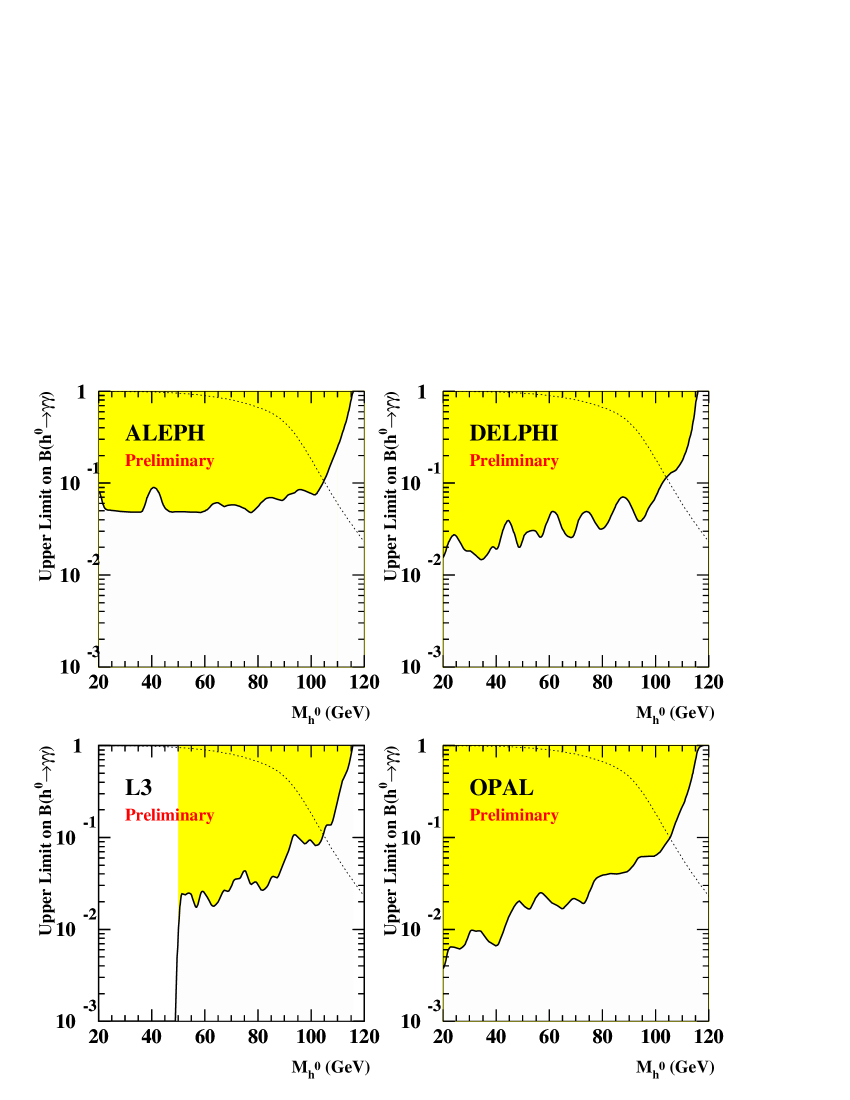
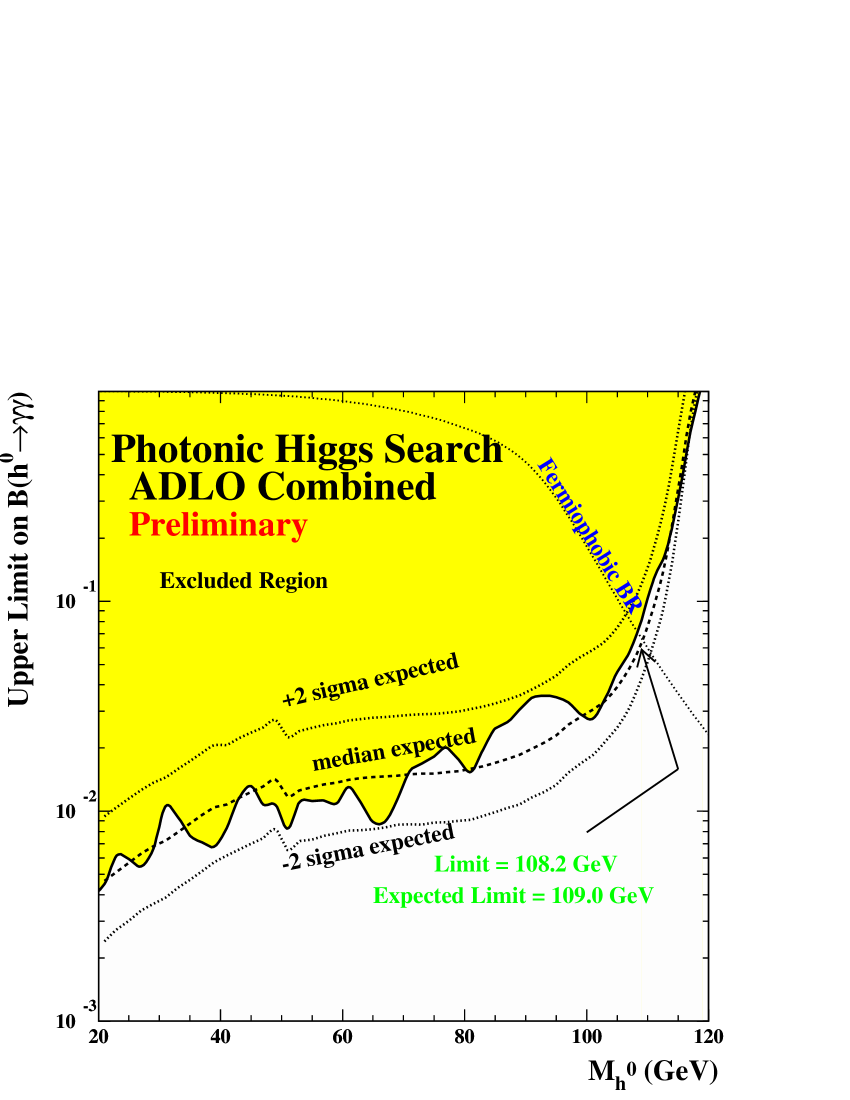
Figures 3 and 4 show the 95% CL upper limit for the di-photon branching ratio obtained by combining the candidate events, where the SM production cross-section is assumed at each centre-of-mass energy. Also shown in the Figures (and in Figure 1) is the branching ratio in the Standard Model computed using HDECAY [4] with the fermionic couplings switched off. Note that the limits only include the ALEPH data for 192 GeV, and the L3 inputs to the LHWG only cover the mass range 50-120 GeV. A 95% CL lower mass limit for such benchmark fermiophobic Higgs bosons is set at 108.2 GeV, where the predicted branching ratio crosses the upper-limit curve. The median limit one would expect to obtain in an ensemble of experiments in the absence of a signal is 109.0 GeV; if HZHA is used instead of HDECAY to calculate the Higgs boson branching fractions, the lower mass limits are raised by 0.6 GeV.
References
- [1] A. G. Akeroyd, Phys. Lett. B368 (1996) 89.
- [2] L. Brucher, R. Santos, Eur. Phys. J. C12 (2000) 87.
-
[3]
HZHA generator: P. Janot, in Physics at LEP2,
edited by G. Altarelli, T. Sjöstrand and
F. Zwirner, CERN 96-01 Vol. 2 p.309.
For HZHA3 and HZHA2, see http://alephwww.cern.ch/janot/Generators.html. - [4] A. Djouadi, J. Kalinowski and M. Spira, Comp. Phys. Comm. 108 (1998) 56.
- [5] T. Junk, Nucl. Instr. Meth.A434 (1999) 435.
- [6] L3 collaboration, L3 Notes 2649 (5 March 2001) and 2685 (27 June 2001).
- [7] ALEPH collaboration, Phys. Lett. B487 (2000) 241.
- [8] DELPHI collaboration, Phys. Lett. B507 (2001) 89; updated: DELPHI 2001-073 CONF 501 (June 2001).
- [9] L3 collaboration, Phys. Lett. B489 (2000) 115; L3 Note 2652 (8 March 2001).
- [10] OPAL collaboration, Phys. Lett. B464 (1999) 311; OPAL Physics Note PN 468 (2 November 2000).