EUROPEAN ORGANIZATION FOR NUCLEAR RESEARCH
ALEPH 2001-066 CONF 2001-046
DELPHI 2001-113 CONF 536
L3 Note 2699
OPAL Physics Note PN479
LHWG Note/2001-03
CERN-EP/2001-xxx
Search for the Standard Model Higgs Boson at LEP
ALEPH, DELPHI, L3 and OPAL Collaborations
The LEP working group for Higgs boson searches
Abstract
The four LEP collaborations, ALEPH, DELPHI, L3 and OPAL, have collected
2465 pb-1 of collision data at energies between 189 and 209 GeV, of which 542 were collected above 206 GeV.
Searches for the Standard Model Higgs boson have been performed by each of the LEP collaborations.
Their data have been combined and examined for their consistency with the Standard Model background and various
Standard Model Higgs boson mass hypotheses.
A lower bound of 114.1 GeV has been obtained at the 95% confidence level for the mass of the Higgs boson.
The likelihood analysis shows a preference for a Higgs boson with a mass of 115.6 GeV.
At this mass, the probability for the background
to generate the observed effect is 3.4%.
THE RESULTS QUOTED IN THIS PAPER ARE NOT FINAL
Contributed paper for EPS’01 in Budapest and LP’01 in Rome
1 Introduction
The Higgs mechanism [1] plays a central role in the unification of the electromagnetic and weak interactions by providing mass to the intermediate vector bosons, and , without violating local gauge invariance. Within the Standard Model (SM) [2], the Higgs mechanism predicts a single neutral scalar particle, the Higgs boson. Its mass is arbitrary; however, self-consistency of the model up to a scale imposes an upper [3] and lower bound [4]. If is close to the Planck scale, the mass of the SM Higgs boson is confined between about 130 and 190 GeV [5]. A mass less than 130 GeV would indicate physics beyond the SM to set in below the Planck scale; for example, in the minimal supersymmetric extension of the SM the mass of the lightest neutral scalar is predicted to be less than 135 GeV [6]. Even stronger bounds are obtained using arguments of naturalness and fine-tuning [7].
Indirect experimental constraints are derived from precision measurements of electroweak parameters which depend in their interpretation on the of the Higgs boson mass via radiative corrections. If the SM is assumed, the currently preferred mass value is GeV, and the 95% confidence level upper bound on the mass is 196 GeV [8].
Direct searches carried out by the four LEP collaborations in data collected prior to the year 2000 did not reveal any signal for the SM Higgs boson. When the LEP data were statistically added, the observed event rate and their distributions have shown good agreement with the SM background processes [9, 10, 11].
The situation changed during summer 2000 with the advent of new LEP data, at centre-of-mass energies exceeding 206 GeV. At the session of the LEP Committee of September 5, 2000, ALEPH reported an excess of events suggesting the production of a SM Higgs boson with mass in the vicinity of 115 GeV [12] while DELPHI, L3 and OPAL did not support this observation. The quoted probabilities for the SM background to produce the observed event configuration (, as defined below in Section 2.5), are listed in the first line of Table 1 where the LEP combined result is also quoted. Due to this ambiguous situation, the LEP shutdown planned for the end of September was postponed by one month, and all effort was made to maximize the LEP energy.
| ALEPH | DELPHI | L3 | OPAL | LEP | |
|---|---|---|---|---|---|
| LEPC, Sept 5 | 0.67 | 0.84 | 0.47 | ||
| LEPC, Nov 3 [13] | 0.68 | 0.068 | 0.19 | ||
| Ref’s [15, 16, 17, 18] | 0.77 | 0.32 | 0.20 |
A rapid analysis which included the bulk part of the new data resulted in the probabilities listed in the second line of Table 1. These results were presented at the LEP Committee meeting of November 3, 2000 [13]. The ALEPH excess was slightly attenuated, as indicated by the increased background probability. On the other hand, L3 reported some candidates suggesting the Higgs boson interpretation [14].
After a thorough review of the analysis procedures, the LEP collaborations have published their results [15, 16, 17, 18], updating them to include all data. The L3 publication [17] is final. The review addressed many potential systematic errors, especially in the handling of a signal at the kinematic limit of the production process ZH. Also, the uncertainties from Monte Carlo statistics were reduced and in some cases the search sensitivity has been improved. The published background probabilities at a test-mass of 115 GeV are reported in the last line of Table 1. The ALEPH [15] and L3 [17] excesses have decreased since the beginning of November.
In this paper we present combined results from LEP which are based on these recent publications. However, the inputs also include data collected before the year 2000. The c.m. energies () thus span the range from 189 GeV to 209 GeV. The integrated luminosities by experiment and energy are given in Table 2.
| ALEPH | DELPHI | L3 | OPAL | LEP | |
|---|---|---|---|---|---|
| GeV | 629 | 610 | 627 | 599 | 2465 |
| GeV | 130 | 142 | 139 | 130 | 542 |
At LEP energies, the SM Higgs boson is expected to be produced mainly in association with a boson through the Higgsstrahlung process, [19]. Small additional contributions are expected from t-channel and boson fusion processes, which produce a Higgs boson and either a pair of neutrinos or electrons in the final state [20]. For masses in the vicinity of 115 GeV (the kinematic limit for Higgsstrahlung at GeV), the SM Higgs boson is expected to decay mainly into quark pairs (74%) while decays to tau lepton pairs, WW∗, gluon pairs ( 7% each), and to ( 4%) are all less important. The final-state topologies are determined by these decays and by the decay of the associated boson. The searches at LEP encompass the four-jet final state (), the missing energy final state (), the leptonic final state () where denotes an electron or a muon, and the tau lepton final states () and ()().
Preselection cuts are applied to reduce the main background from two-photon processes and from radiative returns to the boson, . The remaining background, mainly from fermion pairs (possibly with photon or gluon radiation), , and ZZ, is reduced by applying cuts which make use of kinematic differences between the signal and the background processes and of the requirement of b-flavour, abundant in the decay of the Higgs boson. The detailed implementation of these selections and analysis procedures is different for each experiment [15]-[18]. In some search channels 111In the following, the word channel designates any subset of the data where the Higgs boson search is carried out; these may correspond to different final state topologies, to subsets of data collected at different c.m. energies or to subsets provided by different experiments., the selection depends explicitly upon the hypothesized Higgs boson mass.
2 Combination procedure and results
2.1 Input provided by the experiments
The information provided by the LEP experiments as input to the combination is in most cases binned in two discriminating variables: (i) the reconstructed Higgs boson mass , and (ii) a variable which combines many features of the events and allows the analysis to distinguish on a statistical basis between events from the Higgs boson signal and events from background processes. This variable is typically the outcome of a likelihood analysis or the output of an artificial neural network. Variables which tag b-flavoured jets contribute in an essential way to the value of .
In a given bin of the plane defined by and , the experiments provide the number of selected data events, the expected background rate , and the expected signal for a set of hypothesized Higgs boson masses (test-mass hereafter). In those channels where the selection depends on , the values of and are also given for a set of values. For a given test-mass, a weight of can thus be assigned to each selected candidate, depending on and the bin where it is reconstructed. The estimation of and makes use of detailed Monte Carlo simulations which take into account all known experimental features such as the c.m. energy and integrated luminosity of the data samples, cross-sections and decay branching ratios for the signal and background processes, selection efficiencies, experimental resolutions with non-gaussian contributions and systematic errors with their correlations. Since the simulation is done at fixed sets of and , interpolation procedures such as [21] are applied to obtain the distributions which correspond to arbitrary energies and test-masses. In order to avoid problems which might arise in some bins due to low Monte Carlo statistics, smoothing procedures such as [22] are applied which use the corresponding information in the neighbouring bins.
2.2 Hypothesis testing
The observed data configuration in the [] plane is subjected to a likelihood test of two hypothetical scenarios. In the background scenario it is assumed that the data receive contributions from the SM background processes only while in the signal+background scenario the contribution from a Higgs boson of test-mass is assumed in addition. The expressions for the corresponding likelihoods, and , are given e.g. in Appendix A of Ref. [9]. The ratio
| (1) |
serves as test-statistic allowing to rank any data configuration between the background and signal+background hypotheses. For convenience, the quantity
| (2) |
is used since in the limit of high statistics it corresponds to the difference in between the two hypotheses. In the above expression, is the total expected signal rate. This test-statistic has been adopted since it makes the most efficient use of the information available in the observed event configuration of a search, similarly to the way the principle of maximum likelihood gives the most efficient estimators of parameters in a measurement.
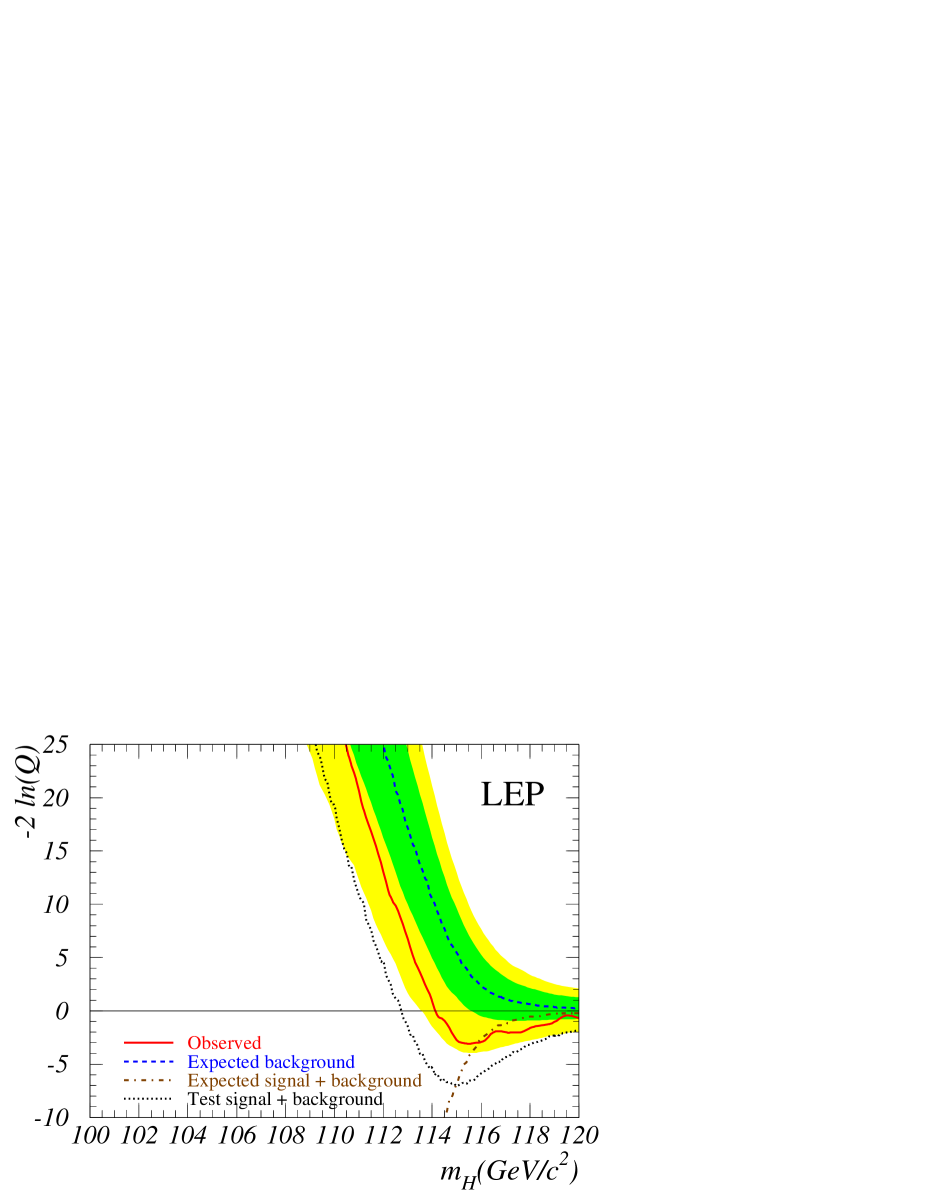
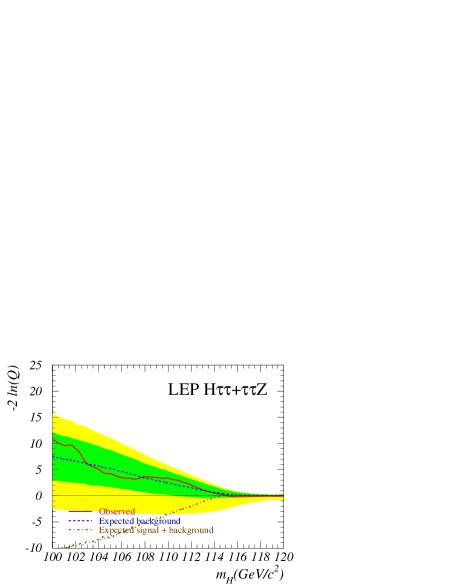
Figure 1 shows the test-statistic as a function of the test-mass for the present combination of LEP data. The expected curves and their spreads are obtained by replacing the observed data configuration by a large number of simulated event configurations.
There is a minimum in the observed at GeV (maximum of the likelihood ratio ) indicating a deviation from the background hypothesis. The minimum coincides with the signal+background expectation for the same test-mass. The value of at GeV is .
Another feature in Figure 1 is a persistent tail in the observation towards lower test-masses where the observed curve stays away from the prediction for background. This is interpreted as being due to a large extent to the experimental resolution. A test has been performed where the signal expected from a 115 GeV Higgs boson was injected in the background simulation and propagated through the likelihood ratio calculation at each value. Although the resulting curve (dotted line) reproduces the main feature of the observed tail 222For a Higgs mass of 115.6 GeV, the outcome would follow closely the dotted curve, slightly displaced, so that its minimum coincides with the signal+background expectation (dash-dotted curve) at GeV., local excess events due to statistical fluctuations can also contribute to the tail.
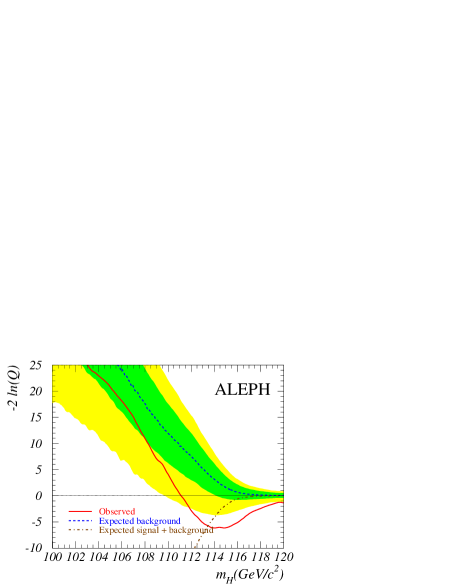
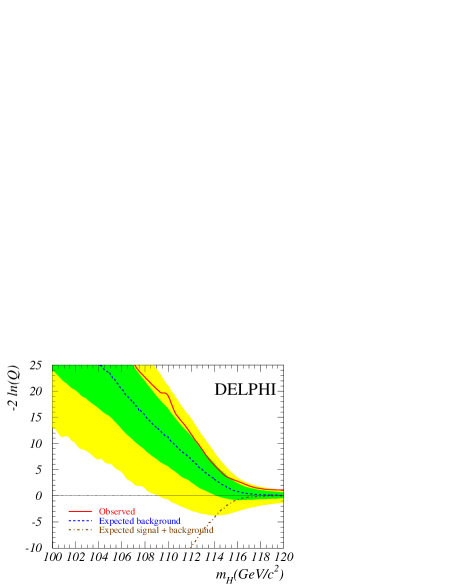
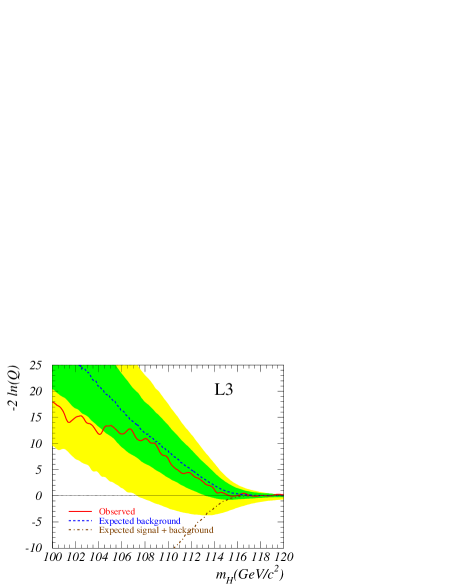
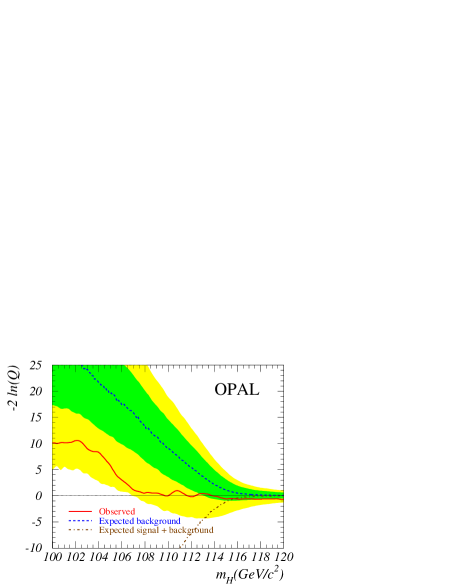
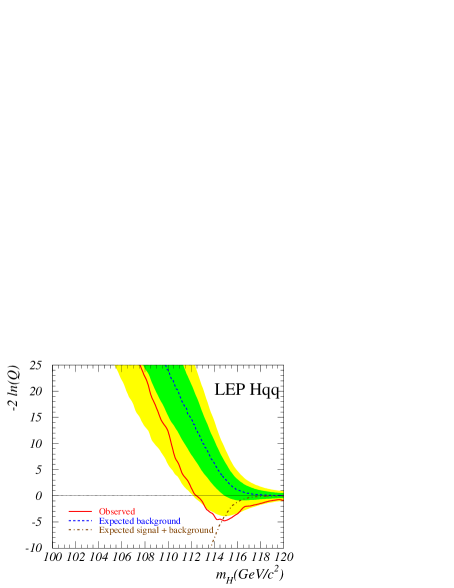
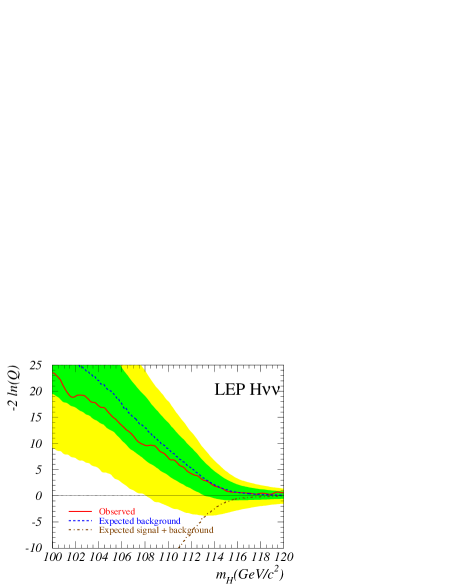
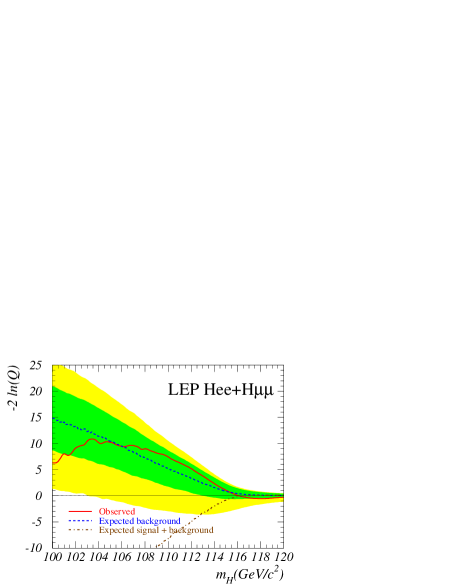
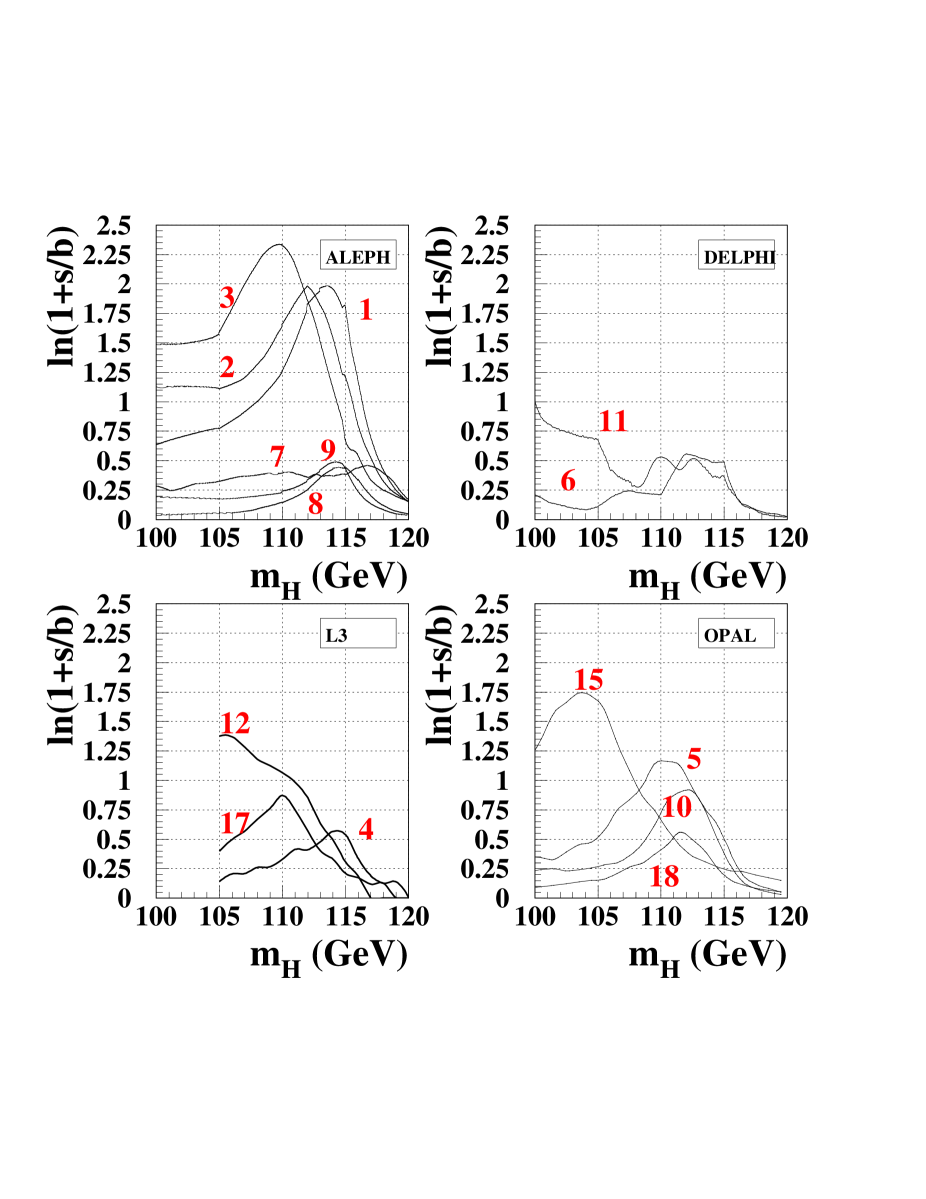
In Figures 2 and 3 the likelihood test is applied to subsets of the data, from individual experiments and final-state topologies. In the vicinity of GeV, the signal-like behaviour mainly originates from the ALEPH data and is concentrated in the four-jet final state. One should note that none of the four experiments, taken separately, have the statistical power to distinguish between the background and the signal+background hypotheses at the level of two standard deviations for a test mass of 115 GeV (see the intersection of the signal+background curve with the lower edge of the light-shaded bands). Among the final-state topologies, only the LEP combined four-jet channel is sufficiently powerful to do so.
2.3 Contributions from single events
The likelihood ratio is built up from individual event weights . The 20 candidates with the highest weights at GeV are listed in Table 3. Some of these candidates are discussed in detail in Ref’s [15], [14], [17], [18] and [23].
| Expt | Decay channel | (GeV) | @115 GeV | ||
|---|---|---|---|---|---|
| 1 | Aleph | 206.7 | 4-jet | 114.3 | 1.73 |
| 2 | Aleph | 206.7 | 4-jet | 112.9 | 1.21 |
| 3 | Aleph | 206.5 | 4-jet | 110.0 | 0.64 |
| 4 | L3 | 206.4 | E-miss | 115.0 | 0.53 |
| 5 | Opal | 206.6 | 4-jet | 110.7 | 0.53 |
| 6 | Delphi | 206.7 | 4-jet | 114.3 | 0.49 |
| 7 | Aleph | 205.0 | Lept | 118.1 | 0.47 |
| 8 | Aleph | 208.1 | Tau | 115.4 | 0.41 |
| 9 | Aleph | 206.5 | 4-jet | 114.5 | 0.40 |
| 10 | Opal | 205.4 | 4-jet | 112.6 | 0.40 |
| 11 | Delphi | 206.7 | 4-jet | 97.2 | 0.36 |
| 12 | L3 | 206.4 | 4-jet | 108.3 | 0.31 |
| 13 | Aleph | 206.5 | 4-jet | 114.4 | 0.27 |
| 14 | Aleph | 207.6 | 4-jet | 103.0 | 0.26 |
| 15 | Opal | 205.4 | E-miss | 104.0 | 0.25 |
| 16 | Aleph | 206.5 | 4-jet | 110.2 | 0.22 |
| 17 | L3 | 206.4 | E-miss | 110.1 | 0.21 |
| 18 | Opal | 206.4 | E-miss | 112.1 | 0.20 |
| 19 | Delphi | 206.7 | 4-jet | 110.1 | 0.20 |
| 20 | L3 | 206.4 | E-miss | 110.1 | 0.18 |
For the events of each experiment with the highest weight at GeV, the evolution of with test-mass is shown in Figure 4. Due to the experimental resolution, candidate events with a given reconstructed mass are seen to have sizeable weights for a range of test-masses, with the maximum weight being for test-masses close to the reconstructed mass.
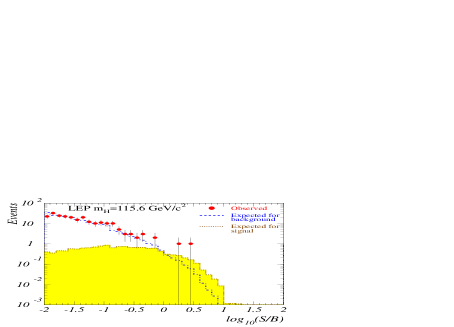
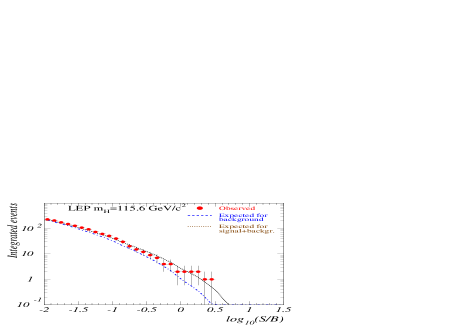
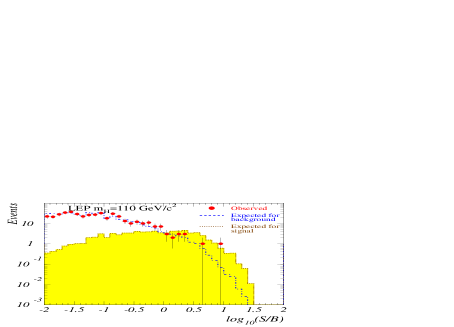
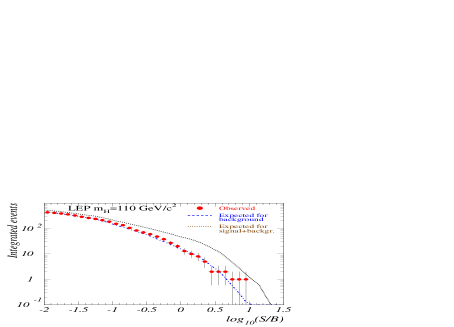
The distribution of event weights for the test-mass fixed at GeV is shown in the upper part of Figure 5 ( is plotted for better visibility). For the purpose of this figure, a cut at has been introduced. The upper right plot shows the integrals of these distributions, starting from high values of (note that the bins are correlated). The data prefer slightly the signal+background hypothesis over the background hypothesis although the separation is weak. The two plots in the lower part show the corresponding distributions for a test-mass chosen arbitrarily at GeV. The data show clear preference for the background hypothesis in this case.
There is a general agreement between the observed and simulated rates, see Table 4.
| Expected signal | Expected backgd. | Data | ||
|---|---|---|---|---|
| 75.7 | 440.0 | 430 | ||
| 63.2 | 128.7 | 151 | ||
| 110 GeV | 55.8 | 77.6 | 84 | |
| 36.8 | 22.6 | 24 | ||
| 21.0 | 7.0 | 7 | ||
| 2.5 | 0.3 | 1 | ||
| 17.7 | 226.5 | 242 | ||
| 11.4 | 34.8 | 47 | ||
| 115 GeV | 8.8 | 16.5 | 20 | |
| 4.4 | 3.4 | 5 | ||
| 1.6 | 0.6 | 2 | ||
| 0.1 | 0.01 | 0 | ||
| 13.4 | 211.7 | 227 | ||
| 7.7 | 26.2 | 38 | ||
| 115.6 GeV | 5.8 | 12.4 | 15 | |
| 2.4 | 2.0 | 4 | ||
| 0.8 | 0.3 | 1 | ||
| 0.03 | 0.004 | 0 |
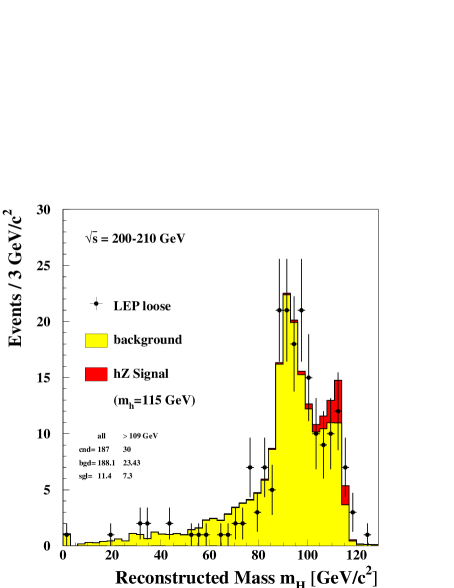
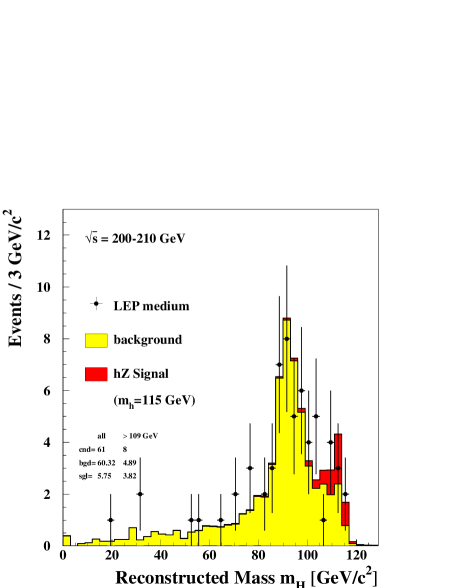
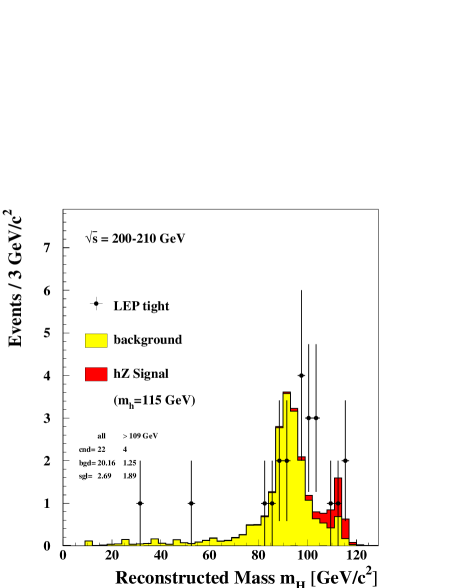
2.4 Distributions of the reconstructed Higgs boson mass
The reconstructed Higgs boson mass is just one of several discriminating variables contributing to the separation of the signal and the background processes and the construction of the likelihood ratio . Since in some channels the event selection depends explicitly on the test-mass, the reconstructed mass distributions resulting from the standard combination procedure are biased. The distributions shown in Figure 6 are therefore obtained from special selections where the cuts are applied on quantities (e.g. b-tag variables) which introduce little bias into the distribution. Three such selections are shown, with increasing signal purity. In the loose/medium/tight selections the cuts are adjusted in each decay channel to obtain for a signal over background ratio 333The signal-to background ratio used in these selection is different from the ratio describing event weights. of 0.5/1/2 in the reconstructed mass region above 109 GeV. These spectra are shown merely to illustrate the agreement between the data and the simulation in this important discriminating variable, and should not be used to draw conclusions regarding the significance of a possible signal. Most importantly, it is not claimed that the slight excess at high mass in the tight selection (4 events for an expected background of 1.25 events) is solely responsible for the result quoted below.
2.5 Confidence level calculation
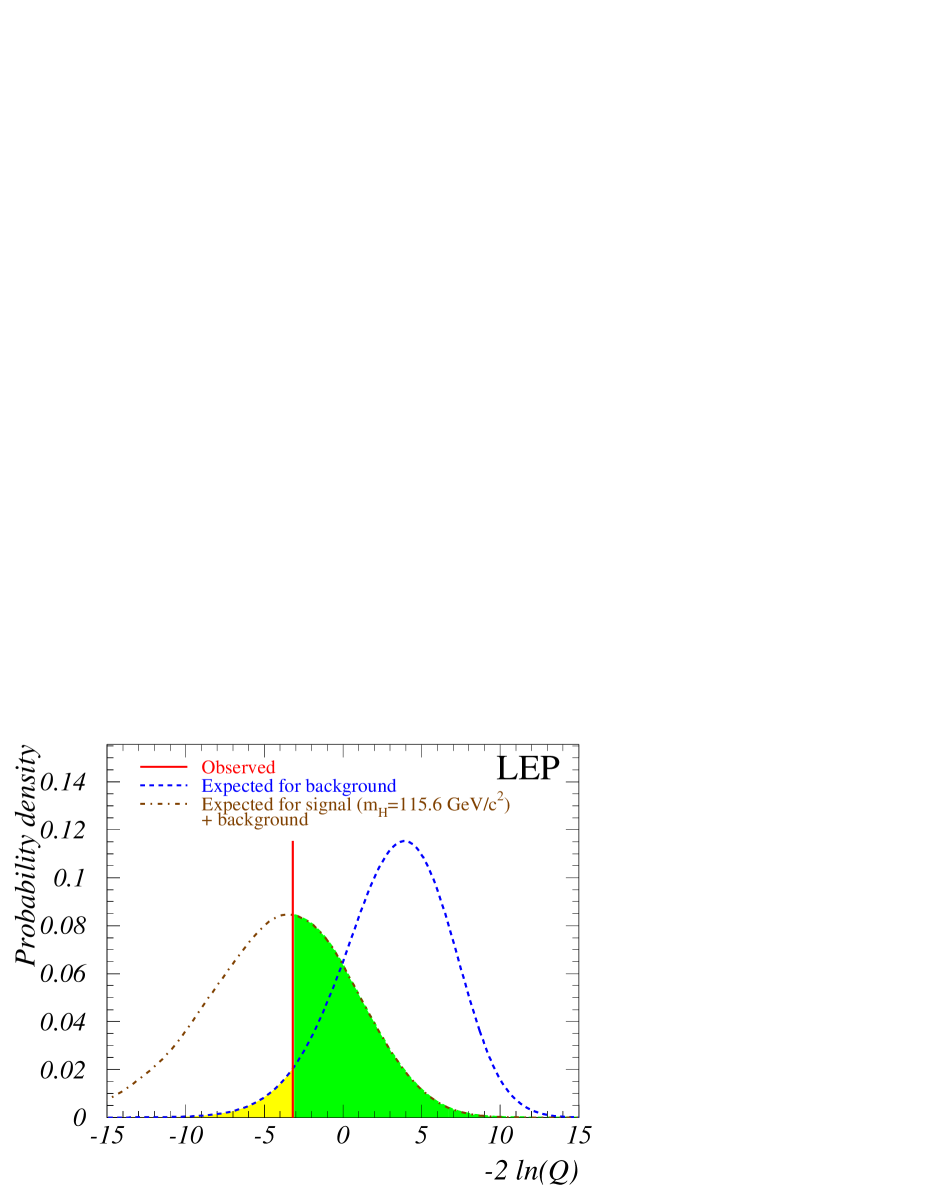
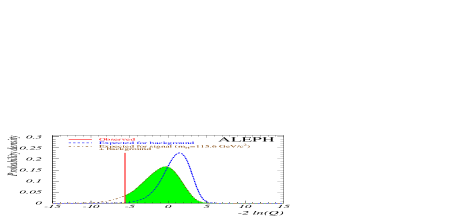
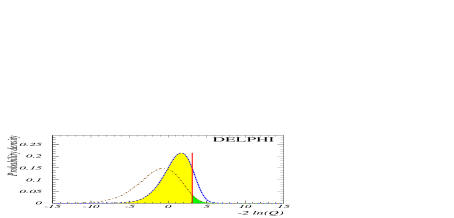
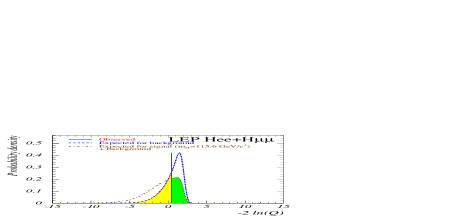
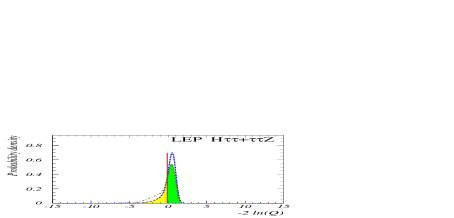
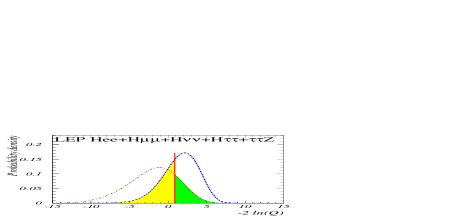
The expected distributions of for a test-mass of 115.6 GeV (a slice of Figure 1 at GeV) are shown in Figure 7. The distributions for the background and the signal+background hypotheses are normalized and represent probability density functions. The vertical line indicating the observed value lies within the distribution for the signal+background hypothesis. The integral of the background distribution from to the observed value, , measures the compatibility of the observation with the background hypothesis. Given a large number of background experiments, it is the probability to obtain an event configuration more signal-like than the one observed. Similarly, the integral from to the observed value of the signal+background distribution, , is a measure of compatibility with the signal+background hypothesis.
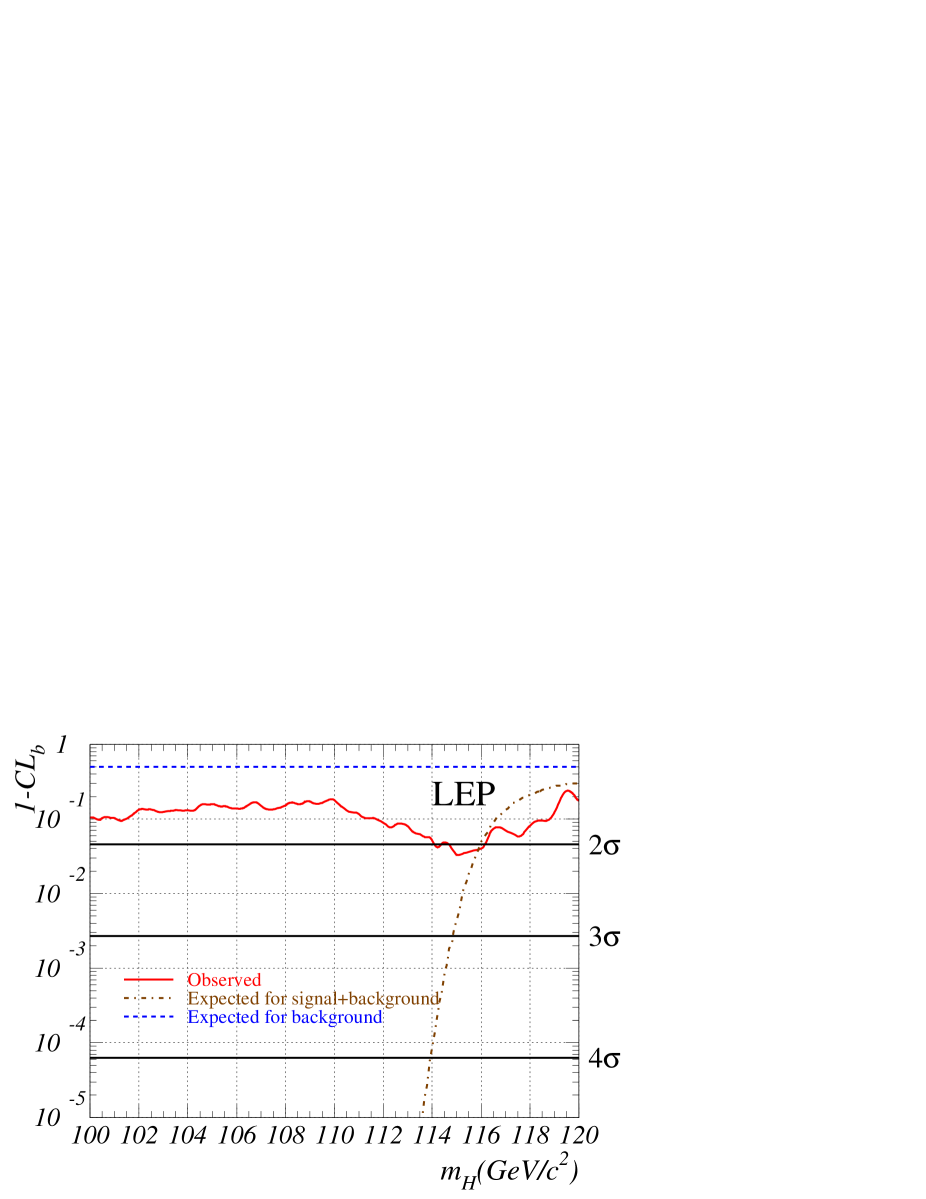
Calculating for test-masses between 100 and 120 GeV, Figure 8 is obtained. At GeV, where the has its minimum (see Figure 1), one gets , which corresponds to about two standard deviations 444For the conversion of into standard deviations , we adopt a gaussian approximation [24] and use a “one-sided” convention where would indicate a “evidence” and a “discovery”. The median expectation for pure background is 0.5. Values smaller or larger than 0.5 indicate an excess or deficit, respectively. In this scheme, the current result, , corresponds to 2.1. The earlier LEP results quoted in the first and second line of Table 1 correspond to and , respectively. This convention is also used in Figure 8 to indicate the levels of significance on the right-hand scale. The and standard deviation “bands” which show up e.g. in the plots correspond to a slightly different, “two-sided”, convention. . Values of and corresponding to GeV are listed in Table 5.
| ALEPH | 0.94 | |
|---|---|---|
| DELPHI | 0.87 | 0.02 |
| L3 | 0.24 | 0.47 |
| OPAL | 0.22 | 0.47 |
| DLO | 0.49 | 0.07 |
| ALO | 0.83 | |
| Four-jet | 0.016 | 0.74 |
| Missing energy | 0.40 | 0.26 |
| All but four-jet | 0.34 | 0.19 |
| LEP | 0.034 | 0.44 |
It should be noted that these probabilities refer to local fluctuations of the background. To obtain the probability for such a fluctuation to appear anywhere within a given mass range of interest, a multiplicative factor has to be applied which is approximated by the width of the mass range divided by the mass resolution. In the present case the range of interest is limited from below by previous exclusion limits (107.9 GeV [9]) and from above by the kinematic limit of the production process HZ (about 116 GeV). The mass resolution averaged over the final-state topologies and experiments is about 3.5 GeV.
2.6 Bounds for the Higgs boson mass and coupling
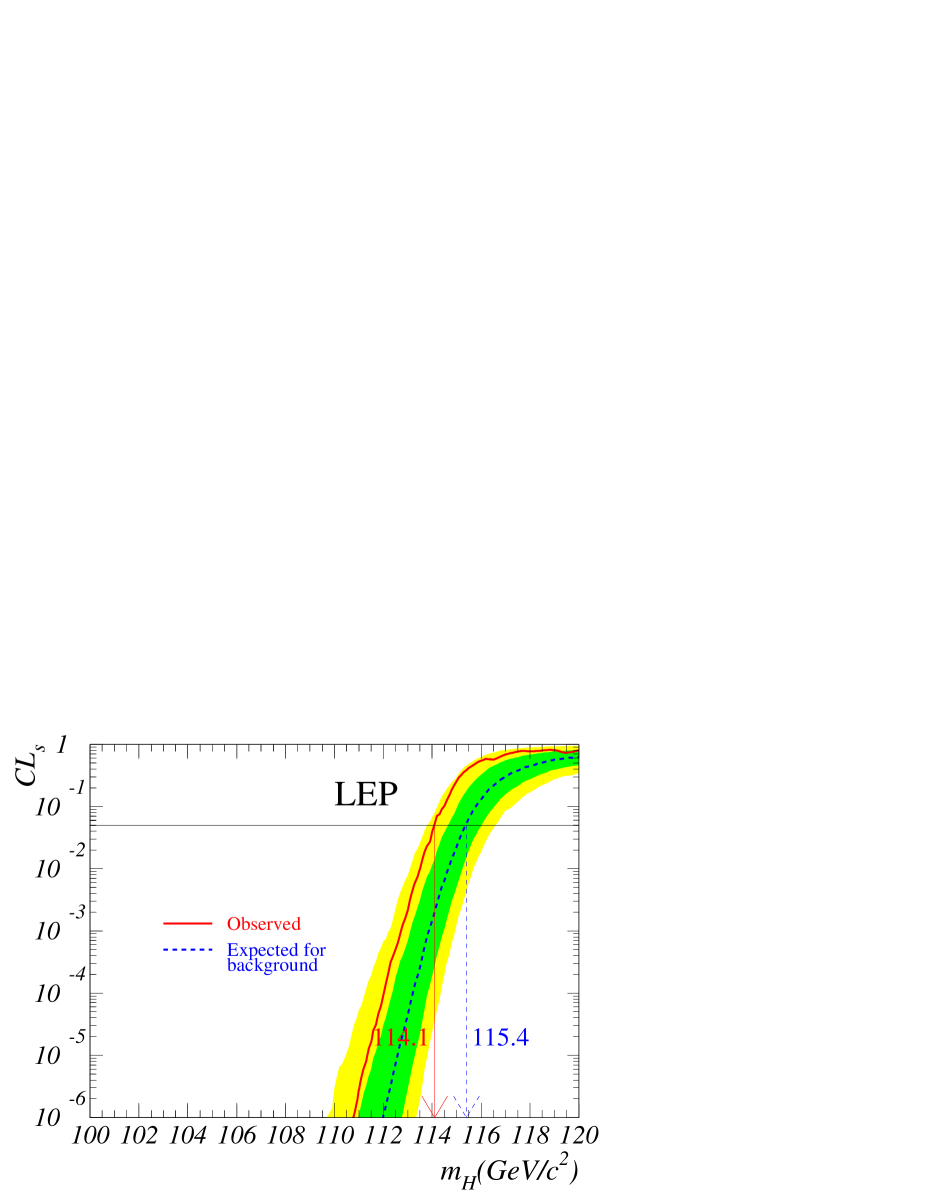
The ratio as a function of the test-mass, shown in Figure 9, is used to derive a lower bound for the SM Higgs boson mass ([9], Appendix A). The test-mass corresponding to defines the lower bound at the 95% confidence level.
| Expected limit (GeV) | Observed limit (GeV) | |
|---|---|---|
| ALEPH | 113.8 | 111.5 |
| DELPHI | 113.5 | 114.3 |
| L3 | 112.7 | 112.2 |
| OPAL | 112.6 | 109.4 |
| DLO | 114.9 | 114.8 |
| LEP | 115.4 | 114.1 |
The expected and observed lower bounds obtained for the SM Higgs boson mass are listed in Table 6. The current lower bound from LEP is 114.1 GeV at the 95% confidence level.
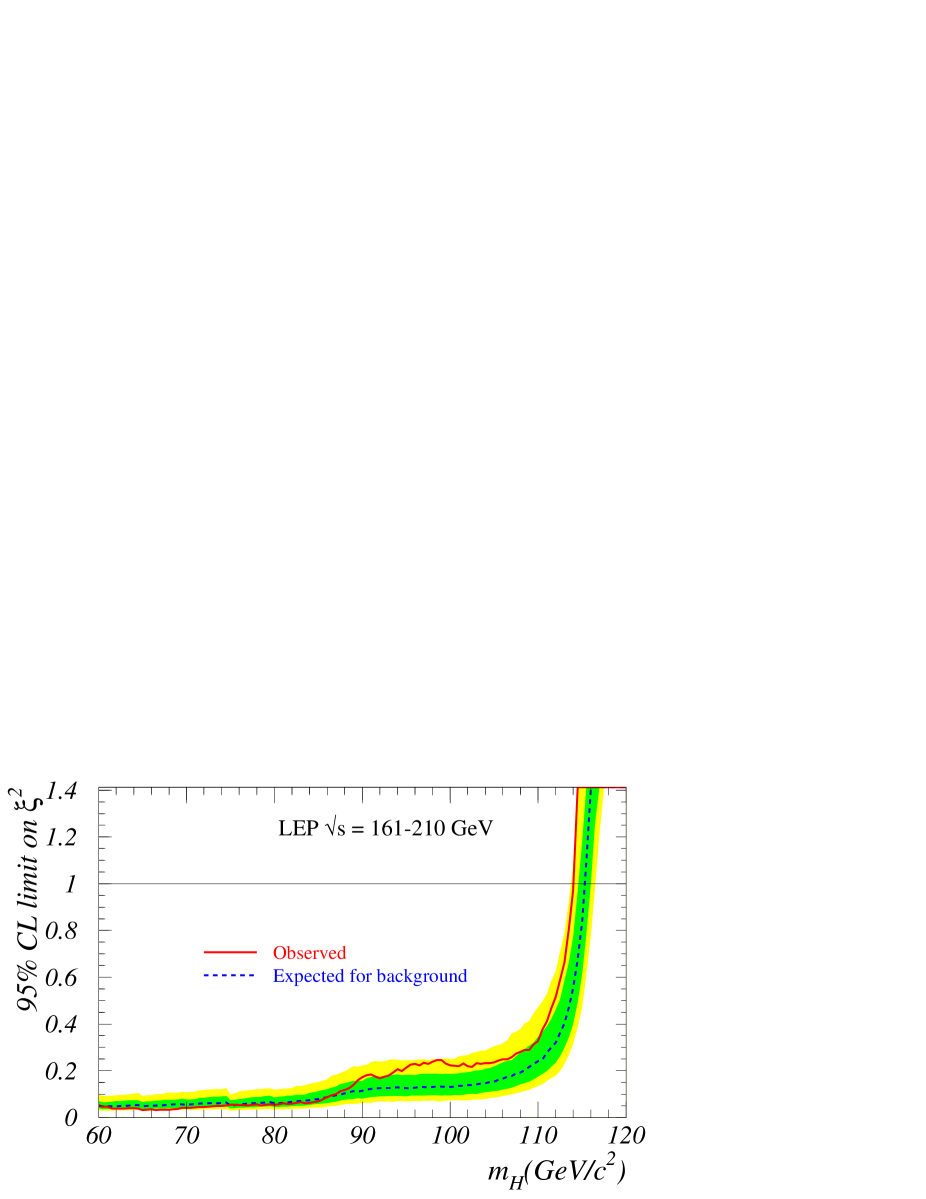
The LEP data are used also to set 95% CL upper bounds on the square of the HZZ coupling in non-standard models which assume the same Higgs decay properties as in the SM but where the HZZ coupling may be different. Figure 10 shows the upper bound on , the square of the ratio of the coupling in such a model to the SM coupling, as a function of the Higgs boson mass. In deriving this limit, the data collected at = 161, 172 and 183 GeV were also included.
3 Cross-checks, uncertainties
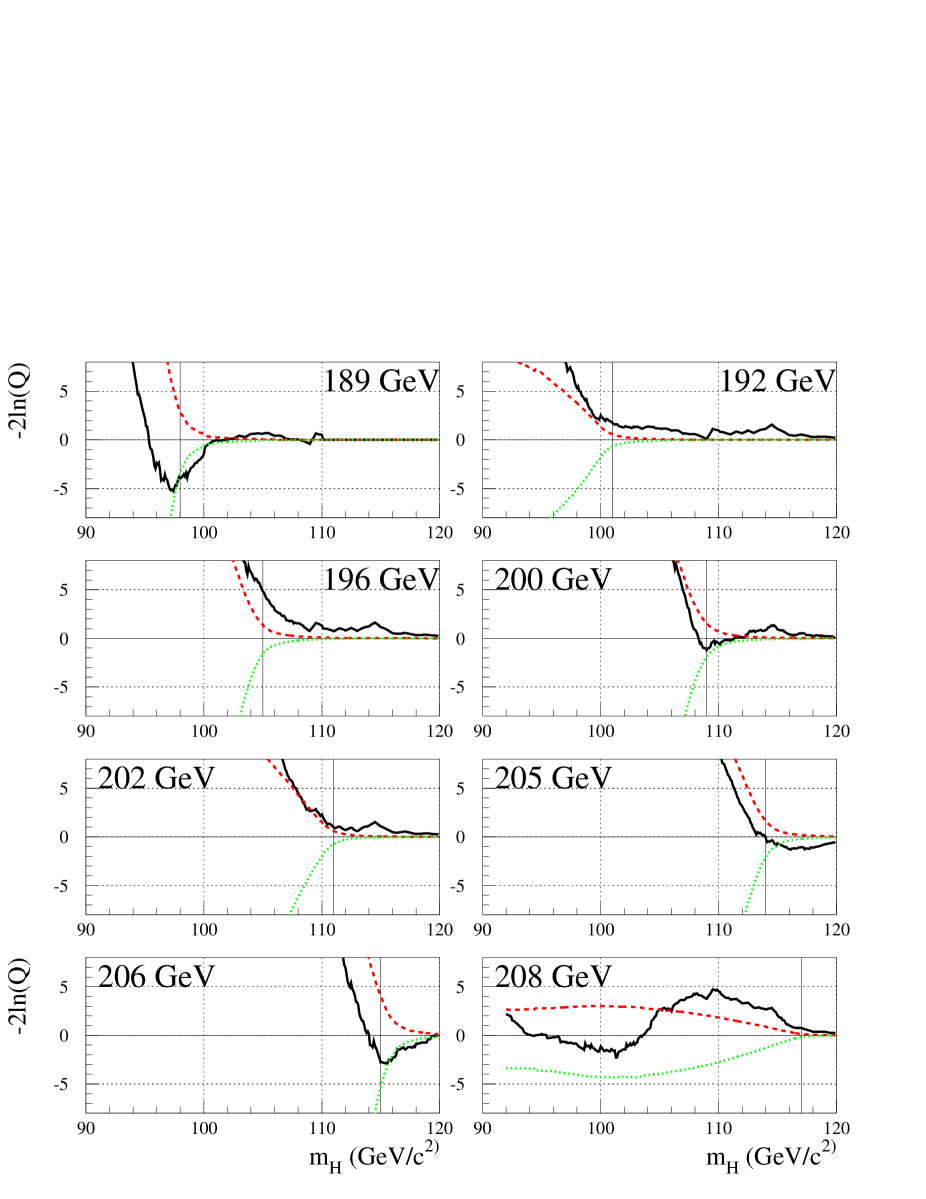
(i) It is legitimate to ask whether the excess at 115 GeV mass could be induced by an inadequate treatment of the data close to the kinematic limit of the process . To test this hypothesis, the curves (the equivalents to Figure 1) have been produced separately for data of different c.m. energies, see Figure 11 . In each plot, the vertical line indicates the test-mass GeV, just at the kinematic limit.
In the 189 GeV data, an excess at GeV has indeed been observed [25] (see the large negative value of close to the signal+background prediction) which was due mainly to small excesses in ALEPH and OPAL data compatible with , the dominant background in the vicinity of that mass. This excess still has a significance of about two standard deviations when LEP data from all energies are combined, and one cannot exclude a physics interpretation beyond the SM (e.g. MSSM with several neutral Higgs bosons). However, there is no evidence for a systematic effect at threshold in the data collected at the other energies below 206 GeV.
(ii) The LEP experiments claim systematic errors of typically 5% for their signal estimates and 10% for their background estimates. Most of the errors are estimated from calibration data (e.g. data taken at to calibrate the b-tagging performance or to determine the level of non-b background) or from measurements of the annihilations into fermion pairs, WW and ZZ processes. The current implementation of systematic uncertainties (see Ref’s [15]-[18] for details) treats errors from the same source as fully correlated between experiments and errors from different sources as uncorrelated. Furthermore, all bins within the same channel have the same errors, and these errors are assumed to have Gaussian distributions. Several tests have been performed to assess the possible impact of this simplified treatment on the result.
(a) If the systematic errors are ignored, decreases from 3.4% to 3.2%.
(b) The backgrounds in all channels have to be increased coherently by 13% to reduce the excess at 115.6 GeV to the level of one standard deviation, and by 26% to get a typical background result (). Such large coherent changes are not consistent with the quoted error estimates.
(c) In a test, the value of for the observed data was recomputed 1000 times, each time with a set of signal and background estimations chosen randomly according to the assigned systematic uncertainties and their correlations. The distribution of at GeV is shown in Figure 12. From the r.m.s. width of the distribution (about 50% of the mean value) and its asymmetry, one can conclude that the spread of results one can obtain by varying the signal and background levels according to their errors is of approximately standard deviations, when is interpreted in terms of standard deviations. The systematic errors are already incorporated into the quoted result, and this information is provided to demonstrate the limited sensitivity to the quoted systematic effects.
These tests do not address the question of completeness of the systematic errors provided by the experiments for the combination. Since only one of the experimental collaborations has published its final results, changes to the systematic errors provided by the other experiments cannot be excluded.
(iii) A technical uncertainty is ascribed to various approximations which are necessary to speed up the computations. This uncertainty is estimated by comparing the results from different software packages and by reproducing the , and results of individual experiments prior to the combination. For the present paper, the value of in the vicinity of GeV has been determined independently by four combiners; they fall within a range of % (relative). The highest value, , is retained as the result.
4 Internal consistency
The excess at GeV has been examined in subsets obtained by dividing the data by experiment and by decay channel. It has also been analysed as a function of signal purity.
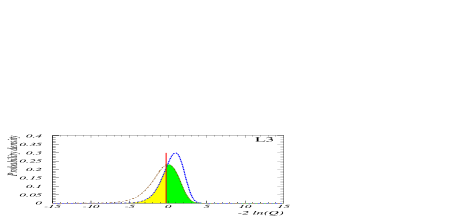
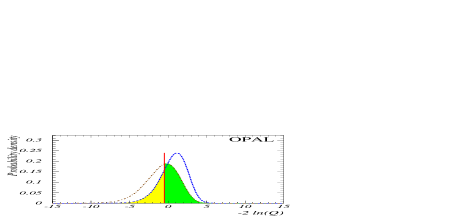
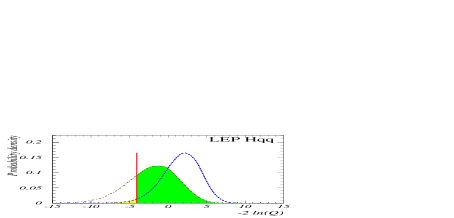
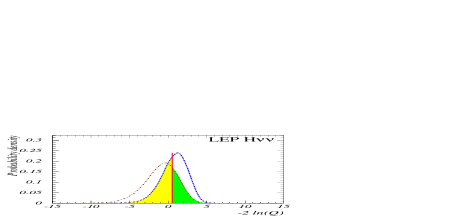
The first two subdivisions have been addressed in Figures 2 and 3 and Table 5. The corresponding probability density distributions for GeV are shown in Figure 13. The largest difference occurs between the subsets of ALEPH and DELPHI. Looking separately at the final state topologies, the excess is mainly concentrating in the four-jet channel. Combining the four experiments while leaving out the four-jet channel, the lowest plot in Figure 13 is obtained.
As seen in Figure 5, the presence of a Higgs boson should affect a substantial part of the event weight distribution. If the data set is subdivided in high- and low-purity subsets by selecting and , at which point the two subsamples have approximately equal expected sensitivity, the contributions to are consistent, and slightly more signal-like (negative) in the low-purity subset. Hence, the observed excess is not due to a few events with exceptionally high weights only, but is reflected by the whole distribution of event weights.
5 Conclusion
Combining the data from the four LEP experiments, a new lower bound for the mass of the Standard Model Higgs boson has been derived, which is 114.1 GeV at the 95% confidence level. There is an excess which can be interpreted as production of a Standard Model Higgs boson with a mass higher than the quoted limit. It is concentrated mainly in the data sets with centre-of-mass energies higher than 206 GeV. The likelihood test designates 115.6 GeV as the preferred mass. The probability for a fluctuation of the Standard Model background is 3.4%. This effect is mainly driven by the ALEPH data and the four-jet final state.
THE RESULTS QUOTED IN THIS PAPER ARE NOT FINAL
SINCE THEY COMBINE PRELIMINARY RESULTS FROM THREE EXPERIMENTS
WITH FINAL RESULTS FROM ONE EXPERIMENT
ACKNOWLEDGEMENTS
We congratulate our colleagues from the LEP Accelerator Division for the successful running in the year 2000 at the highest energies, and would like to express our thanks to the engineers and technicians in all our institutions for their contributions to the excellent performance of the four LEP experiments. The LEP Higgs working group acknowledges the fruitful cooperation between the experiments in developing the combination procedures and in putting them into application.
References
- [1] P.W. Higgs, Phys. Lett. 12 (1964) 132; Phys. Rev. Lett. 13 (1964) 508; Phys. Rev. 145 (1966) 1156; F. Englert and R. Brout, Phys. Rev. Lett. 13 (1964) 321; G.S. Guralnik, C.R. Hagen, and T.W.B. Kibble, Phys. Rev. Lett. 13 (1964) 585.
- [2] S. Weinberg, Phys. Rev. Lett. 19 (1967) 1264; Elementary Particle Theory, A. Salam, ed. N. Svartholm (Almquist and Wiksells, Stockholm, 1968),367.
- [3] N. Cabibbo, L. Maiani, G. Parisi and R. Petronzio, Nucl. Phys. B158 (1979) 295; R. Dashen and H. Neuberger, Phys. Rev. Lett. 50 (1983) 1897.
- [4] M. Lindner, M. Sher and H.W. Zaglauer, Phys. Lett.228B (1989) 139; M. Sher, Phys. Lett. 317B (1993) 159; ibid. 331B (1994) 448; G. Altarelli and I. Isidori, Phys. Lett. 337B (1994) 141; J.A. Casas, J.R. Espinosa and M. Quirós, Phys. Lett. 342B (1995) 89.
- [5] T. Hambye and K. Riesselmann, Phys. Rev. D55 (1997) 7255.
- [6] Y. Okada, M. Yamaguchi, and T. Yanagida, Theor. Phys. 85 (1991) 1; H. Haber and R. Hempfling, Phys. Lett. 66 (1991) 1815; J. Ellis, G. Ridolfi, and F. Zwirner, Phys. Lett. B257 (1991) 83; R. Barbieri and M. Frigeni, Phys. Lett. B258 (1991) 395; S. Heinemeyer, W. Hollik and G. Weiglein, Eur. Phys. Jour. C9 (1999) 343; M. Carena, M. Quirós and C. Wagner, Nucl. Phys. B461 (1996) 407; H. Haber, R. Hempfling and A. Hoang, Z. Phys. C75 (1997) 539.
- [7] Ch. Kolda and H. Murayama, The Higgs Mass and New Physics Scales in the Minimal Standard Model, hep-ph/0003170 (March 2000).
-
[8]
The LEP Electroweak Working Group, public page,
http://lepewwg.web.cern.ch/LEPEWWG/ (updated July 10, 2001). - [9] ALEPH, DELPHI, L3 and OPAL Collaborations, The LEP working group for Higgs boson searches, Searches for Higgs bosons: Preliminary combined results using LEP data collected at energies up to 202 GeV, CERN-EP/2000-055.
- [10] ALEPH, DELPHI, L3 and OPAL Collaborations, The LEP working group for Higgs boson searches, Searches for Higgs bosons: Preliminary combined results using LEP data collected at energies up to 209 GeV, ALEPH 2000-074 CONF 2000-051, DELPHI 2000-148 CONF 447,L3 Note 2600, OPAL Technical Note TN661, submitted to ICHEP’2000, Osaka, Japan, July 27-August2, 2000.
- [11] Shan Jin, Search for Standard Model Higgs Boson at LEP2, Proc. ICHEP-2000, Ed. C.S. Lim, T. Yamanaka, Vol II, p. 1105; P. Igo-Kemenes, Searches for New Particles and New Physics: Results from Colliders, ibidem, Vol. I, p. 133.
- [12] D. Schlatter for the ALEPH Collaboration, LEP Committee Open Session, 5.9.2000.
- [13] P. Igo-Kemenes for the LEP Higgs working group, LEP Committee Open Session, 3 November, 2000, http://lephiggs.web.cern.ch/LEPHIGGS/talks/index.html.
- [14] L3 Collaboration, M. Acciarri et al., Phys. Lett. B495 (2000) 18.
- [15] ALEPH Collaboration, R. Barate et al., Phys.Lett. B495 (2000) 1.
- [16] DELPHI Collaboration, P. Abreu et al., Phys. Lett. B499 (2001) 23.
- [17] L3 Collaboration, M. Acciarri et al., Phys. Lett. B, submitted for publication.
- [18] OPAL Collaboration, G. Abbiendi et al., Phys. Lett. B499 (2001) 38.
-
[19]
J. Ellis, M.K. Gaillard, and D.V. Nanopoulos, Nucl. Phys. B106 (1976) 292;
B.L. Joffe and V.A. Khoze, Sov. J. Part. Phys. 9 (1978) 50;
B.W. Lee, C. Quigg and H.B. Thacker, Phys. Rev. D16 (1977) 1519;
J.D. Bjorken, Pproc. 1976 SLAC Summer Inst. Part. Phys., ed. M.C. Zipf (SLAC report 198,1977) 1.
F.A. Behrends and R. Kleiss, Nucl. Phys. B260 (1985) 32. - [20] W. Kilian, M. Kramer, and P.M. Zerwas, Phys. Lett. B373 (1996) 135.
- [21] A.L. Read, Linear interpolation of histograms, Nucl. Instr. Methods A 425 (1999) 357.
- [22] K.S. Cranmer, Kernel Estimation in High Energy Physics, Comput. Phys. Commun. 136 (2001) 198.
- [23] L3 Collaboration, Search for the SM Higgs boson with the L3 experiment at LEP, L3 Note 2688, June 2001.
- [24] D.E. Groom et al., Review of particle physics, Eur. Phys. Journ. C15 (2000) 1.
- [25] ALEPH, DELPHI, L3 and OPAL Collaborations, and the LEP Higgs Working Group, Searches for Higgs bosons: Preliminary combined results from the four LEP experiments at GeV, ALEPH-CONF 99-052, DELPHI-CONF 327, L3 Note 2442, OPAL TN 6614 (July 1999).