Mixing in FOCUS
We report on a direct measurement of the mixing parameter in the system by measuring the lifetime difference between the mixed final state and the even state . We also present a study of the decay based on a sample of observed events compared to events observed in the Cabibbo favored channel . The observed branching ratio is used to obtain limits on the mixing parameters and and the doubly Cabibbo suppressed branching ratio, . These studies are based on a large sample of photoproduced charm mesons from the FOCUS experiment at Fermilab (FNAL-E831).
1 Introduction
Mixing occurs because the neutral mass eigenstates (or eigenstates in the limit of conservation) do not coincide with the flavor eigenstates and . The mixing effects are parameterized by two dimensionless amplitudes
| and | (1) |
where is the mass difference between the two mass eigenstates, is the width difference and is the average width. In the Standard Model, the system mixing rate () is generally believed to be much smaller than the current experimental sensitivity [1]. Nevertheless, recent measurements hint at a possible mixing effect at the edge of sensitivity. We report here on two such studies made with the FOCUS data.
The data were collected by the FOCUS Collaboration during the 1996-97 Fermilab fixed target run in the Wideband Photon beam line using an upgraded version of the E687 spectrometer [2]. Charm particles are produced in the interaction of high energy photons ( GeV) with a segmented BeO target. In the target region, charged particles are tracked by 16 layers of silicon microstrip detectors which provide excellent vertex resolution. The momentum of the charged particles is determined by measuring their deflection in two oppositely polarized, large aperture dipole magnets with five stations of multiwire proportional chambers. Particle identification is determined by three multicell threshold Čerenkov detectors, electromagnetic calorimeters, and muon counters.
2 Direct Measurement of from Lifetime Differences
By measuring and comparing the lifetime for neutral ’s decaying to final states of pure even and odd a direct measurement of can be made. In this study [3], the final state is used as the even final state and, in the absence of a suitable odd candidate, the mixed state is used. Assuming that is an even mixture of even and odd the relationship between the two lifetimes and the mixing parameter is given by
| (2) |
The lifetime distributions for the 10 331 decays to and 119 738 decays to are shown in Fig. 1a. From exponential fits to the distributions we find and where the errors are statistical (systematic errors are only evaluated on the ratio). Plugging these lifetimes into Eq. (2) we obtain .


3 Study of the Decay
The process may occur through either a doubly Cabibbo suppressed (DCS) decay, or by mixing to followed by the Cabibbo favored (CF) decay . The expected rate for the DCS decay relative to the CF decay () is approximately , while Standard Model based predictions for range from to . The large uncertainty in the mixing rate is due to mixing mediated by intermediate meson states [4] whose contributions are not calculable in perturbative QCD. Nevertheless, large cancellations among the various intermediate meson states are expected and most studies conclude that the mixing rate should be at least a couple orders of magnitude less than level [5]. Also, effects from beyond the Standard Model may enhance .
In this study [6], we begin by measuring the rate of decays relative to aaaCharge conjugate modes are implicitly included.. The neutral flavor is determined by requiring the decay chain . This is achieved by looking for a narrow signal at 145 in the mass difference between the and candidates. The mass difference distribution for candidates is shown in Fig. 1b. We find events compared to decays of for a branching ratio of ()%.
The time dependence of the decays is given by
| (3) |
where and are phase rotations of and given by and with the strong force phase between the CF and DCS processes. Clearly, Eq. (3) indicates that in the case of significant mixing the measured branching ratio is dependent on the lifetime acceptance of the analysis. To account for this effect a large Monte Carlo sample of decays is used. Each Monte Carlo event accepted in the analysis is given a weight determined by the relative probability for an event with its lifetime given by Eq. (3) divided by the probability for the same lifetime in the exponential decay rate used to generate the Monte Carlo. In this way we derive a relationship for as a function of and which depends only on the measured branching ratio, and the first and second moments of the accepted lifetime distribution in the Monte Carlo. The functional dependence on in the experimentally allowed region is small, while the dependence on (shown in Fig. 2a for the case of ) is large. For comparison, the and ranges from CLEO II.V [7] and the limit from FOCUS (discussed in Sect. 2) are also shown in this figure.
To determine limits on , and , the data is split into high and low lifetime samples. The branching ratio determined in each sample can be used to generate high and low lifetime curves in space like the one shown in Fig. 2a. The point where these curves cross indicates the preferred values of and . To quantitatively determine the 95% confidence level (CL) allowed range, we integrate the likelihood for all points in the space and assign the 95% CL boundary to the high and low values beyond which the total integrated likelihood is equal to 2.5%. In determining () limits the value of is set to zero (the value of with greatest likelihood) and we integrate over the entire allowed range () variable. Using this procedure we find preliminary limits of
| and | ||||
The large upper limit on and large negative lower limit on are the result of a second crossing point of the high and low lifetime curves. This property is an unfortunate side effect of using only one lifetime split – the fitting procedure [6] and limited statistics prevent more data splits. Nevertheless, the second crossing and its associated limits are far outside the allowed region of CLEO II.V [7] and are also expected to be ruled out by the improved limits on and from FOCUS semileptonic mixing studies.

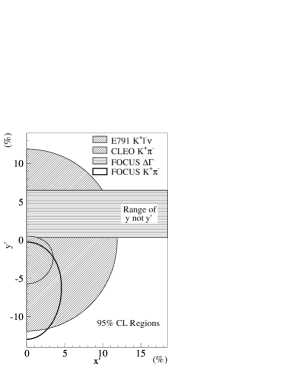
To determine a limit on we integrate over the entire allowed range of and obtaining the preliminary limit of
We also determined a 95% CL boundary in space by integrating over all allowed values of and selecting the boundary line that is isometric in likelihood and contains 95% of the total likelihood. This boundary is shown in Fig. 2b. Also shown in Fig 2b are the best existing limits from the semileptonic mixing (E791[8]), lifetime differences (FOCUS) and (CLEO II.V).
4 Conclusions
While the recent measurements in mixing do not rise to the level of a discovery, they do warrant further study. A discovery of a non-zero at the percent level () would not necessarily indicate new physics, but it would be unexpectedly large, and at the very least would lead to a deeper understanding of the processes involved in meson mediated mixing.
The current data from FOCUS and CLEO II.V suggest two possible scenarios. The first scenario is that there is -like mixing at the few percent level and a large ( radians) strong phase. The second scenario is that some or all of the recent measurements are fluctuations. New measurements are required to determine which of these two possibilities is correct.
References
- [1] For a compilation of Standard Model and Non-Standard Model theoretical predictions for mixing see H. N. Nelson, e-Print Archive hep-ex/9908021, (1999).
- [2] P. L. Frabetti et al., Nucl. Instrum. Methods A 320, 519 (1992).
- [3] J. M. Link et al, Phys. Lett. B 485, 62 (2000).
- [4] L. Wolfenstein, Phys. Lett. B 164, 170 (1985).
- [5] See for example J. F. Donoghue et al, Phys. Rev. D 33, 179 (1986); H. Georgi, Phys. Lett. B 297, 353 (1992); and T. Ohl, G. Ricciardi, E. H. Simmons, Nucl. Phys. B 403, 605 (1993).
- [6] J. M. Link et al, Phys. Rev. Lett. 86, 2955 (2001).
- [7] R. Godang et al, Phys. Rev. Lett. 84, 5038 (2000).
- [8] E. M. Aitala et al, Phys. Rev. Lett. 77, 2384 (1996).
- [9] S. Bergmann et al, Phys. Lett. B 486, 418 (2000).