Solar Neutrino Results from Super-Kamiokande
Super-Kamiokande has measured the solar neutrino flux using elastic neutrino-electron scattering in water. The measured flux is (stat)(syst)/(cm2s) based on the energy range of 5 to 20 MeV for the recoiling electron. The time-dependence and energy spectrum of the recoiling electrons were studied to search for two-neutrino oscillation signatures. The absence of either significant zenith angle flux variation or distortions of the recoil electron spectrum places strong constraints on neutrino mass difference and mixing. In combination with the flux measurement, two allowed regions at large mixing are found.
1 Introduction
Using various detection methods, measurements of the solar neutrino flux fall short of the flux predicted by the standard solar model (SSM). This discrepancy is known as the “solar neutrino problem”. Neutrino flavor oscillations, similar to those seen in atmospheric neutrinos , are a natural explanation for the discrepancy. In addition to a conversion in vacuum, a matter-induced resonance in the sun may sufficiently enhance the disappearance probability of solar neutrinos even for small neutrino mixing. Matter effects can also modify the survival probability for neutrinos which pass through the earth .
Super-Kamiokande (SK) is a 50,000 metric ton water Cherenkov detector. Solar Neutrinos are detected via elastic neutrino-electron scattering if the reconstructed energy of the recoiling electron is above 5 MeV. Vertex, direction and energy are reconstructed using the timing and pattern of the Cherenkov light produced by the recoil electron. About 11,000 photomultiplier tubes (PMTs) view the “inner detector”, a cylindrical volume containing 32,000 metric tons of water. Restricting the vertex of the solar neutrino event candidates to further than 2m from the PMTs leaves 22,500 tons of fiducial mass. Due to the energy threshold of 5 MeV, only the 8B decay and the He—proton reaction (hep) branches of the solar neutrino spectrum are accessible. To extract the solar neutrino flux from the sample of solar neutrino event candidates, the reconstructed direction of the recoiling electron is used (see for details). The angle is defined as the angle between the reconstructed electron direction and the vector pointing from the sun to SK. In figure 1, the distribution of cos is shown. The strong correlation of the recoil electron direction with the neutrino direction leads to a clear peak at cos=1. Using 1258 days of data, the measured flux is (see figure 1)
| (1) |
or (stat)(syst)% of the flux predicted by the BP2000 SSM.
The solar neutrino flux from the hep branch is expected to be about three orders of magnitude smaller than the 8B branch. The endpoint of the hep spectrum (18.77 MeV) is higher than the 8B spectrum endpoint (16 MeV). If the flux differs from expectation, the recoil electron spectrum will appear distorted. To place an upper limit on the flux, we define an energy range by maximizing sensitivity to hep neutrinos. The energy range chosen is 18 to 21 MeV. In this range we observe 1.32.0 solar neutrino events, or less than 3.9 events at 90% confidence level. From BP2000 (cm2s)) we expect 0.9 hep neutrinos, so 3.9 events correspond to an upper limit of the hep flux of cm2s) at 90% confidence level (4.3 times the BP2000 prediction assuming no oscillation).

2 Time Variation of the Flux
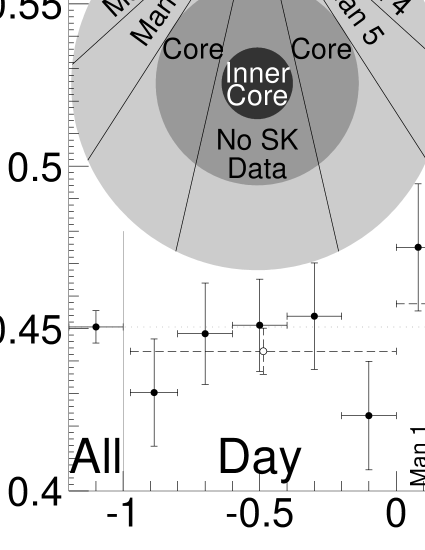
We define the zenith angle of an event as the angle between the vertical direction and the vector sun—SK at the time of the event. Day events have and night events . Dividing the data into zenith angle bins, a flux is measured for each sub-sample. The resulting zenith angle distribution is shown in figure 1. It is consistent with a flat suppression of about 50% of the expected solar neutrino flux. To test the influence of the earth’s matter density on the solar neutrino flux (a regeneration of the flux is predicted for some neutrino oscillation parameters) we construct the day–night asymmetry
| (2) |
from the day flux and the night flux . This asymmetry is
| (3) |
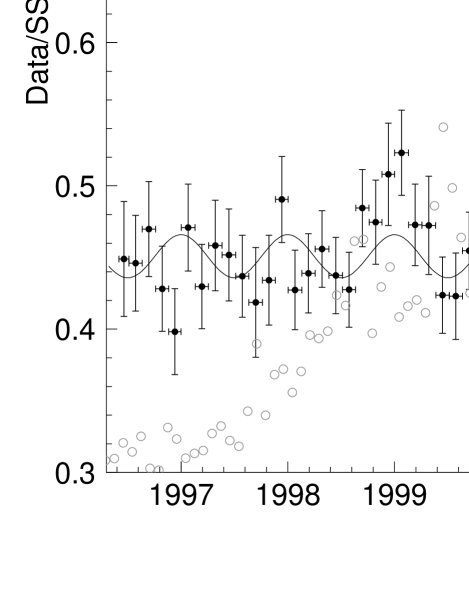
It is consistent with zero. Figure 2 shows the time variation of the solar neutrino flux. Each time bin extends over 1.5 months. No correlation with the sunspot activity was observed. Due to the eccentricity of the earth’s orbit, the distance between sun and earth changes by about 3% with the season. As a consequence, a 7% annual modulation of the solar neutrino flux is expected. Some oscillation parameters predict a modification of this 7% modulation due to a change in the oscillation phase. To test this, the time bins are combined into 8 seasonal bins. The seasonal distribution is shown in figure 2. A test including systematic uncertainties results in 3.8/7 degrees of freedom (for 7% modulation) compared to 8.1 (for flat). Therefore, a 7% annular modulation is favored over no modulation at the 2 level.

3 Neutrino Oscillation Search
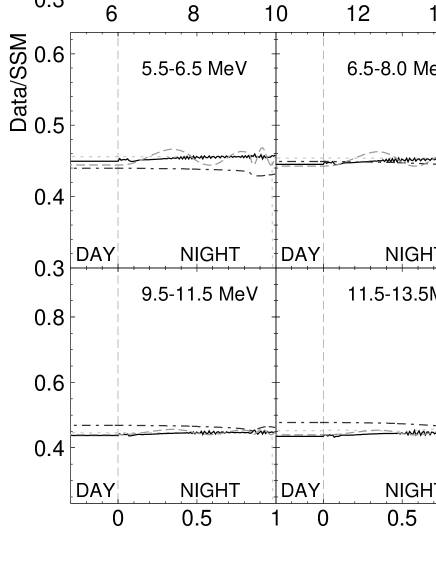
In addition to suppression of the solar neutrino flux or modification of the seasonal dependence, neutrino oscillations can distort the neutrino spectrum (and therefore the recoil electron spectrum) or introduce zenith angle variations. To simultaneously study recoil electron spectrum and zenith angle dependence of the solar neutrino flux, the data are divided into energy bins and zenith angle bins. SK defines eight energy bins and seven zenith angle bins (see figure 3). The size of each energy bin is about one standard deviation of the energy resolution function. Due to a statistical limitation, the data below 5.5 MeV and above 16 MeV are not broken into zenith angle bins. All other data are subdivided into six (about evenly-spaced) zenith angle bins for the night and one bin for the day. Solar neutrinos in the sixth night bin pass through the core of the earth. This way to bin the data is referred to as ‘zenith angle spectrum’.
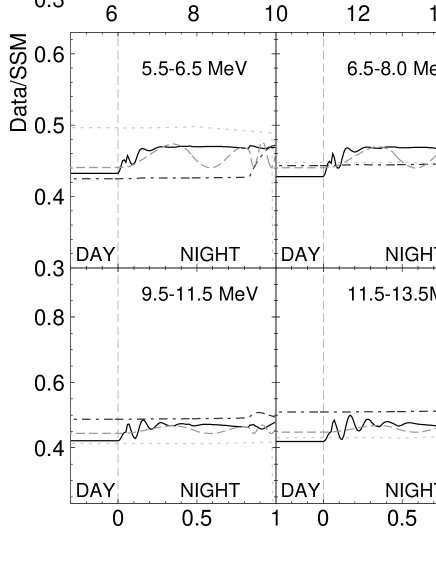

There are several distinct two-neutrino oscillation solutions to the solar neutrino problem: The Large Mixing Angle (LMA) solution has a mass2 difference of about to eV2 and a mixing angle in the range of =0.4 to 1. The Small Mixing Angle Solution (SMA) has a somewhat smaller and mixing between and . The mixing at the LOW solution is close to maximal and the mass2 difference is about eV2. Below eV2 there are several VAC solutions where matter effects are unimportant. As shown in figure 3, LMA solutions show little spectral distortions, but have rapid oscillations of the flux as a function of zenith angle. The amplitude of these oscillations is larger for a larger recoil electron energy. Conversely, the high part shows almost no zenith angle variation. The LOW solution has a small spectral distortion and slow oscillations of the flux as a function of zenith angle. The amplitude is larger for smaller recoil electron energy. A lower will then suppress these oscillations. The SMA has moderate spectral distortion. There is almost no zenith angle variation in the mantle region, but there is enhancement (suppression) of the core flux at low recoil electron energy in the adiabatic (non-adiabatic) region. The VAC solutions typically have strong spectral distortion. The zenith angle variation is tiny (and due to a modified seasonal flux variation in conjunction with the correlation of season and zenith angle at SK’s geographic position). An explanation of the MSW zenith angle signatures can be found in . The measured zenith angle spectrum is most consistent with flat, i.e. no spectral distortion and no zenith angle dependence. It therefore favors high LMA and low LOW solutions as well as very small mixing SMA solutions in the non-adiabatic region, where the predicted spectral distortion is weak.
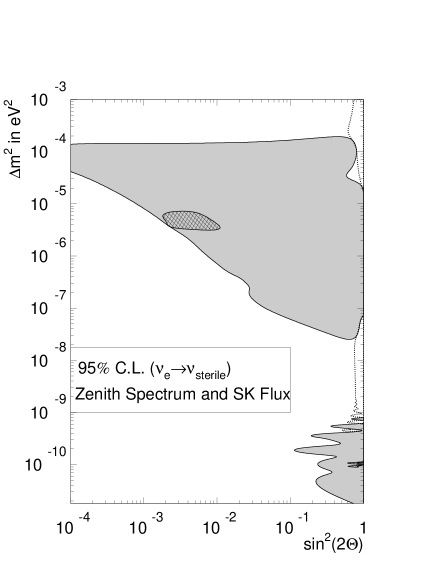
A calculation of the zenith angle spectrum for each oscillation parameter was obtained as described in for two cases: (i) oscillation into only active (-type or -type) neutrinos (ii) oscillation into only sterile neutrinos. As in we define a to compare prediction against data. A larger than expected flux from the hep branch of solar neutrinos can mimic the spectral distortion signature of neutrino oscillations. There is no hep flux uncertainty given in . Therefore we search for the best-fit hep flux for each oscillation parameter set. The best-fit parameters are (, eV2) with 36.1/40 degrees of freedom (78.8% normalization factor and 0 hep) in the active and 35.7/40 degrees of freedom (91.7% normalization factor and 0 hep) in the sterile case. The shaded areas in figure 4 show 95% confidence level excluded regions based on this minimum. Also seen in figure 4 are cross-hatched regions which represent 95% confidence level allowed regions (LMA, SMA and VAC) based on the measured rates of Homestake , GALLEX/GNO , SAGE and SK .
The best-fit zenith angle spectrum was searched for in these regions. (The LOW search region was for sin and eVeV2, the VAC region for eV2) The zenith angle spectra are shown in figure 5. Only the LMA fit is truly inside the LMA region. The SMA (in the non-adiabatic region at the lower left corner) and LOW best-fits are at the boundary. The VAC best-fit point is at higher than the regions shown in figure 4. The best-fit zenith angle spectra predict little spectral distortion or zenith angle variation. The residual spectral distortion of the best-fit SMA zenith angle spectrum leads to a low confidence level (about 7% from comparison with the minimum).
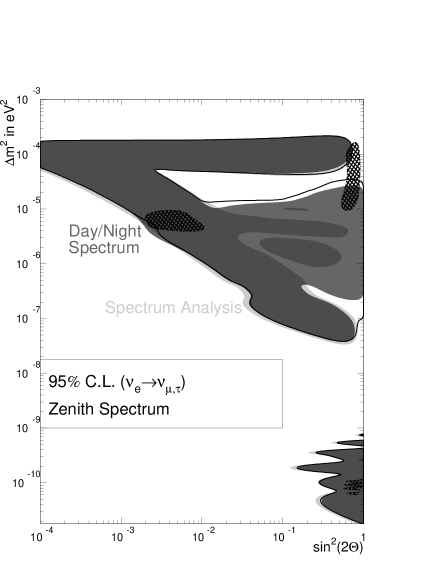
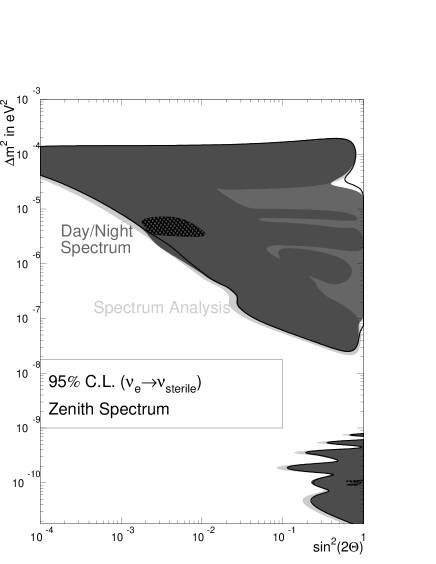
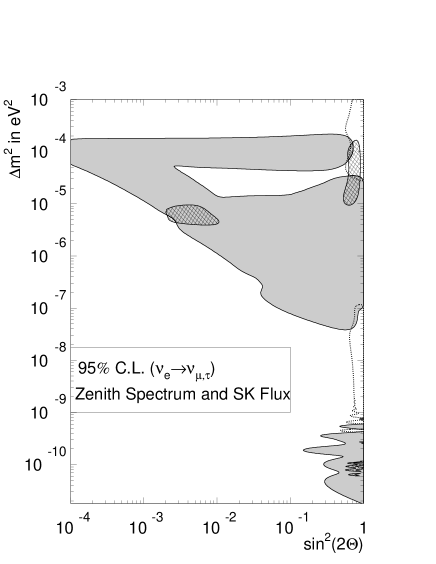
We combined the night zenith angle bin and analyzed a day/night spectrum (eight energy bins, two zenith angle bins). Finally, we combined all zenith angle bins to search for spectral distortions only (eight energy bins). The resulting exclusion regions (95% confidence level) are shown in figure 6. The day/night spectrum expands the area excluded due to spectral distortion by a triangular region where a day–night asymmetry is predicted. Due to the zenith angle variation inside the night bin the zenith angle spectrum expands the excluded region further near the LOW and the LMA solutions. The non-adiabatic region of the SMA predicts a core suppression. It fits better with the zenith angle spectrum than either the spectrum or the day/night spectrum. This is due to a slightly smaller measured flux in the core bin compared to the day bin. Since the overall night flux exceeds the day flux, the day/night spectrum excluded area in this region is larger than that of the spectrum.
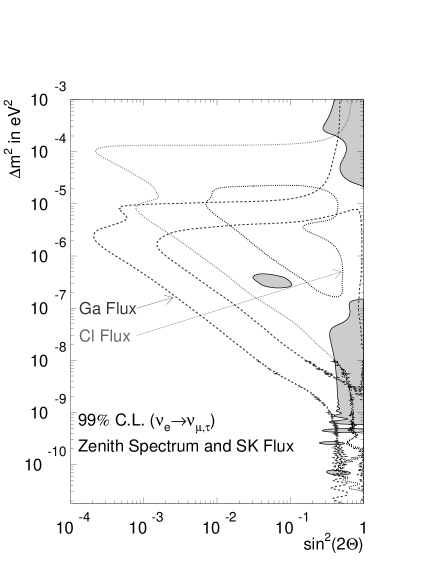
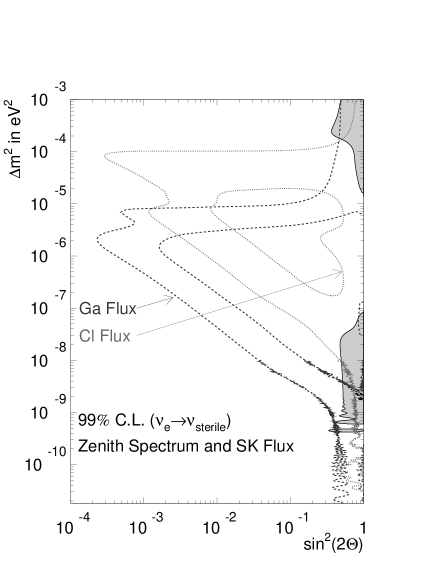
We also performed an analysis constraining the normalization factor within the BP2000 uncertainty. There is little change in best-fit point, normalization factor and hep flux. The becomes 37.8/41 degrees of freedom in the active and 35.9/41 degrees of freedom in the sterile case. The region inside the dotted lines of figure 4 is allowed at 95% confidence level. In both the active and the sterile case, the 95% confidence level SMA and VAC regions are disfavored by the zenith spectrum shape at about 95% confidence level. The upper part of the LMA region is consistent with the zenith angle spectrum shape. The LMA region is missing in the sterile case (the sterile LMA cannot explain the difference between Homestake’s and SK’s rate by either spectral distortion or increased neutral current contribution to SK’s rate). SK data by itself (zenith spectrum and SK rate) result in two allowed areas at large mixing for either case. These areas are also shown in figure 7 at 99% confidence level. In the active case, three small areas appear at 99%; one at sin=0.03 to 0.1, 2–4eV2 in the MSW region and two which are close to the vacuum solution. No allowed region appears close to the small mixing angle solution. No new areas appear in the sterile case.
4 Conclusion
With 1258 days of data, Super-Kamiokande has measured the 8B branch of the solar neutrino flux to be (stat)(syst)/(cm2s) and the hep branch to be less than cm2s) at 90% confidence level. No correlation of the neutrino flux with sunspot activity has been seen. The seasonal dependence of the neutrino flux favors the 7% modulation due to the eccentricity of the earth’s orbit. No zenith angle dependence or distortion of the spectrum of the solar neutrino flux has been seen; the zenith angle spectrum is consistent with flat. In particular, the day–night asymmetry is (stat)(syst). The absence of zenith angle dependence and spectral distortion strongly constrains two-neutrino oscillations. From the six solution areas based on the rates of Homestake, GALLEX/GNO, SAGE and SK — active VAC, active SMA, active LOW, active LMA, sterile VAC and sterile SMA — all but active LMA are disfavored by the shape of the zenith angle spectrum at about 95% confidence level. Using only SK data (zenith angle spectrum shape and SK rate), two allowed areas (95% confidence level) at large mixing are found for the active as well as the sterile case: –eV2 or eVeV2.
Acknowledgments
The authors acknowledge the cooperation of the Kamioka Mining and Smelting Company. The Super-Kamiokande detector has been built and operated from funding by the Japanese Ministry of Education, Culture, Sports, Science and Technology, the U.S. Department of Energy, and the U.S. National Science Foundation. This work was partially supported by the Korean Research Foundation (BK21) and the Korea Ministry of Science and Technology.
References
References
- [1] B. T. Cleveland et al., Astrophys. J. 496, 505 (1998).
- [2] Y. Fukuda et al., Phys. Rev. Lett. 77, 1683 (1996).
- [3] E. Bellotti, Nucl. Phys. B(Proc. Suppl.) 91, 44 (2001); W. Hampel et al., Phys. Rev. Lett. 388, 364 (1996); P. Anselmann et al., Phys. Lett. B 342, 440 (1995).
- [4] V.Gavrin, Nucl. Phys. B(Proc. Suppl.) 91, 36 (2001); J.N.Abdurashitov et al., Phys. Lett. B 328, 234 (1994).
- [5] S. Fukuda et al., Phys. Rev. Lett. 86, 5651 (2001).
- [6] J. N. Bahcall et al., astro-ph/0010346. The 8B flux we have used is cm-2 s-1 to be consistent with . In this reference the 8B flux has been updated to cm-2 s-1. This update does not change our conclusions.
- [7] Y. Fukuda et al., Phys. Rev. Lett. 81, 1562 (1998).
- [8] S. P. Mikheyev and A. Y. Smirnov, Sov. Jour. Nucl. Phys. 42, 913 (1985); L. Wolfenstein, Phys. Rev. D 17, 2369 (1978).
- [9] see for example A. J. Baltz and J. Weneser, Phys. Rev. D 50, 5971 (1994) Q. Y. Liu, M. Maris, S. T. Petcov, Phys. Rev. D 56, 5991 (1997) M. C. Gonzalez-Garcia, C. Peña-Garay, A. Yu. Smirnov, Phys. Rev. D 63, 113004 (2001)
- [10] S. Fukuda et al., Phys. Rev. Lett. 86, 5656 (2001).