Matter Effects in Upward-Going Muons and Sterile Neutrino Oscillations
Abstract
The angular distribution of upward-going muons
produced by atmospheric neutrinos in the rock
below the MACRO detector show anomalies in good
agreement with two flavor
oscillations with maximum mixing and around
.
Exploiting the dependence of magnitude of the matter effect on
oscillation channel, and using a set of 809 upward-going muons observed
in MACRO, we show that the two flavor oscillation
is disfavored with 99% C.L. with respect to .
PACS 14.60Pq; 14.60Lm
1 INTRODUCTION
00footnotetext: Also Università della Basilicata, 85100 Potenza, Italy -Also INFN Milano, 20133 Milano, Italy
Also Istituto TESRE/CNR, 40129 Bologna, Italy
Also Scuola Normale Superiore di Pisa, 56010 Pisa, Italy
Also Università di Trieste and INFN, 34100 Trieste, Italy
Also Dip. di Energetica, Università di Roma, 00185 Roma, Italy
Also Institute for Nuclear Research, Russian Academy of Science, 117312 Moscow, Russia
Also Institute for Space Sciences, 76900 Bucharest, Romania
The Colorado College, Colorado Springs, CO 80903, USA
Also Dept. of Physics, Pennsylvania State University, University Park, PA 16801, USA
Also Dipartimento di Fisica dell’Università della Calabria, Rende (Cs), It aly
Also Dipartimento di Scienze e Tecnologie Avanzate, Università del Piemonte Orientale, Alessandria, Italy
Also U. Minn. Duluth Physics Dept., Duluth, MN 55812
Also Dept. of Physics, MIT, Cambridge, MA 02139
Also Intervideo Inc., Torrance CA 90505 USA
Also Resonance Photonics, Markham, Ontario, Canada
Corresponding author E-mail: ronga@lnf.infn.it
Neutrino oscillations[1] were first suggested by B. Pontecorvo in 1957 after the discovery of the transitions. Subsequently, evidence for the existance of neutrino oscillation in nature has been provided by the Superkamiokande, Soudan2 and MACRO experiments, each of which has presented data which strongly favor atmospheric neutrino oscillations, in the form of disappearance [3].
The two neutrino oscillation probability in vacuum is given by:
| (1) |
where , is the mixing angle and L is the path length between the neutrino production point and the location at which the neutrino flavor is measured. This simple relation should be modified when a neutrino propagates through matter and when there is a difference in the interactions of the two neutrino flavors with matter [2]. The neutrino weak potential in matter is:
| (2) |
where the upper sign refers to neutrinos, the lower sign to antineutrinos, is the Fermi constant, the baryon density, the neutron and the electron number per baryon (both about 1/2 in common matter). The weak potential in matter produces a phase shift that will modify the neutrino oscillation probability if the oscillating neutrinos have different interactions with matter. Therefore, the matter effect could help to discriminate between different neutrino oscillation channels. According to equation, ( 2) matter effects in the Earth could be important for and for the oscillations, while for oscillations there is no matter effect. For particular values of the oscillation parameters the matter effect increases the oscillation probability, leading to ’resonances’ (e.g., the MSW effect).
oscillations have been suggested [6] to explain some features of the atmospheric neutrino anomaly. Under most current models, a fourth (sterile) neutrino is necessary to explain all the reported neutrino anomalies (solar, atmospheric and LSND [7] ). Matter effects are important [6] when GeV/eV2, therefore in particular for high energy events. The primary purpose of this letter is to compare the MACRO high energy neutrino events sample with the predictions, considering matter effects in the case of oscillations. In MACRO, neutrino oscillation is observed in three different event topologies, having different characteristic ranges of parent neutrino energies. So-called events [4] are associated with muons which penetrate the entire detector. The parent neutrinos in these events have a median neutrino energy around 50 GeV. events and events, together with events, [5] are associated with muons having a track terminus located within the MACRO detector. The parent neutrinos in these events have a significantly lower median energy, of around 4 GeV. In this paper, we focus on the high energy ( ) data sample. A similar analysis has been recently published by the Superkamiokande collaboration [8].
2 DATA ANALYSIS
The MACRO detector [9]. is located in the Hall B of the Gran Sasso Laboratory, with a minimum rock overburden of 3150 hg/cm2. It is in the general form of a large rectangular box, 76.6 m 12 m 9.3 m, divided longitudinally into six supermodules, and vertically into a lower part (4.8 m high) and an upper part (4.5 m high). The active detection elements are planes of streamer tubes for tracking and of liquid scintillators for fast timing. The lower half of the detector is filled with trays of crushed rock absorbers alternating with streamer tube planes, while the upper part is open and contains electronics racks and work areas.

The muon tracks we focus on in this study come from interactions in the rock below MACRO. In these events, the muon crosses the entire detector requiring that GeV. The time information provided by the scintillator counters determines the flight direction of the muon, allowing events to be distinguished from the much more common down-going muons. The measured muon velocity is calculated with the convention that down going muons have =velocity/c=+1 while up going muons have . In the event sample, almost 50% of the tracks intercept 3 scintillators planes. In this case, there is redundancy in the time measurement, and is calculated from a linear fit of the times as a function of the path length. Tracks with a poor fit are rejected. Upward going muons are selected by requiring that the measured velocity lie in the range 1/ .
The data used in this study have been collected in three periods, with different detector configurations, starting in 1989. The statistics is largely dominated by the full detector run, started in May 1994 and ended in December 2000 (live time 5.51 years). The total live time, normalized to the full detector configuration, is 6.17 years.
Several cuts are imposed on the data to remove backgrounds caused by radioactivity or showering events which may result in bad time reconstruction. The primary data selection in this regard requires that the position of a muon hit in each scintillator, as determined from the timing within the scintillator counter, agrees within 70 cm with the position indicated by the streamer tube track. This eliminates events with significant errors in timing. In addition, downgoing muons which pass near or through MACRO may produce low-energy, upgoing particles, which could appear to be neutrino-induced upward throughgoing muons if the down-going muon misses the detector [10]. In order to reduce this background, we impose a cut requiring that each upgoing muon must cross at least 200 g/cm2 of material in the bottom half of the detector. Finally, a large number of nearly horizontal (), but upgoing muons have been observed coming from azimuth angles (in local coordinates) from -30∘ to 120∘. In this direction the overburden is insufficient to remove nearly horizontal, downgoing muons which have scattered in the mountain and appear as upgoing. We exclude this region from our data.

After applying the data selections described in the previous paragraph, we observe 863 events with measured velocities in the range . Based on events outside the upgoing muon peak, we estimate that there are background events in this data sample. In addition , we estimate that there are events which result from upgoing charged particles produced by downgoing muons in the rock near MACRO. Finally, it is estimated that events are the result of interactions of neutrinos in the bottom layer of MACRO scintillators. After subtracting these backgrounds to the data set, the number of upgoing throughgoing muons integrated over all zenith angles is 809.

In the simulation of our upgoing muon data, we have used the neutrino flux computed by the Bartol group [11], and the GRV94 [12] parton distribution set, which increases the upgoing muon flux by +1% with respect to the S1 [13] parton distribution that we have used in the past. For low energy channels (quasi-elastic and 1 pion production) we have used the cross section in [14]. The propagation of muons to the detector has been done using the energy loss calculation by Lohmann et al. [15] for standard rock. The total systematic uncertainty in the predicted flux of upgoing muons, adding in quadrature the errors from the Bartol neutrino flux, the neutrino cross-section, and muon propagation, is estimated to be . This theoretical error in the predicted flux is mainly a scale error that does not change the shape of the angular distribution. Assuming no oscillations, the number of expected events integrated over all zenith angles is 1122, giving a ratio of the observed number of events to the expectation of 0.72 (stat) (systematic) (theoretical).
Figure 1 shows the zenith angle distribution of the measured flux of upgoing muons with energy greater than 1 GeV for our full upgoing data sample, compared to the Monte Carlo expectation for no oscillations, and with a oscillated flux with maximum mixing and eV2. The shape of the angular distribution has been tested with the hypothesis of no oscillations, normalizing the total predicted flux to that observed. The is for 9 degrees of freedom (P=0.2%). Under the hypothesis of oscillation, the best is 7.1 and is outside the physical region. The best in the physical region of the oscillation parameters is 9.7 (P=37%) for of and maximum mixing. Combining information from the angular distribution and the total number of events according to the procedure described in [16],we obtain a peak probability of 66% for oscillations with of and maximum mixing, while the probability for no oscillations is 0.2%.
The confidence level regions of the MACRO upgoing events are shown in Figure 2. The limits are computed using the Feldman-Cousins procedure[17]. Figure 2 shows the results obtained using the angular distribution alone, and the angular distribution together with the information due to the overall normalization. The confidence level regions are smaller than the regions obtained by SuperKamiokande [18] and Kamiokande [19] for the upgoing muon events. This can be accounted for through the following effects: the different energy threshold (Superkamiokande has an average energy threshold of about 7 GeV, MACRO has 1.5 GeV), the use of the Feldman-Cousins procedure, and the fact that our best point is outside the physical region.
3 TWO FLAVORS STERILE NEUTRINO OSCILLATIONS AND TAU NEUTRINO OSCILLATIONS
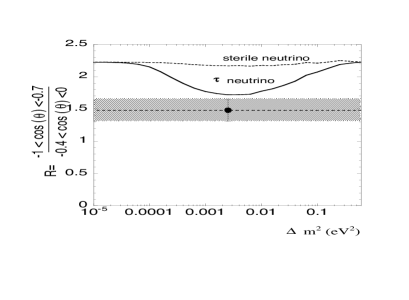
In the oscillation scenario, the matter effect changes the shape of the angular distribution and the total number of events with respect to vacuum oscillations. Large matter effects are expected for neutrinos near vertical incidence, due to the large neutrino path length in this case, and to the increase in the density of the Earth near its core. Assuming maximal mixing, as suggested by all available data, the matter effect produces a reduction of the oscillation effect, and results in an upgoing muon flux closer to that predicted by the no oscillation scenario. This effect would be most pronounced for directions near the vertical [6]. Figure 3 shows the reduction with respect to no oscillations for maximal mixing for and oscillations, with and . We have tested the shape of the observed upgoing muon angular distribution against the hypothesis of oscillations with maximum mixing. The best is with 9 degrees of freedom. Combining the information obtained from the angular distribution and the normalization the highest probability obtained is 8% for maximum mixing and . A statistically more powerful test is based on the ratio between the number of events in the two angular regions and as shown in Figure 4. This quantity is statistically more powerful than the in 10 bins because data are binned to maximize the difference between the two hypotheses to be tested and because the ratio is sensitive to the sign of the variation (while the is not). In addition, this ratio is insensitive to most of the errors in the theoretical prediction of the flux and cross section. The primary disadvantage of this statistic is the loss of some features of the angular distribution. We have chosen slightly different angular regions than suggested in the original proposal for this statistic, presented in ref [20]. In our study, the angular regions used are based on a Montecarlo study of the intervals providing the maximum discrimination between the and the oscillation hypotheses.
The ratio of the flux of upgoing muons in two angular intervals is insensitive to uncertainties in the overall flux and cross section, as pointed out in the last paragraph. Several effects do, however, lead to systematic errors in this ratio. For example, uncertainties in the , fraction in atmospheric air showers, and the different angular distributions of neutrinos produced by these parents, leads to approximately a 3% systematic error[21] in the predicted value for this ratio. Another theoretical error, at the level of approximately for MACRO, results from uncertainties in the neutrino cross sections, and the different energy distributions of neutrinos arriving from the horizontal and vertical directions. A final source of systematic error in the prediction of the flux ratio results from the seasonal variations of the atmosphere’s density profile, and the fact that the neutrino flux is computed for the standard United States atmosphere [11] not taking into account variations of the density profile with latitude. Seasonal variation of the high energy muon flux has been observed by MACRO[22] at North latitude, where a difference was observed between summer and winter. At more extreme latitudes, Amanda[23], which operates near the South Pole, observes a difference between winter and summer. A precise estimate of the seasonal variation of the high energy neutrino flux is rather difficult to obtain because it requires knowing the density profile of the atmosphere over the entire Earth. We have performed a simplified estimate of the size of this effect based on an analytic neutrino flux calculation [24] and the CIRA-86 atmosphere tables [25]. According to this calculation the amplitude of the seasonal variations of the ratio of the vertical to horizontal neutrino flux is of the order of . Assuming a sinusoidal variation during the year, this amplitude corresponds to a root mean square value of about . Dividing the MACRO data into a winter set (including the months from November up to April) and a summer set (the remaining months), we observe a difference in the ratio of the flux in the two angular bins of between the two data sets, with a smaller value in the summer as expected for the seasonal variation, compatible inside the large errors with the expectations. We include in our estimate of the total systematical error in the predicted flux ratio a contribution due to seasonal variations. The systematic error due to the fact that the neutrino flux is calculated using the standard United States atmosphere has been estimated to be less than 1%. Accounting for all contributions to the systematic error, we estimate that the total uncertainty in the predicted value for the flux ratio is 4%.
The total systematic error in the measured value of the flux ratio has been estimated to be 4.6%. This error is due to uncertainties in the efficiency of the analysis cuts and detector efficiencies; it could be reduced in the future with a reprocessing of the data to correct for the change of the apparatus operating conditions with time. Combining in quadrature the theoretical error and the experimental error we obtain a total error in the ratio of about 6%.
In the full upgoing muon data set, there are 305 events with , and 206 events with , giving a value for the flux ratio of . This measured value can be compared with =1.72 and =2.16, which are the minimum possible values of for and oscillations respectively, for maximum mixing and of . For values of the value of R is larger than both for and . We note that this ratio does not have a gaussian distribution - the errors are reported only to give a crude estimate of the statistical significance. The corresponding one sided probability of measuring a value smaller than , assuming a true value for the ratio of , is . For the probability is 0.033%. The ratio of the probabilities / is 254. This implies that oscillation (with any mixing) is excluded at about 99% C.L. compared with oscillation with maximum mixing. In calculating these confidence limits we have considered correctly the non gaussian distribution of the ratio.
Additional information could be derived from the total number of events, at the expense of larger theoretical uncertainties. For the best value of for sterile neutrino oscillation we expect a flux reduction of for and , to be compared with the measured value 0.72. However, due to the large theoretical uncertainty, the total number of events was not used in the statistical analysis presented here.
It should be noted that this analysis has been carried out for the two neutrino mixing case. A more complicated oscillation scenario, with 3 or more neutrinos[26], or the scenario with large extra dimensions [27] cannot be excluded.
In conclusion, using the improved statistics afforded by the full MACRO data set, the test of the shape of the angular distribution of upgoing muons is in good agreement with oscillation, and maximal mixing. The best is for 9 degrees of freedom. Based on the ratio test, the oscillation hypothesis has a 0.033% probability of agreeing with the data, and is disfavored at more than 99% C.L.with respect to the best fit point of oscillation.
We thank T. Kaijta for useful discussions to compare our data to those of Superkamiokande. We acknowledge the staff of the Laboratori Nazionali del Gran Sasso and the invaluable assistance of the technical staffs of all the participating Institutions. For generous financial contributions we thank the U.S. Department of Energy, the National Science Foundation, and the Italian Istituto Nazionale di Fisica Nucleare: both for direct support and for FAI grants awarded to non-Italian MACRO collaborators.
References
- [1] B. Pontecorvo J.Exptl. Theoret. Phys. 33, 549 (1957), Z. Maki, M. Nakagava and S. Sakata, Prog. Theor. Phys. 28, 870 (1962), for an historical review see S. M. Bilenki hep-ph/ 9908335 (1999).
- [2] L. Wolfenstein Phys. Rev. D17:2369 (1978); Phys. Rev D20:2634 (1979), S. P. Mikheyev, A. Y. Smirnov Sov. J. Nucl. Phys. 42:913 (1985), Sov. Phys. -JETP64:4 (1986), Nuovo Cimento 9C:17 (1986)
- [3] F. Ronga et al. (MACRO Collaboration), Nucl.Phys.Proc.Suppl. 77 117,(1999). E. Peterson (Soudan-2 Collaboration), Nucl. Phys. Proc. Suppl. 77, 111 (1999), T. Kajita (Super-Kamiokande Collaboration), Nucl. Phys. Proc. Suppl. 77, 123 (1999),
- [4] S. Ahlen et al. [MACRO Collaboration], Phys. Lett. B357 (1995) 481, M. Ambrosio et al. (MACRO Collab.), Phys. Lett. 434, 451 (1998).
- [5] M. Ambrosio et al. [MACRO Collaboration], Phys. Lett. 478 (2000) 5.
- [6] E. Akhmedov, P. Lipari, and M. Lusignoli, Phys. Lett. B 300, 128 (1993); F. Vissani and A.Y. Smirnov, Phys. Lett. B432, 376 (1998); Q.Y. Liu and A.Y. Smirnov, Nucl. Phys. B524, 505 (1998); P. Lipari and M. Lusignoli, Phys. Rev. D58, 073005 (1998)
- [7] G. B. Mills [LSND Collaboration], Nucl. Phys. Proc. Suppl. 91, 198 (2001).
- [8] S. Fukuda et al. [Super-Kamiokande Collaboration], Phys. Rev. Lett. 85 (2000) 3999
- [9] S. P. Ahlen et al. [MACRO Collaboration], Nucl. Instrum. Meth. A324, 337 (1993).
- [10] M. Ambrosio, , et al. (MACRO collabor.) Astroparticle Physics 9 (1998) 105.
- [11] V. Agrawal, T.K. Gaisser, P. Lipari, and T. Stanev, Phys. Rev. D53 (1996) 1314.
- [12] M. Glück ,E. Reya and A. Vogt Z. Phys. C67, 433 (1995)
- [13] J. G. Morfin and W. K. Tung , Z. Phys. C52 (1991) 13.
- [14] P. Lipari, M. Lusignoli and F. Sartogo, Phys. Rev. Lett. 74, 4384 (1995)
- [15] W. Lohmann et al., CERN-EP/85-03 (1985).
- [16] B. Roe Probability and Statistics in Experimental Physics pag 128. Springer (1992)
- [17] G.J. Feldman and R.D. Cousins, Phys. Rev. D 57 (1998) 3873.
- [18] Y. Fukuda et al. [SuperKamiokande Collaboration], Phys. Rev. Lett. 82 (1999) 2644
- [19] S. Hatakeyama et al. [Kamiokande Collaboration], Phys. Rev. Lett. 81, 2016 (1998)
- [20] P. Lipari and M. Lusignoli, Phys. Rev. D57, 3842 (1998)
- [21] P. Lipari, Nucl. Phys. Proc. Suppl. 91, 159 (2001).
- [22] M. Ambrosio et al. [MACRO Collaboration], Astropart. Phys. 7, 109 (1997).
- [23] A. Bouchta [AMANDA Collaboration], 26th International Cosmic Ray Conference (ICRC 99), Salt Lake City, UT, 17-25 Aug 1999.
- [24] P. Lipari, Astropart. Phys. 1, 195 (1993).
- [25] CIRA 1986, D. Rees (ed.), Advances in Space Research, Volume 8, Number 5-6, 1988
- [26] G. L. Fogli, E. Lisi and A. Marrone, Phys. Rev. D 63 (2001) 053008
- [27] R. Barbieri, P. Creminelli and A. Strumia, Nucl. Phys. B 585 (2000) 28