M12 R Measurements at High
Abstract
Previous measurements of at high are reviewed. Recent measurement results, including those from the Beijing Spectrometer Experiment, are described. The present status of measurements and future measurement possibilities are summarized.
1 Introduction
The QED running coupling constant evaluated at the pole, , and the anomalous magnetic moment of the muon, , are two fundamental quantities that are used to test the Standard Model (SM). The dominant uncertainties in both and are due to the effects of hadronic vacuum polarization, which cannot be reliably calculated in the low energy region. Instead, with the application of dispersion relations, experimentally measured values are used to determine the vacuum polarization, where is the lowest order cross section for in units of the lowest-order QED cross section for , namely , where . Improved precision for also narrows the allowed range of the Higgs mass prediction using electro weak loop corrections. For much more detail on the importance of measurements, see references [1, 2, 3].
The uncertainty in is introduced when it is extrapolated to the -pole.
where is the fine structure constant, which is known very precisely, and is the vacuum polarization term.
The leptonic vacuum polarization, , can be calculated theoretically, and the top contribution, is absorbed as a parameter in the SM fit. The dominant uncertainty is then due to the effects of hadronic vacuum polarization, , which is calculated with experimentally determined values using dispersion relations.
Here, measurements above the center-of-mass (cm) energy corresponding to the are reviewed. measurements at lower energy are described in ref. [3, 4]. Since the theoretical is more dependent on low energy than on high energy values, we will concern ourselves here primarily with the effect of measurements on . In the following sections, previous measurements will be summarized, recent measurements by the Beijing Spectrometer Experiment (BES) and CLEO will be described, and the current status will be reviewed.
2 Previous Measurements
Figure 1 shows the summary of measurements as summarized by the Particle Data Group [5]. These are selected measurements; older measurements with even larger errors are not shown. Also systematic normalization errors (5 - 20 %) are not included on the points shown.
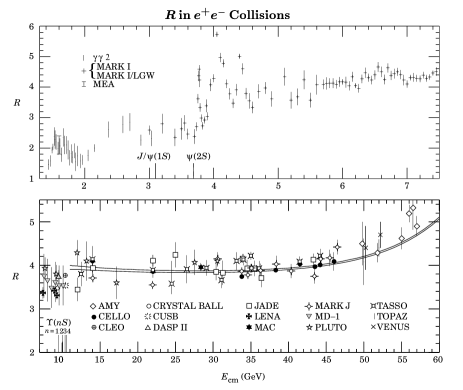
We will be primarily interested in the center of mass (cm) energy region GeV. For higher energies, perturbative QCD (PQCD) can be used to describe the behavior of as a function of energy [6]. Analyses that use data below GeV are “data driven” approaches [6]; “theory driven” approaches use PQCD to go much lower in energy [8]. Although less dependent on the quality of experimental data, the latter must make additional theoretical assumptions.
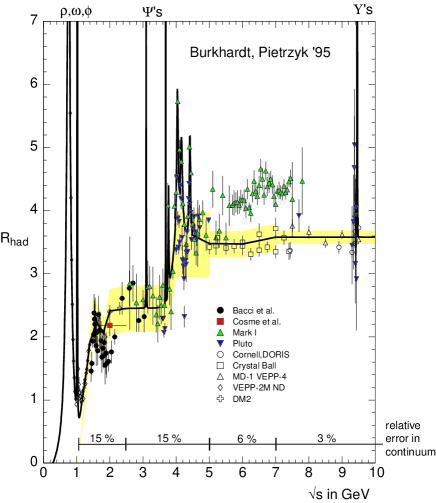
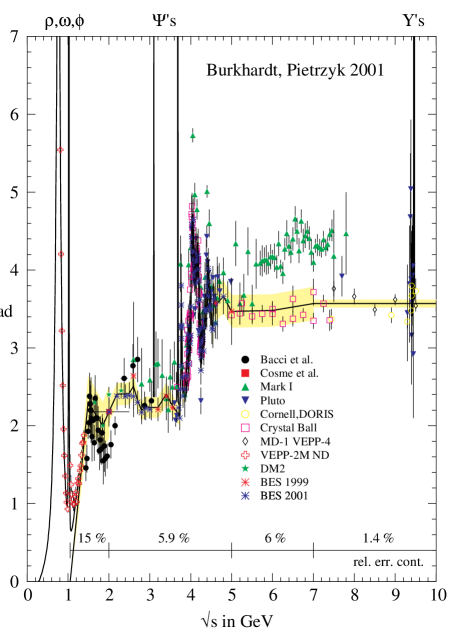
Figure 2 shows a 1995 summary plot of the cm energy region below 10 GeV [9]. The values used as a function of energy to evaluate the dispersion integral are indicated by the smooth line through the points, and the value uncertainties ascribed in the various energy regions are indicated by the bands. In the 1 to 5 GeV region, the uncertainty is taken to be 15 %. Note that the Crystal Ball data [7] used in the 5 to 7 GeV region is unpublished.
3 BES Measurement
Recently a detailed scan was completed by the upgraded Beijing Spectrometer (BES-II) Experiment [10]. The analysis is described in some detail here to demonstrate the complexity of measurements. BESII is a general purpose solenoidal detector located at the Beijing Electron Positron Collider (BEPC), which is the only facility operating in the CM energy range from 2 to 5 GeV. The luminosity at the is cm-2s-1. BESII is described in detail elsewhere [11].
Experimentally, the value of is determined from the number of observed hadronic events, , by the relation
| (1) |
where is the number of beam-associated background events; are the numbers of lepton-pair events from one-photon processes and the number of two-photon process events that are misidentified as hadronic events; is the integrated luminosity; is the radiative correction; is the detection efficiency for hadronic events; and is the trigger efficiency.
In 1998 BES performed an initial measurement of using six scan points: 2.6, 3.2, 3.4, 3.55, 4.6, and 5.0 GeV [12]. At each point separated beam runs were done for the study of beam gas background. In 1999, BES measured 85 scan points with hadronic events per point. Separated beam running was done at 24 energy points, while single beam running was done at 7 points [10].
3.1 Event Selection
The main sources of background for this measurement are cosmic rays, lepton pair production, two-photon processes and single-beam associated processes. Clear Bhabha events are first rejected. Then the hadronic events are selected based on charged track information. Special attention is paid to two-prong events, where cosmic ray and lepton pair backgrounds are especially severe, and additional requirements are imposed to provide extra background rejection [12].
An acceptable charged track must be in the polar angle region , have a good helix fit, and not be clearly identified as an electron or muon. The distance of closest approach to the beam axis must be less than 2 cm in the transverse plane, and must occur at a point along the beam axis for which cm. In addition, the following criteria must be satisfied: (i) , where and are the track and incident beam momenta, respectively, and is the momentum uncertainty for a charged track for which ; (ii) , where is the barrel shower counter (BSC) energy associated with the track, and is the beam energy; (iii) (in ns.), where is the measured time-of-flight for the track, is the time-of-flight calculated assigning the proton mass to the track, and is the resolution of the barrel time-of-flight system.
After track selection, event selection requires the presence of at least two charged tracks, of which at least one satisfies all of the criteria listed above. In addition, the total energy deposited in the BSC () must be greater than , and the selected tracks must not all point into the forward () or the backward () hemisphere.
For two-prong events, residual cosmic ray and lepton pair ( and ) backgrounds are removed by requiring that the tracks not be back-to-back, and that there be at least two isolated energy clusters in the BSC with MeV that are at least 15∘ in azimuth from the closest charged track. This last requirement rejects radiative Bhabha events.
These requirements eliminate virtually all cosmic rays and most of the lepton pair ( and ) events. The remaining background contributions due to lepton pairs (), including production above threshold, and two-photon events () are estimated using Monte Carlo simulations and subtracted as indicated in Eq. (1).
Cuts used for selecting hadronic events were varied in a wide range, e.g. from 0.75 to 0.90, from 0.24 to 0.32, to estimate the systematic error arising from the event selection, which turned out to be the dominant systematic error as indicated in Table 2.
3.2 Beam Associated Background
The largest background is due to beam associated background, . To determine the level of single-beam-induced backgrounds, the same hadronic event selection criteria are applied to separated-beam data, and the number of separated-beam events, , surviving these criteria is obtained. The number of beam-associated background events, , in the corresponding hadronic event sample is given by , where is the ratio of the products of the pressure at the collision region and the integrated beam current for colliding and separated-beam runs.
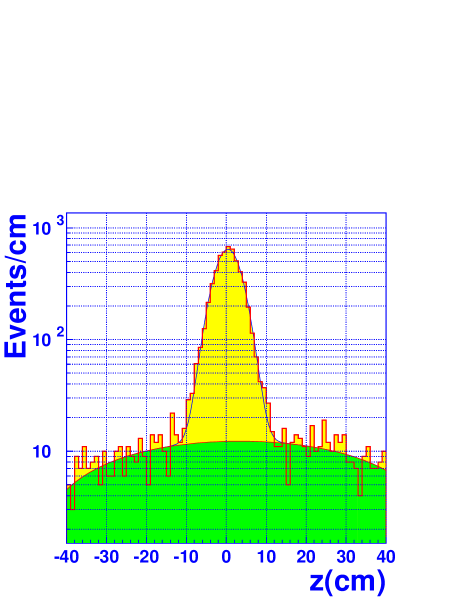
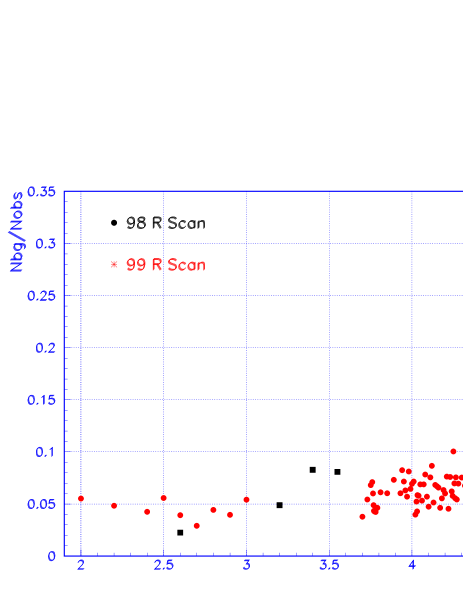
The beam-associated background can also be determined by fitting the distribution of event vertices along the beam direction with a Gaussian for real hadronic events and a polynomial of degree two for the background, as shown in Fig. 3. This was the primary method used for the ’99 data. Figure 4 shows the amount of beam associated background versus the scan energy. The differences between values obtained using these two methods to determine the beam-associated background range between 0.3 and 2.3%, depending on the energy. These differences are included in the systematic uncertainty.
3.3 Hadron Efficiency
JETSET, the Monte Carlo event generator that is commonly used to simulate , was not intended to be applicable to the low energy region, especially that below 3 GeV. A special joint effort was made by the Lund group and the BES collaboration to develop the LUARLW generator, which uses a formalism based on the Lund Model Area Law, but without the extreme-high-energy approximations used in JETSET’s string fragmentation algorithm [13, 14]. The final states simulated in LUARLW are exclusive in contrast to JETSET, where they are inclusive. In addition, LUARLW uses fewer free parameters in the fragmentation function than JETSET. Above 3.77 GeV, the production of and is included in the generator according to the Eichten Model [15].
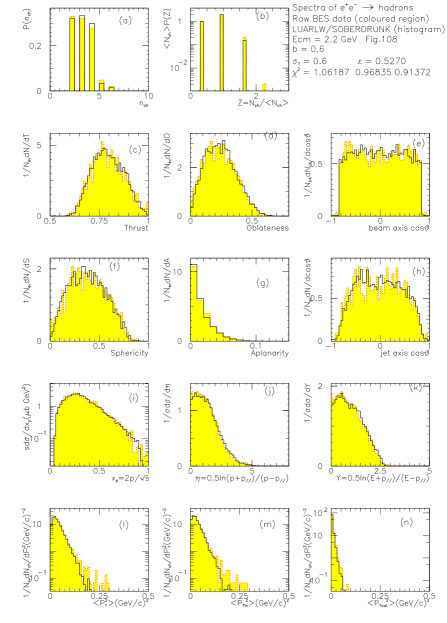
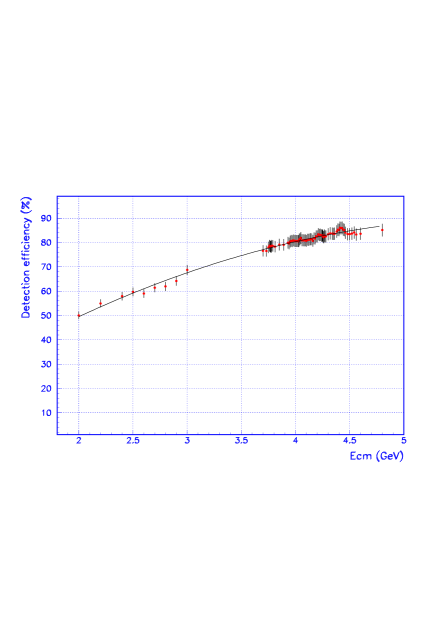
The parameters in LUARLW are tuned to reproduce 14 distributions of kinematic variables over the entire energy region covered by the scan [14, 16]. For example, the fits for parameters tuned at GeV are shown in Fig. 5. We find that one set of parameter values is required for the CM energy region below open charm threshold, and that a second set is required for higher energies. In an alternative approach, the parameter values were tuned point-by-point throughout the entire energy range. The detection efficiencies determined using individually tuned parameters are consistent with those determined with globally tuned parameters to within 2%. This difference is included in the systematic errors. The detection efficiencies were also determined using JETSET74 for the energies above 3 GeV. The difference between the JETSET74 and LUARLW results is about 1%, and is also taken into account in estimating the systematic uncertainty. Figure 6 (a) shows the variation of the detection efficiency as a function of CM energy.
3.4 Radiative Corrections:
The term is necessary to remove high order effects from
Different schemes for the radiative corrections were compared [17, 18, 19, 20], as reported in Ref. [12]. Below charm threshold, the four different schemes agree with each other to within 1%, while above charm threshold, where resonances are important, the agreement is within 1 to 3%. The radiative correction used in this analysis is based on Ref. [20], and the differences with the other schemes are included in the systematic error.
3.5 Luminosity Measurement
The integrated luminosity is determined from
using Bhabha events. The results obtained using and dimu events were consistent. The luminosity systematic error includes contributions from cut variations, background uncertainties, the cross section uncertainty, and the efficiency uncertainty. The luminosity systematic errors at some selected scan energies are shown in Table 2.
3.6 Trigger Efficiency
The trigger efficiency was measured by comparing different trigger configurations in special runs at the .
The error on the efficiencies is 0.5 %.
3.7 BES Results
| Stat. | Sys. | |||||||
|---|---|---|---|---|---|---|---|---|
| (GeV) | (nb | (%) | error | error | ||||
| 2.000 | 1155.4 | 19.5 | 47.3 | 49.50 | 1.024 | 2.18 | 0.07 | 0.18 |
| 3.000 | 2055.4 | 24.3 | 135.9 | 67.55 | 1.038 | 2.21 | 0.05 | 0.11 |
| 4.000 | 768.7 | 58.0 | 48.9 | 80.34 | 1.055 | 3.16 | 0.14 | 0.15 |
| 4.800 | 1215.3 | 92.6 | 84.4 | 86.79 | 1.113 | 3.66 | 0.14 | 0.19 |
| (GeV) | Had. sel. | Had. eff. | Trig. | Rad. corr. | tot. | |
|---|---|---|---|---|---|---|
| 2.000 | 7.07 | 2.81 | 2.62 | 0.5 | 1.06 | 8.13 |
| 3.000 | 3.30 | 2.30 | 2.66 | 0.5 | 1.32 | 5.02 |
| 4.000 | 2.64 | 2.43 | 2.25 | 0.5 | 1.82 | 4.64 |
| 4.800 | 3.58 | 1.74 | 3.05 | 0.5 | 1.02 | 5.14 |
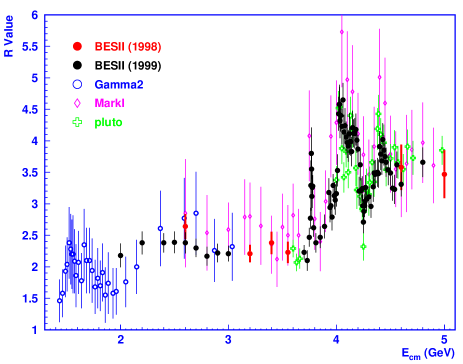
The BES measurement results [12, 21] are shown in Fig. 7 along with the results from , Mark I, and Pluto [22, 23, 24]. Systematic uncertainties are between 6 and 10 % and are less than half of the previous uncertainties. The average uncertainty is 6.6 %. Tables 1 and 2 list some of the values used in the determination of and the contributions to the uncertainty in the value of at a few typical energy points in the scanned energy range, respectively.
4 Recent CLEO Measurement
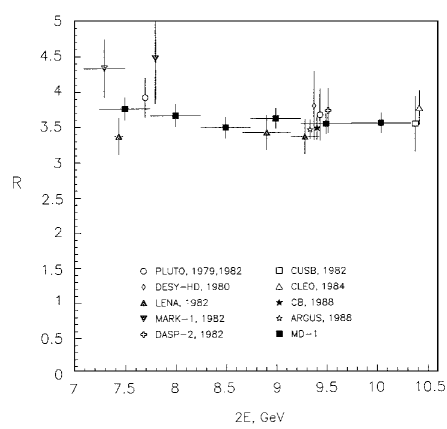
The CLEO experiment measured at GeV, just below the , and obtained [25]. This very precise measurement (2 %) obtained an error similar to that of all previous results in this energy region combined, , corresponding to a 1.8 % error [26]. Fig. 8 shows the measurements in this region prior to CLEO [26].
The CLEO error is smaller than that obtained by BES. A breakdown of the error components is given in Table 3, along with the corresponding errors at 3.0 GeV from BES. Why does CLEO do better? CLEO has much better solid angle coverage and a higher detection efficiency, as well as a state of the art detector. They also ran with a higher luminosity, 1.521 0.015) fb-1, and obtained 4 million events. With a much bigger sample, both statistical and systematic errors are reduced.
5 Current Status of Measurements
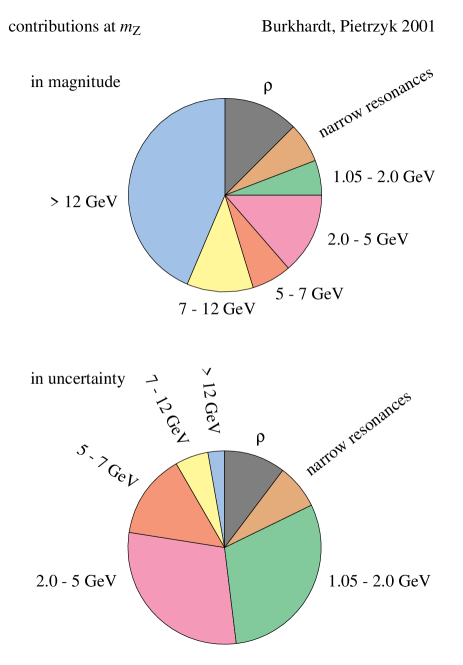
Burkhardt and Pietrzyk have updated their analysis from 1995 [9] with new results from CMD-2, CLEO, BES, and 3rd order QCD for GeV [6]. They find , and . In 1995, . The improved experimental accuracy is primarily due to BES [6]. Fig. 9 shows their current summary of measurements below 10 GeV. The error in the 2 to 5 GeV region is greatly reduced because of the BES measurements. Figure 10 shows the breakdown of the error in by energy region. The biggest error contribution to still comes from the GeV region!
| Source | BES (%) | CLEO |
|---|---|---|
| Error (%) | Error (%) | |
| 3.3 | – | |
| Backgd./Ev. Modeling | – | 0.7 |
| 2.3 | 1.0 | |
| 1.3 | – | |
| 2.7 | – | |
| – | 1.0 | |
| Sys. | 5.0 | 1.8 |
| Stat. | 2.5 | 0.3 |
| Total | 5.6 | 2.0 |
Future Measurements
J. H. Kühn has used the new BES results to test PQCD, but calls for even better precision (2 %) [2]. Certainly, the precision of in the 1 - 2 GeV cm region must be improved. This is extremely important to improve the precision of both and . The KLOE and PEP-N experiments are candidates for measuring in this region.
As shown in Fig. 10, the 2 - 5 GeV region is also very important in the determination of . The candidates for measurements in this region are BES, PEP-N, and CLEO-C. Also improved measurements in this region are important to clarify the structure in the charm resonance region. The B Factories may also contribute to both energy regions using ISR events [27, 28].
The 5 -7 GeV region is also very important. As shown in Fig. 9, the values used by theorists in this region are the unpublished Crystal Ball values [7]. CLEO-C could measure points in this region.
What is needed to improve value precision?
-
1.
High luminosity large sample
-
2.
Good solid angle coverage
-
3.
Excellent detector with good particle identification
-
4.
Radiative correction to better than 1 %
-
5.
More effort on the event generator (LUARLW)
-
6.
Large sample for tuning the generator
-
7.
Measure exclusive channels at low energy
6 Energy reach of PEP-N
Although very difficult, extending the energy range to above the mass of the should be considered. Currently the world’s largest sample ( 4 M events) is that of the BES experiment. Some very good physics becomes accessible in this region. production at threshold can be measured to improve the precision of the mass. Approximately one quarter of decays are to and . Running on the is a good place to do and physics, as well as to study hadronic decays. The study of the hadronic decays might provide a solution to the well known puzzle [29]. Being able to compare and decays is also very beneficial in understanding the final states in these decays. Finally it will be very useful to have some overlap between PEP-N and CLEO-C as a check of systematics in measuring in this region.
7 Summary
Although the precision of measurements has improved, better precision is still needed to improve the precision of the theoretical standard model values of and and to test PQCD. There are many interesting possibilities for future improvements of values from KLOE, PEP-N, and CLEO-C, as well from the B factories using ISR events.
8 Acknowledgements
I would like to thank the organizers of the Physics at Intermediate Energies Workshop for their hospitality. I also want to thank Bolek Pietrzyk for many of the plots used in this paper and my friend and collaborator Zhengguo Zhao, who is the leader of the R-Group, for his help on this paper. I also want to acknowledge the efforts of the BES R-group, the Computing Group at IHEP, the BEPC staff, and the members of the BES collaboration.
References
- [1] W. Marciano, “General Talk on Hadronic Corrections in the SM”, The Physics at Intermediate Energies Workshop, M06.
- [2] J. H. Kühn, “Hadronic Corrections to and , Theory and Experimental Data”, The Physics at Intermediate Energies Workshop, M08.
- [3] S. Eidelman, “Status of CVC Tests from Electron-Positron Annihilation and Decay”, The Physics at Intermediate Energies Workshop, M07.
- [4] Z. Zhengguo, “Results and Future Plans from BEPC”, The Physics at Intermediate Energies Workshop, M10.
- [5] Particle Data Group, D.E. Groom et al., Eur. Phys. J. C15, 1 (2000).
- [6] H. Burkhardt and B. Pietrzyk, accepted by Phys. Lett. B, LAPP-EXP 2001-03 (Feb. 2001).
- [7] C. Edwards et al., SLAC PUB 5160 (1990).
- [8] M. Davier and A. Hoecker, Phys Lett. B419, 419 (1998).
- [9] H. Burkhardt and B. Pietrzyk, Phys. Lett. B356, 398 (1995).
- [10] Z.G. Zhao, International Journal of Modern Physics A15, 3739 (2000).
- [11] J.Z. Bai et al., (BES Collab.), Nucl. Instr. Methods A458, 627 (2001).
- [12] J. Z. Bai et al., (BES Collab.), Phys. Rev. Lett. 84, 594 (2000).
- [13] B. Andersson and Haiming Hu, “Few-body States in Lund String Fragmentation Model”, hep-ph/9910285.
- [14] For a more complete description of LUARLW, see Haiming Hu, “Hadron Production at Intermediate Energies”, The Physics at Intermediate Energies Workshop, T24.
- [15] E. Eichten et al., Phys. Rev. D21, 203 (1980).
- [16] Haiming Hu et al., ”The Application of A New Generator Based on Lund Area Law to the Scan in 2-5 GeV Center-of-mass Energy Region”, Accepted by ”High Energy Physics and Nuclear Physics (China)”.
- [17] F.A. Berends and R. Kleiss, Nucl. Phys. B178, 141 (1981).
- [18] G. Bonneau and F. Martin, Nucl. Phys. B27, 387 (1971).
- [19] E. A. Kuraev and V.S. Fadin, Sov. J. Nucl. Phys. 41, 3 (1985).
- [20] A. Osterheld et al., SLAC-PUB-4160, 1986. (T/E)
- [21] J. Z. Bai et al., (BES Collab.), submitted to PRL, hep-ex/102003.
- [22] C. Bacci et al., ( Collab.), Phys. Lett. B86, 234 (1979).
- [23] J. L. Siegrist et al., (Mark I Collab.), Phys. Rev. D26, 969 (1982).
-
[24]
L. Criegee and G. Knies, (Pluto Collab.),
Phys. Rep. 83, 151 (1982);
Ch. Berger et al., Phys. Lett. B81, 410 (1979). - [25] R. Ammar et al., CLEO Collab., Phys. Rev. D57, 1350 (1998).
- [26] A. E. Blinov et al., Z. Phys. C 70, 31 (1996).
- [27] T. Benninger, X.C. Lou, and W. M. Dunwoodie, “Physics with ISR EVENTS at B Factory Experiments”
- [28] E. Solodov, Study of the 1.5 - 3 GeV region using ISR with BaBar”, The Physics at Intermediate Energies Workshop, T03.
- [29] M. Suzuki, Phys. Rev. D63, 054021 (2001).