Estimate of the Energy of Upgoing Muons with Multiple Coulomb Scattering
Abstract
111Invited contribution to the NATO Advanced Research Workshop: Cosmic Radiation: From Astronomy To Particle Physics, 21-23 March 2001, Oujda (Morocco)Upward throughgoing muons in underground detectors are induced by atmospheric with energies in the range. The oscillations of atmospheric muon neutrinos should affect mainly those with energy smaller than , or . We analyzed the MACRO222For a complete list of the MACRO Collaboration see the F. Ronga contribution to these Proceedings upward throughgoing muons data set, using the Multiple Coulomb Scattering to estimate the energy of muons crossing the detector. We analyzed the event distribution for six event subsamples with different values of . The event distribution is in agreement with the hypothesis of neutrino oscillations with few times and maximum mixing.
1 Introduction
Neutrino oscillations, in a two neutrino mixing scenario, are the most likely solution for the atmospheric neutrino problem [1]. Underground experiments unfold the mass difference and the mixing angle from the measurement of the survival probability
The survival probability is usually plotted versus the measurable quantities and/or . is the neutrino path length, estimated from the measurement of the zenith angle of the daughter lepton. The neutrino energy is estimated from the calorimetric measurement of the energy of all final state particles.
At present, is measured with some accuracy for low energy events (fully and partially contained SK [2] and Soudan2 [3] events); however in this case is poorly reconstructed. The vice versa happens, when in the final state only the high-energy muon is measured (high energy neutrinos interacting in the rock around the detector, and inducing up-throughgoing muons in MACRO [7], SK [5] and Baksan[6]). The goal of next generation of atmospheric experiments should be the measurement of both and , with enough precision to observe the first minimum of .
In the case of the MACRO experiment, the measured oscillations parameters (best value: and ) are deduced: from the deficit and the distortion of the zenith angle distribution of up throughgoing ( ) [4, 7]; from the measured deficit of lower energy partially contained events[8].
In this paper we present the following approach: we identified topologies of upgoing muons induced from neutrinos with different energies and path length , and we discuss the results in terms of oscillations. The energy of detected muons is estimated through the multiple Coulomb scattering; is correlated with the energy of the parent neutrino. The survival probability shows a dependence with the parameter, unexpected without neutrino oscillations, while it is in good agreement with the quoted oscillation parameters.
2 Up throughgoing muon energy separation
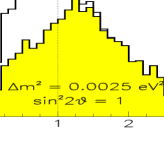
Up throughgoing muons are induced both by (relatively) low energy atmospheric , interacting near the detector, and higher energy neutrinos, interacting farther. Assuming the neutrino oscillations mechanism, with and , a reduced flux of muons with is expected, as shown by the shadowed histogram of Fig. 1a.

Multiple Coulomb Scattering. Muons traversing the detector are deflected by many small-angle scatters, the bulk of which are Coulomb scatterings from the nuclei and from the atomic electrons (Multiple Coulomb Scattering, MCS). As an effect, muons are slightly deviated from a straight-line direction by an angular deflection (projected in a plane) [9]. Quantitatively, the averaged angular deflection and the spatial deflection in one projective plane are approximated with:
| (1) |
| (2) |
In the case of MACRO, whose radiation length is and total thickness , the average angular deflection is . This corresponds to a projected spatial deflection in the wires view of the limited streamer tubes (whose cell size is 3 cm) of .
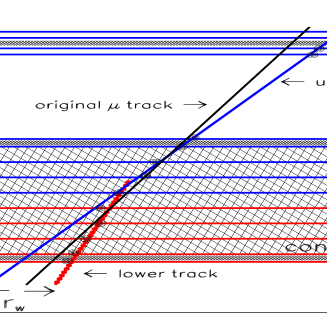
Experimental technique. The technique we used to distinguish muons of low and high energy is illustrated in Fig. 2. All up throughgoing , crossing the whole apparatus, were analyzed. The streamer tube hits in the lowest planes (N=1:8) were used for a refit, and the straight-line fit parameters were used to define the lower track. In a similar way, the highest planes (N=6:14) were used to define the upper track. The upper and lower tracks are used to evaluate , the spatial difference in the plane between the two tracks, and , the angular difference between the slopes. The value of the parameter () depends on the muon energy . In Fig. 1b the profile (i.e. the average value of evaluated in each bin of from our MC events) is shown. From the figure, the spatial difference between the lower and upper track exceed the intrinsic resolution of streamer tube cells when . The behavior of the parameter is analogous.
Event classification. A selection cut, based on and , was defined. Each up throughgoing muon is classified as: L= Low energy if and ; H= High energy if and . The remaining events with ambiguous deviation, were classified as M=Medium energy. Each sub sample has a different average energy for the parent neutrino. If disappearance is at work, the reduction should affect mainly the L sample, and we expect in the data a reduced ratio, with respect to the MC prediction without oscillations.
Checks on Monte Carlo predictions. A crucial point is the MC reliability, to avoid any systematic bias which can invalidates the results. For a detailed check of the detector simulation, we compared two large samples of measured with simulated downward going atmospheric muons. Down throughgoing atmospheric muons have an average residual energy of when reaching the underground laboratory, and 90% of them have . Our cut classified 63% (25%) of these events as igh (ow) energy. The small fraction of atmospheric muons (), reaching MACRO with , stops inside the detector: 88% (7%) of them have been classified as () energy.
The energy distribution of these two atmospheric samples overlaps the spectrum of neutrino-induced upgoing : the down-stop events in the lower, and the down- throughgoing in the high-energy tail. Using atmospheric muon samples, we adjusted the streamer tubes geometry in the MC database. After the MC correction, the measured and expected distribution of and variables match together, both for the down-stop and down-throughgoing atmospheric muons.
3 Results
Real data. We used the same up throughgoing muon sample described in [1]a. The details of the events identification, cuts and selection efficiency were published [4, 7]. In our analysis, only the 316 events crossing the whole apparatus where used, to enhance the MCS effect on the muon track. The and parameters are evaluated from the reconstructed lower and upper tracks, and 101 events were classified by the cuts as Low, 51 as Medium and 164 as High energy.
Simulated data. The expected number of up throughgoing muons from interactions was evaluated with two different methods. In the first method (”table” MC) [4, 7], the muon energy spectrum is obtained from a numerical convolution of the differential atmospheric neutrino spectrum, neutrino cross-sections and muon propagation in the rock. In the second (”full” MC), a full simulation is used: the interact in a large volume of rock around the detector, and the muon is propagated through the rock up to the detector. The simulated data have the same format of the real ones, and thus followed the same analyses steps. We applied the cut on and on the selected up throughgoing MC muons: for a live time period equivalent of that of the real data, we expect 431 (430) events from ”table” (”full”) MC: 177 (178) L, and 191 (193) H.
Uncertainties. The overall theoretical uncertainty on MC predictions is 17% [1,2]. This is a scale factor, which is almost constant when the number of events is plotted versus or . The shape of the distributions (as the angular one presented in [4, 7]) has a reduced theoretical uncertainty: we assumed a (conservative) value of 5% in the considered range of energies. The systematic uncertainties depend from many factor: the number of upper/bottom planes used in the refit; the choice of a particular value of and ; the MC simulation statistics; the fluctuation in the streamer tube and scintillator efficiency along the running period; the detector acceptance uncertainty vs. the muon zenith angle. The evaluated overall systematic uncertainty is 7%.
Data and MC comparisons. We divided the events in three bins of . The and samples were sub-divided in two bins of neutrino path length variable (the edium energy sample have too few events). The number of detected and expected events (MC evaluated) is presented in Table 1 and Fig. 3. It is also included an additional point, corresponding to the partially contained IU events [8]. These events are induced by neutrinos with an average energy , interacting inside the detector. This sample is contaminated by a 13% contribution of and NC interactions.
| zenith | |||||
|---|---|---|---|---|---|
| H (1) | |||||
| H (2) | |||||
| M (3) | |||||
| L (4) | |||||
| L (5) | |||||
| IU (6) |
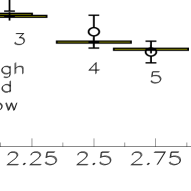
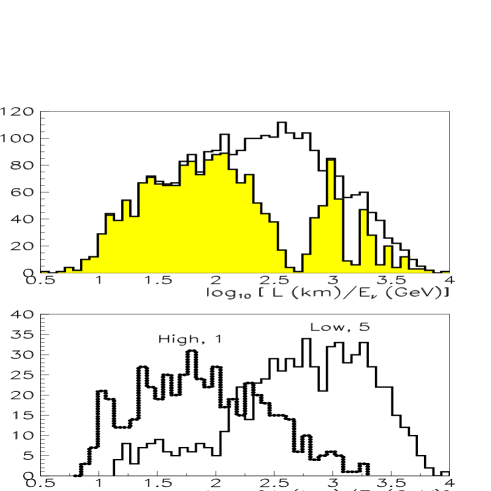
The ratio R between the detected to the expected number of events for each sub sample is shown in Fig. 3. The value of R expected with the used flux and neutrino cross sections, is 1 (no oscillations). This value has an overall scale factor uncertainty of 17%, which is almost constant all over the interval. In our data, R decreases when increases. This behavior is consistent with the neutrino disappearance probability, when folded with our distribution of events. In Fig. 3 the segment below each data point is obtained from Monte Carlo simulated events, assuming oscillation parameters , . The effect of neutrino oscillations in the distribution of is shown in Fig. 4a as a shadowed histogram. The effect of our cuts on the simulated events is shown in Fig. 4b for two subsamples (the one with the lowest/highest average value of ).
We evaluated the for the shape of the ratio R vs. for the two different test hypotheses: T0= no and T1= neutrino oscillations with the above quoted parameters. For hypothesis T0, we expect a (almost) constant value. Normalizing the number of expected with the number of detected events (316/430), we get a (probability of less than 2%). For hypothesis T1 we expect a value of R which decreases as a ”ladder” from 1 to 1/2, when . In this case, we get (probability=45%)
Hypotheses T0 and T1 can be tested also using the ratio of ratios . With the double ratio, most of the theoretical and systematic uncertainties cancel. For T1, we expect a larger reduction of events with ow energy with respect to the ones with igh energy. From our data, . For T0, (c.l. of 0.5%). For T1 (c.l. 90%).
4 Conclusions
We discussed the possibility to study the present high-energy atmospheric neutrinos data in terms of different bins of , using the Multiple Coulomb Scattering on muons. The MACRO events were analyzed: the result is consistent with the hypothesis of neutrino disappearance with and . This strengthens the hypothesis of neutrino oscillations to explain the data, against alternative more exotic models. A global analysis of all MACRO neutrino-induced data sets (which includes the results of this work) is in progress.
References
- [1] See also F. Ronga, D. Michael and E. Scapparone talks on this workshop
- [2] Y. Fukuda et al. (Super-Kamiokande Coll.) Phys.Rev.Lett. 81 (1998) 1562
- [3] W.A. Mann (Soudan 2 Collaboration), Nucl. Phys. Proc. Suppl. 91 (2000)134.
- [4] S.Ahlen et al. (MACRO Collaboration), Phys.Lett. B357 (1995)481
- [5] Y. Fukuda et al. (Super-Kamiokande Coll.) Phys.Rev.Lett. 82 (1999) 2644
- [6] See S. Mikheyev at SNO2000 http://nu2000.sno.laurentian.ca/
- [7] M.Ambrosio et al. (MACRO Collaboration), Phys. Lett. B434 (1998)451.
- [8] M.Ambrosio et al. (MACRO Collaboration), Phys.Lett. B478 (2000)5
- [9] Review of Particle Physics (Particle Data Group) Eur.Phys.J.C3(1998)