Measurements of CP violation, mixing and lifetimes in meson decays with the BABAR experiment at PEP-II.
SLAC-PUB-8833
BABAR-PROC-01/24
May, 2001
Measurements of CP violation, mixing and lifetimes in meson decays with the BABAR experiment at PEP-II.
Riccardo Faccini
University of California San Diego and Università “La Sapienza” Roma
(for the BABAR Collaboration)
Abstract
The BABAR detector, which operates at the SLAC PEP-II asymmetric collider at energies near the resonance has collected about 23M pairs in year 2000. Based on this data sample, we present a first study of , with samples of , and decays. The measured value is . In addition, we present preliminary measurements of charged and neutral meson lifetimes and oscillation frequency.
Contributed to the Proceedings of the
36th Rencontres de Moriond on Weak Interactions
10-17 Mar 2001, Les Arcs, France
Stanford Linear Accelerator Center, Stanford University, Stanford, CA 94309
Work supported in part by Department of Energy contract DE-AC03-76SF00515.
1 Introduction
The primary goal of the BABAR experiment at PEP-II is to over-constrain the Unitarity Triangle. The sides of this triangle can be measured through non- violating physics, such as , , measurements, while its angles are accessible through violating processes .
2 PEP-II
The PEP-II Factory is an colliding beam storage ring complex on the SLAC site designed to produce a luminosity of at least 3x at a center–of–mass energy of 10.58, the mass of the resonance. In the 2000 run, the achieved average luminosity was 3.3x. The total collected luminosity was about . The machine is asymmetric with a High Energy Ring (HER) for the 9.0 electron beam and a Low Energy Ring (LER) for the 3.1 positron beam. This corresponds to =0.56 and makes it possible to measure time dependent violating asymmetries. It corresponds to an average separation of =250 between the two mesons vertices.
3 B A B AR
3.1 Detector description
The BABAR detector is described in . The volume within the BABAR superconducting solenoid, which produces a 1.5 T axial magnetic field, consists of: a five layer silicon strip vertex detector (SVT), a central drift chamber (DCH), a quartz-bar Cherenkov radiation detector (DIRC) and a CsI crystal electromagnetic calorimeter (EMC). Two layers of cylindrical resistive plate counters (RPCs) are located between the barrel calorimeter and the magnet cryostat. All the detectors located inside the magnet have full acceptance in azimuth. The integrated flux return (IFR) outside the cryostat is composed of 18 layers of steel, which successively increase in thickness away from the interaction point, and are instrumented with 19 layers of planar RPCs in the barrel and 18 in the endcaps.
3.2 Event reconstruction
Charged particles are detected and their momentum is measured by a combination of the DCH and SVT. The charged particle momentum resolution is approximately given by , where is in . The SVT, with a typical resolution of 10 per hit, provides excellent vertex resolution both in the transverse plane and in . The vertex resolution in is typically 50 for a fully reconstructed meson and of order 100 for the distance among the two mesons when only one is fully reconstructed. Leptons and hadrons are identified using a combination of measurements from all the BABAR components, including the energy loss in the helium-based gas of the DCH (40 samples maximum) and in the silicon of the SVT (5 samples maximum). Electrons and photons are identified in the barrel and the forward regions by the EMC, and muons are identified in the IFR. In the barrel region the DIRC provides excellent kaon identification over the full momentum range above 250/c.
4 measurement
In storage rings operating at the resonance a pair produced in a decay evolves in a coherent -wave until one of the mesons decays. If one of the mesons () can be ascertained to decay to a state of known flavor at a certain time , the other () is at that time known to be of the opposite flavor. For the measurement of , is fully reconstructed in a eigenstate (, or ). By measuring the proper time interval from the decay time to the decay of the (), it is possible to determine the time evolution of the initially pure or state:
| (1) |
where the or sign indicates whether the is tagged as a or a , respectively. The dilution factor is given by , where is the mistag fraction, i.e., the probability that the flavor of the tagging is identified incorrectly. is the eigenstate of the final state and it is for the and modes, for the mode. Although less pure, the mode is very important because the oscillation is expected to be opposite to the other ones. A direct violation term proportional to could arise from the interference between two decay mechanisms with different weak phases. In the Standard Model, we consider that the dominant diagrams for the decay modes have no relative weak phase, so no such term is expected.
To account for the finite resolution of the detector, the time-dependent distributions for and tagged events (Eq. 1) must be convoluted with a time resolution function :
| (2) |
where represents the set of parameters that describe the resolution function.
Finally, the time-dependent distributions need to account for the background with additional parameters that characterize both its sample composition and the distribution. The background components are parametrized with an ARGUS function and a small peaking component in the energy substituted mass . While the ARGUS component is extracted from data, the peaking one is derived from data. The background is made of a component from decays in , whose parameters are taken from MC, and the other sources which are characterized using the mass sidebands.
Since no time-integrated asymmetry effect is expected, an analysis of the time-dependent asymmetry is necessary.
4.1 Analysis
For this analysis, published in , we use a sample of of data recorded in year 2000, of which was recorded 40 below the resonance (off-resonance data).
The measurement of the -violating asymmetry has five main components :
-
•
Selection of the signal , and events, as described in detail in .
The selection of the two modes with the can profit from the fact that there are two discriminating kinematic variables, , the difference between the reconstructed and expected meson energy measured in the center–of–mass frame, and , the beam–energy substituted mass (see Fig. 1). The background is mainly coming from combinatorics in continuum and other decays and its properties can be estimated from the sidebands.
The sample is instead less pure because the the momentum is not reconstructed. The mass constraint is therefore imposed and only one discriminating variable is left ( ) as shown in Fig. 1. The background is mainly due to other decays and its properties are determined on MC.
Signal event yields and purities, determined from a fit to the distributions after selection on , are summarized in Table 1.
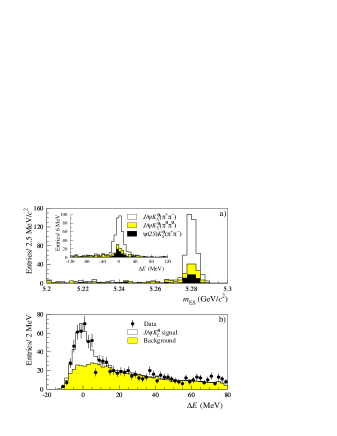
Figure 1: () and () signal (top) and signal (bottom) . Table 1: Number of tagged events, signal purity and result of fitting for asymmetries in the full sample and in various subsamples, as well as in the and charged control samples. Sample Purity (%) , 0.250.22 0.870.51 Full sample 0.340.20 , only () 0.250.26 () -0.050.66 () 0.400.50 Lepton tags 0.070.43 Kaon tags 0.400.29 NT1 tags -0.030.67 NT2 tags 0.090.76 sample 0.030.05 Charged sample 0.020.05 -
•
Selection of decays in flavor eigenstate (). candidates are formed by combining a or with a , , , or by combining a candidate with a . Their background is mainly due to conbinatorics and can be studied in the sidebands. Yields and purities are also summarized in Table 1.
-
•
Measurement of the distance between the vertex of the reconstructed meson () and the vertex of the flavor-tagging meson ().
In the reconstruction of the vertex, we use all charged daughter tracks. The vertex for the decay is constructed from all the remaining tracks in the event.
In order to reduce bias and tails due to long-lived particles, and candidates are used as input to the fit in place of their daughters. In addition, tracks consistent with photon conversions () are excluded. To reduce contributions from charm decay products, which bias the determination of the vertex position, the track with the largest vertex contribution greater than 6 is removed and the fit is redone until no track fails the requirement or only one track remains.
From the measurement of and of the momentum, can be computed. At an asymmetric-energy Factory, in fact, the proper decay-time difference is, to an excellent approximation, proportional to the distance between the two -decay vertices along the axis of the boost, .
The time resolution function in equation 2 is described by a sum of three Gaussian distributions (called the core, tail and outlier components) with different means and widths:
(3) For the core and tail Gaussians, the widths are scaled by the event-by-event measurement error derived from the vertex fits: . In data, approximately 65% of the area of the resolution function is in the core Gaussian. The width of the core Gaussian is approximately 110 or 0.7; the width of the tail Gaussian is approximately 300 or 1.8. The third Gaussian has a fixed width of 8 ps and no offset; it accounts for the fewer than 1% of events with incorrectly reconstructed vertices.
-
•
Determination of the flavor of the .
Each event with a candidate is assigned a or tag if the rest of the event (i.e., with the daughter tracks of the removed) satisfies the criteria from one of several tagging categories. In other words, a tag indicates that the candidate was in a state at ; a tag indicates that the candidate was in a state.
Two tagging categories rely on the presence of a fast lepton (Lepton category) and/or one or more charged kaons in the event (Kaon category). Two categories, called neural network categories (NT1 and NT2), are based upon the output value of a neural network algorithm applied to events that have not already been assigned to lepton or kaon tagging categories.
The figure of merit for each tagging category is the effective tagging efficiency , where is the fraction of events assigned to category and is the mistag fraction. The effective tagging efficiency as evaluated in data is summarized in Tab. 2.
Table 2: Mistag fractions measured from a maximum-likelihood fit to the time distribution for the fully-reconstructed sample. The uncertainties on and are statistical only. Category (%) (%) (%) (%) Lepton Kaon NT1 NT2 All -
•
The mistag fractions and the tagging efficiencies obtained by combining the results from maximum likelihood fits to the time distributions in the hadronic and semileptonic samples are summarized in Table 2.
-
•
Extraction of the amplitude of the asymmetry and the value of with an unbinned maximum likelihood fit. In order to extract as much information from the data itself and properly account for correlation, the fit is performed simultaneously to the and the flavor eigenstates. There are 35 parameters free in the fit:
-
–
Value of ;
-
–
Signal resolution function: Nine parameters to describe the resolution function for the signal, being scale factors for the event-by-event resolution errors of the core and tail Gaussian components, individual core biases per tagging category and a common tail bias , and the tail and outlier fractions; the width of the outlier component is taken to be a fixed 8 with zero bias;
-
–
Signal dilutions: Eight parameters to describe the measured average dilutions and dilution differences in each tagging category.
-
–
Background resolution function: Three parameters are used to describe a common resolution function for all non-peaking backgrounds, which is taken as a single Gaussian distribution with a scale factor for the event-by-event errors and an common bias , and an outlier fraction ; the width of the outlier component is taken to be a fixed 8 with zero bias;
-
–
background properties: A total of 13 parameters describe the background properties. We make several assumptions to simplify the parameterization of the background contributions and assign a corresponding systematic uncertainty. The mixing background contribution is assumed to be absent, . The size of the peaking background is determined from Monte Carlo simulation to be of the signal contribution in each tagging category. This contribution is dominantely from events, so , and are taken from the data sample. The effective dilutions for the prompt (, 4 parameters) and lifetime (, 4 parameters) contributions are allowed to vary. The relative amount of these two contributions is allowed to vary, independently in each tagging category (4 parameters). For the lifetime contribution, is assumed to be same for all tagging categories, giving one free parameter.
-
–
background properties: One parameter, the fraction of prompt relative to lifetime background, assumed to be the same for each tagging category, is allowed to float to describe the background properties. The effective dilutions of the lifetime and peaking contribution are set to zero (), corresponding to no -asymmetry in the background. The size and parameters of the peaking background is again determined from Monte Carlo simulation. The fraction of peaking background is of the signal contribution, independent of tagging category. This contribution is assumed to have dilutions and lifetime parameters in common with the signal contribution. Finally, the lifetime of the lifetime background is assumed to be in all tagging categories.


Figure 2: Variation of the log likelihood as a function of (left), for the whole sample (full curve), the sample (dashed curve) and the sample (dotted line). Distribution of for (a) the tagged events and (b) the tagged events in the sample (right). The maximum-likelihood fit for , using the full tagged sample, gives:
(4) For this result, the lifetime and are fixed to the current best values . The log likelihood is shown as a function of and the distributions for and tags are shown in Fig. 2.
-
–
The dominant sources of systematic error are the assumed parameterization of the resolution function (0.04), due in part to residual uncertainties in the SVT alignment, and uncertainties in the level, composition, and asymmetry of the background in the selected events (0.02). The systematic errors from uncertainties in and and from the parameterization of the background in the selected sample are found to be negligible. An increase of in the assumed value for decreases by 0.012.
The large sample of reconstructed events allows a number of consistency checks, including separation of the data by decay mode, tagging category and flavor. The results of fits to these subsamples are shown in Table 1 for the high-purity events. Table 1 also shows results of fits with the samples of non- decay modes, where no statistically significant asymmetry is found.
5 Measurements of charged and neutral meson lifetimes and oscillations
These measurements can be used to test theoretical models of heavy–quark decays and to constrain the Unitarity Triangle (via the sensitivity to the value of the CKM matrix element ).
One () is fully reconstructed in an all-hadronic (, , , and , , ) modes. The number of selected events and purities are summarized in Table 1.
The measurement of and, when needed, the tagging of the recoiling is done in the same way as for the measurement, so that these measurements constitute also a valuable validation of the measurement.
5.1 Lifetime Measurements
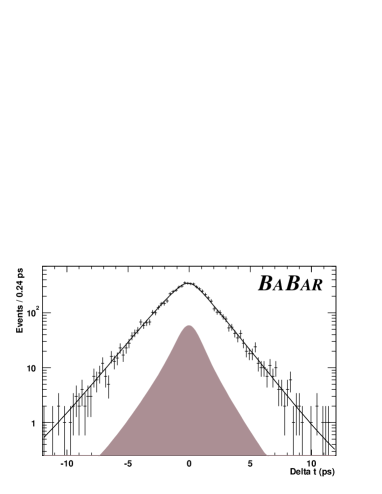
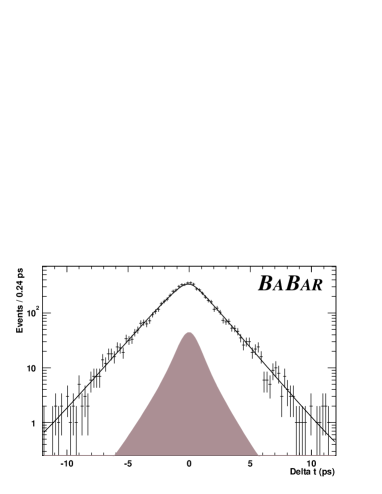
The and lifetimes are extracted from a simultaneous unbinned maximum likelihood fit to the distributions of the signal candidates, assuming a common resolution function. An empirical description of the background shape is assumed, using sidebands with independent parameters for neutral and charged mesons. Fig. 3 shows the distributions with the fit result superimposed.
 |
 |
5.2 Time–dependent mixing
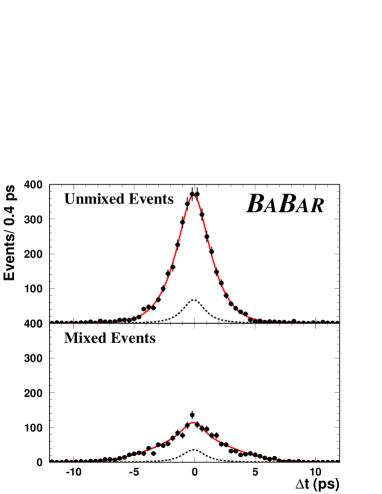
A time-dependent mixing measurement requires the determination of the flavor of both mesons. Considering the system as a whole, one can classify the tagged events as mixed or unmixed depending on whether the is tagged with the same flavor as the or with the opposite flavor.
From the time-dependent rate of mixed () and unmixed () events, the mixing asymmetry is calculated as a function of and fit to the expected cosine distribution. A likelihood fit with 34 free parameters is performed. The free parameters are the same as in the fit, apart from itself and the background to the eigenstates which are not used, and , which is, of course, floated.
 |
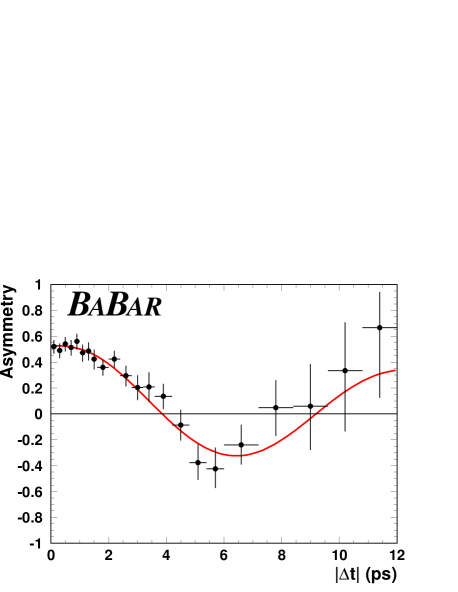 |
Fig. 4 shows the and distributions with the fit result superimposed.
5.3 Results
The preliminary results for the meson lifetimes are and and for their ratio is
We measure the oscillation frequency:
The above results are consistent with previous measurements and are of similar precision. The mixing result is compatible with a BABAR measurement using di–leptons .
6 Conclusions
We have presented BABAR’s first measurement of the -violating asymmetry parameter in the meson system:
| (5) |
Our measurement is consistent with the world average , and is currently limited by the size of the sample.
We have also presented time–dependent mixing and lifetime measurements, performed for the first time at the .
References
References
- [1] P. H. Harrison and H. R. Quinn, eds., “The BABAR physics book”, SLAC-R-504 (1998).
- [2] BABAR Collaboration, B. Aubert et al., “The first year of the BABAR experiment at PEP-II”, hep–ex/0008059.
- [3] BABAR Collaboration, B. Aubert et al., “The BABAR Detector” hep–ex/0105044, to appear in to Nucl. Instr. and Methods .
- [4] BABAR Collaboration, B. Aubert et al., “Measurement of violating asymmetries in decays to eigenstates”, Phys.Rev.Lett. 86, 2515 (2001).
- [5] BABAR Collaboration, B. Aubert et al., “A measurement of the oscillation frequency and determination of flavor-tagging efficiency using semileptonic and hadronic decays”, hep–ex/0008052.
- [6] BABAR Collaboration, B. Aubert et al., “Exclusive decays to charmonium final states”, hep–ex/0008050.
- [7] Particle Data Group, D. E. Groom et al., Eur. Phys. Jour. C 15, 1 (2000).
- [8] BABAR Collaboration, B. Aubert et al. “A study of time-dependent -asymmetries in and decays”, hep–ex/0008048.
- [9] BABAR Collaboration, B. Aubert et al., “Measurement of the time dependence of oscillations using inclusive dilepton events”, hep–ex/0008054.