NA48: Rare Decay Results

T. Çuhadar-Dönszelmann
On behalf of the NA48 Collaborationaaa Cagliari-Cambridge-CERN-Dubna-Edinburgh-Ferrara-Firenze-Mainz-Orsay-Perugia-Pisa-Saclay-Siegen-Torino-Vienna-Warsaw

Recent results on the kaon rare decays of the KSγγsubscript𝐾𝑆𝛾𝛾K_{S}~{}\rightarrow~{}\gamma\gamma, KS,Lπ+πe+esubscript𝐾𝑆𝐿superscript𝜋superscript𝜋superscript𝑒superscript𝑒K_{S,L}~{}\rightarrow~{}\pi^{+}\pi^{-}e^{+}e^{-}, KSπ0e+esubscript𝐾𝑆superscript𝜋0superscript𝑒superscript𝑒K_{S}~{}\rightarrow~{}\pi^{0}e^{+}e^{-} measured in NA48 experiment at CERN are presented in this paper.


1 The experiment

The NA48 experiment is designed to measure direct CP violation in two-pion decays and to search for rare decays of neutral kaons using simultaneous and almost collinear KSsubscript𝐾𝑆K_{S} and KLsubscript𝐾𝐿K_{L} beams. The KLsubscript𝐾𝐿K_{L} beam is produced by 450 GeV/c protons from SPS hitting a beryllium target an angle of 2.4 mrad. The proton intensity is 1.5×10121.5superscript10121.5\times 10^{12} per SPS pulse and these pulses are 2.4 s long with a repetition period of 14.4 s. Non-interacting protons are directed to the KSsubscript𝐾𝑆K_{S} target, which is positioned 120similar-toabsent120\sim 120 m downstream of the KLsubscript𝐾𝐿K_{L} beam line, to produce the KSsubscript𝐾𝑆K_{S} beam. Anticounter at the end of the final collimator(AKS) defines the beginning of the fidual volume of 40similar-toabsent40\sim 40 m long. A set of seven scintillator counters(AKL) surround the decay region and vetoes events outside the detector acceptance. The energy and the position of the electromagnetic showers of electrons and photons as the products of the kaon decays are detected in the liquid krypton calorimeter(LKR), with an energy resolution of σ(E)/E0.100/E0.032/E0.005similar-to-or-equals𝜎𝐸𝐸direct-sum0.100𝐸0.032𝐸0.005\sigma(E)/E\simeq 0.100/E\oplus 0.032/\sqrt{E}\oplus 0.005 (E in GeV). The momenta of charged particles are measured in a spectrometer consisting of a dipole magnet and four drift chambers(DCH). The spectrometer has a momentum resolution of σ(p)/p[0.009p0.5]%similar-to-or-equals𝜎𝑝𝑝percentdelimited-[]direct-sum0.009𝑝0.5\sigma(p)/p\simeq[0.009{p}\oplus 0.5]\% (p in GeV). A hodoscope placed in front of the calorimeter is used to measure the event time with resolution of 150 ps. An iron-scintillator hadron calorimeter(HAC) is used to measure the energies of the hadrons and the muons are identified by an muon veto system. The detailed description of the experiment can be found elsewhere ??\!{}^{{\bf?}}.

The results presented here are based on data taken in 1998 and 1999 During two days in 1999, data was recorded with a factor 200similar-toabsent200\sim 200 higher beam intensity than the usual KSsubscript𝐾𝑆K_{S} beam, resulting in 2.3×1082.3superscript1082.3\times 10^{8} KSsubscript𝐾𝑆K_{S} decays.

2 Decays of KSγγsubscript𝐾𝑆𝛾𝛾K_{S}~{}\rightarrow~{}\gamma\gamma

In the framework of the chiral perturbation theory(χ𝜒\chiPT), the contributions of one loop of charged pions and kaons to KSγγsubscript𝐾𝑆𝛾𝛾K_{S}~{}\rightarrow~{}\gamma\gamma decays are finite and give an unambigious prediction for branching ratio, 2.25×1062.25superscript1062.25\times 10^{-6} with less than 10%percent1010\% uncertainty ??\!{}^{{\bf?}}. Thus, a precise determination of branching ratio provides a good test of χ𝜒\chiPT. The CERN experiment NA31 ??\!{}^{{\bf?}} measured a value compatible with theory: (2.4±0.9)×106plus-or-minus2.40.9superscript106(2.4\pm 0.9)\times 10^{-6}.

Two-gamma decays of short-lived kaons are reconstructed from KSsubscript𝐾𝑆K_{S} high intensity data taken in 1999. KSγγsubscript𝐾𝑆𝛾𝛾K_{S}~{}\rightarrow~{}\gamma\gamma candidates are selected by requiring events with 2absent2\geq 2 clusters. The pairs of these clusters must be within ±5plus-or-minus5\pm 5 ns. No other cluster with energy >1.5absent1.5>1.5 GeV within ±3plus-or-minus3\pm 3ns around the event time must be present. The energy of each cluster must lie between 3<Ei<1003subscript𝐸𝑖1003<E_{i}<100 GeV and the sum of cluster energies, the kaon energy, must be between 60 and 170 GeV. The center of gravity(cog) measured for two clusters cog=(iEixi)2+(iEiyi)2/iEi𝑐𝑜𝑔superscriptsubscript𝑖subscript𝐸𝑖subscript𝑥𝑖2superscriptsubscript𝑖subscript𝐸𝑖subscript𝑦𝑖2subscript𝑖subscript𝐸𝑖cog={\sqrt{(\sum_{i}E_{i}x_{i})^{2}+(\sum_{i}E_{i}y_{i})^{2}}}/{\sum_{i}E_{i}}, must be less than 7cm. Events with some activity in the AKS, AKL and DCH are rejected. Energy deposited in the HAC must not exceed 3 GeV in a time window of ±15plus-or-minus15\pm 15ns around the event time. After the initial event selection, the longitudinal vertex position of the event is calculated by

zvertex=zLKRi,j,i>jEiEj[(xixj)2+(yiyj)2]mK,subscript𝑧𝑣𝑒𝑟𝑡𝑒𝑥subscript𝑧𝐿𝐾𝑅subscript𝑖𝑗𝑖𝑗subscript𝐸𝑖subscript𝐸𝑗delimited-[]superscriptsubscript𝑥𝑖subscript𝑥𝑗2superscriptsubscript𝑦𝑖subscript𝑦𝑗2subscript𝑚𝐾z_{vertex}=z_{LKR}-\frac{\sqrt{\sum_{i,j,i>j}{E_{i}}{E_{j}}[(x_{i}-x_{j})^{2}+(y_{i}-y_{j})^{2}]}}{m_{K}},

where zLKRsubscript𝑧𝐿𝐾𝑅z_{LKR} is the longitudinal position of the liquid krypton calorimeter from the AKS, xi,yisubscript𝑥𝑖subscript𝑦𝑖x_{i},y_{i} are the transverse position of the clusters at the LKR, and mKsubscript𝑚𝐾m_{K} is the kaon mass. The study of KSγγsubscript𝐾𝑆𝛾𝛾K_{S}~{}\rightarrow~{}\gamma\gamma is done in a limited region, 2<zvertex<52subscript𝑧𝑣𝑒𝑟𝑡𝑒𝑥5-2<z_{vertex}<5 m in order to minimize the main source of background which is KSπ0π0subscript𝐾𝑆superscript𝜋0superscript𝜋0K_{S}~{}\rightarrow~{}\pi^{0}\pi^{0}. After the above cuts, 450 Kγγ𝐾𝛾𝛾K~{}\rightarrow~{}\gamma\gamma events are obtained. The zvertexsubscript𝑧𝑣𝑒𝑟𝑡𝑒𝑥z_{vertex} distribution of those events are shown in Figure 1(left).

Refer to caption
Refer to caption
Figure 1: (left) The zvertexsubscript𝑧𝑣𝑒𝑟𝑡𝑒𝑥z_{vertex} distribution for data and MC. The open circles represent KSπ0π0subscript𝐾𝑆superscript𝜋0superscript𝜋0K_{S}~{}\rightarrow~{}\pi^{0}\pi^{0} events while closed squares show Kγγ𝐾𝛾𝛾K~{}\rightarrow~{}\gamma\gamma. The solid line shows the γγ𝛾𝛾\gamma\gamma background from MC simulated KSπ0π0subscript𝐾𝑆superscript𝜋0superscript𝜋0K_{S}~{}\rightarrow~{}\pi^{0}\pi^{0} decays. The peak at z=1250𝑧1250z=-1250 cm is due to η𝜂\eta mesons produced in the AKS. (right) The zvertexsubscript𝑧𝑣𝑒𝑟𝑡𝑒𝑥z_{vertex} distribution obtained from maximum likelihood method for fitted KSγγsubscript𝐾𝑆𝛾𝛾K_{S}~{}\rightarrow~{}\gamma\gamma events (dotted area) and KLγγsubscript𝐾𝐿𝛾𝛾K_{L}~{}\rightarrow~{}\gamma\gamma component (hatched area). The dots show the data and the arrows show the fitted region.

The main background to KSγγsubscript𝐾𝑆𝛾𝛾K_{S}~{}\rightarrow~{}\gamma\gamma decays are KSπ0π0subscript𝐾𝑆superscript𝜋0superscript𝜋0K_{S}~{}\rightarrow~{}\pi^{0}\pi^{0} decays where two photons are not detected. The maximum invariant mass of the γγ𝛾𝛾\gamma\gamma from π0π0superscript𝜋0superscript𝜋0\pi^{0}\pi^{0} events is 458 MeV resulting in a 9 m shift in the zvertexsubscript𝑧𝑣𝑒𝑟𝑡𝑒𝑥z_{vertex}. This background is minimized by requiring the zvertexsubscript𝑧𝑣𝑒𝑟𝑡𝑒𝑥z_{vertex} cut described above. 108superscript10810^{8} KSπ0π0subscript𝐾𝑆superscript𝜋0superscript𝜋0K_{S}~{}\rightarrow~{}\pi^{0}\pi^{0} events are simulated to estimate this contribution. A second background to KSγγsubscript𝐾𝑆𝛾𝛾K_{S}~{}\rightarrow~{}\gamma\gamma decays arises from KLγγsubscript𝐾𝐿𝛾𝛾K_{L}~{}\rightarrow~{}\gamma\gamma decays because of the KLsubscript𝐾𝐿K_{L} flux produced at the target. This background is estimated by measuring KLsubscript𝐾𝐿K_{L} flux from KSπ0π0subscript𝐾𝑆superscript𝜋0superscript𝜋0K_{S}~{}\rightarrow~{}\pi^{0}\pi^{0} decays. The remaining background originated from Λnπ0Λ𝑛superscript𝜋0\Lambda~{}\rightarrow~{}n\pi^{0} is estimated by comparing cog distribution for those events with signal events.

Using a binned maximum likelihood method, 149±21plus-or-minus14921149\pm 21 KSγγsubscript𝐾𝑆𝛾𝛾K_{S}~{}\rightarrow~{}\gamma\gamma events are estimated in the signal region and the branching ratio of KSγγsubscript𝐾𝑆𝛾𝛾K_{S}~{}\rightarrow~{}\gamma\gamma is measured to be ??\!{}^{{\bf?}}

BR(KSγγ)=(2.58±0.36(stat)±0.22(sys))×106.𝐵𝑅subscript𝐾𝑆𝛾𝛾plus-or-minus2.580.36𝑠𝑡𝑎𝑡0.22𝑠𝑦𝑠superscript106BR(K_{S}\rightarrow\gamma\gamma)=(2.58\pm 0.36(stat)\pm 0.22(sys))\times 10^{-6}. (1)

The result of the likelihood method is shown in Figure 1(right). The main systematic error sources are due to uncertainty of BR(KLγγ)(5%)𝐵𝑅subscript𝐾𝐿𝛾𝛾percent5BR(K_{L}~{}\rightarrow~{}\gamma\gamma)(5\%), the selection cuts (4%percent44\%), background (5%percent55\%), acceptance (2%percent22\%), and the trigger efficiency (2%percent22\%).

From this measurement, the ratio of the decay widths of KSγγsubscript𝐾𝑆𝛾𝛾K_{S}~{}\rightarrow~{}\gamma\gamma to KLγγsubscript𝐾𝐿𝛾𝛾K_{L}~{}\rightarrow~{}\gamma\gamma is computed to be

R=Γ(KSγγ)Γ(KLγγ)=2.53±0.35(stat)±0.22(sys).𝑅Γsubscript𝐾𝑆𝛾𝛾Γsubscript𝐾𝐿𝛾𝛾plus-or-minus2.530.35𝑠𝑡𝑎𝑡0.22𝑠𝑦𝑠R=\frac{\Gamma(K_{S}~{}\rightarrow~{}\gamma\gamma)}{\Gamma(K_{L}~{}\rightarrow~{}\gamma\gamma)}=2.53\pm 0.35(stat)\pm 0.22(sys).

3 Decays of KLπ+πe+esubscript𝐾𝐿superscript𝜋superscript𝜋superscript𝑒superscript𝑒K_{L}~{}\rightarrow~{}\pi^{+}\pi^{-}e^{+}e^{-}

The study of KLπ+πe+esubscript𝐾𝐿superscript𝜋superscript𝜋superscript𝑒superscript𝑒K_{L}~{}\rightarrow~{}\pi^{+}\pi^{-}e^{+}e^{-} decays ?,???\!{}^{{\bf?},{\bf?}} provides a way to observe CP violation in the neutral kaon system. The two main contributions to this decay are the CP conserving direct emission associated with a magnetic dipole transition (M1) and the CP violating innner bremsstrahlung. The interference between these two components produces CP violating asymmetry (AL14%similar-tosubscript𝐴𝐿percent14A_{L}\sim 14\%) in the angle ϕitalic-ϕ\phi between normals to the π+πsuperscript𝜋superscript𝜋\pi^{+}\pi^{-} and e+esuperscript𝑒superscript𝑒e^{+}e^{-} planes in the kaon center of mass system.

The asymmetry and the branching ratio is determined from the combined data taken in 1998 and 1999. KLπ+πe+esubscript𝐾𝐿superscript𝜋superscript𝜋superscript𝑒superscript𝑒K_{L}~{}\rightarrow~{}\pi^{+}\pi^{-}e^{+}e^{-} events are selected by requiring two positive and two negative intime tracks. The electron and pion identifications are based on the E/p𝐸𝑝E/p measurement, where E𝐸E is measured in the LKR and p𝑝p is measured in the spectrometer.

Refer to caption
Refer to caption
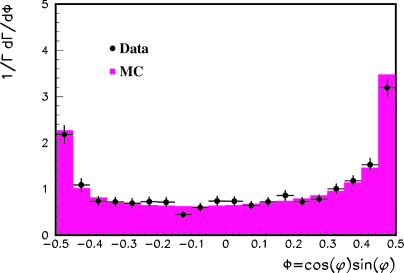
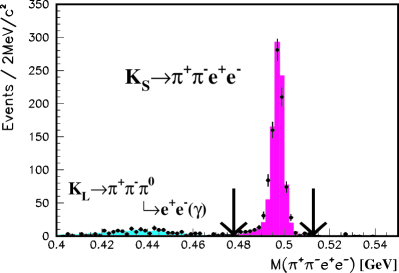
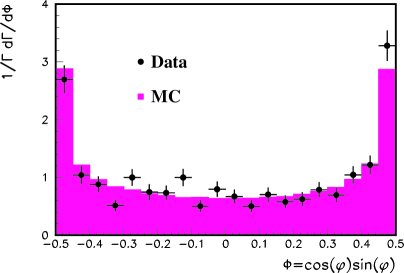
Figure 2: For combined 1998 and 1999 data: (left) Measured Mπ+πe+esubscript𝑀superscript𝜋superscript𝜋superscript𝑒superscript𝑒M_{\pi^{+}\pi^{-}e^{+}e^{-}} invariant mass for KLπ+πe+esubscript𝐾𝐿superscript𝜋superscript𝜋superscript𝑒superscript𝑒K_{L}~{}\rightarrow~{}\pi^{+}\pi^{-}e^{+}e^{-}, (right) After acceptance correction, the ϕitalic-ϕ\phi distribution from which asymmetry is obtained.

The main background to KLπ+πe+esubscript𝐾𝐿superscript𝜋superscript𝜋superscript𝑒superscript𝑒K_{L}~{}\rightarrow~{}\pi^{+}\pi^{-}e^{+}e^{-} decays is due to the KLπ+ππD0subscript𝐾𝐿superscript𝜋superscript𝜋subscriptsuperscript𝜋0𝐷K_{L}~{}\rightarrow~{}\pi^{+}\pi^{-}\pi^{0}_{D} where πD0subscriptsuperscript𝜋0𝐷\pi^{0}_{D} decays into e+eγsuperscript𝑒superscript𝑒𝛾e^{+}e^{-}\gamma, with a lost γ𝛾\gamma. They are eliminated using a variable p02p^{{}^{\prime}2}_{0}, p02=((mK2mπ02mππ2)24mπ02mππ24(p2)ππmK2)/4(mππ2+(p2)ππ)p^{{}^{\prime}2}_{0}=((m_{K}^{2}-m_{\pi^{0}}^{2}-m_{\pi\pi}^{2})^{2}-4m_{\pi^{0}}^{2}m_{\pi\pi}^{2}-4(p_{\perp}^{2})_{\pi\pi}m_{K}^{2})/4(m_{\pi\pi}^{2}+(p_{\perp}^{2})_{\pi\pi}). For KLπ+ππD0subscript𝐾𝐿superscript𝜋superscript𝜋subscriptsuperscript𝜋0𝐷K_{L}~{}\rightarrow~{}\pi^{+}\pi^{-}\pi^{0}_{D} events p02p^{{}^{\prime}2}_{0} is greater than zero. The second background source is due to the KLπ+πγsubscript𝐾𝐿superscript𝜋superscript𝜋𝛾K_{L}~{}\rightarrow~{}\pi^{+}\pi^{-}\gamma, where γ𝛾\gamma converts into a e+esuperscript𝑒superscript𝑒e^{+}e^{-} pair. The rejection is done by demanding 2 cm seperation between electron tracks in the first drift chamber.

The invariant mass mπ+πe+esubscript𝑚superscript𝜋superscript𝜋superscript𝑒superscript𝑒m_{\pi^{+}\pi^{-}e^{+}e^{-}} distribution for KLπ+πe+esubscript𝐾𝐿superscript𝜋superscript𝜋superscript𝑒superscript𝑒K_{L}~{}\rightarrow~{}\pi^{+}\pi^{-}e^{+}e^{-} is shown in Figure 2(left). Using KTEV results ??\!{}^{{\bf?}} on a1/a2=0.72±0.03subscript𝑎1subscript𝑎2plus-or-minus0.720.03a_{1}/a_{2}=-0.72\pm 0.03 and g~M1=1.350.17+0.20subscript~𝑔𝑀1subscriptsuperscript1.350.200.17\tilde{g}_{M1}=1.35^{+0.20}_{-0.17}, the preliminary measurement on branching ratio of KLπ+πe+esubscript𝐾𝐿superscript𝜋superscript𝜋superscript𝑒superscript𝑒K_{L}~{}\rightarrow~{}\pi^{+}\pi^{-}e^{+}e^{-}, based on 1337 reconstructed events, is BR(KLπ+πe+e)=(3.1±0.1(stat)±0.2(sys))×107.𝐵𝑅subscript𝐾𝐿superscript𝜋superscript𝜋superscript𝑒superscript𝑒plus-or-minus3.10.1𝑠𝑡𝑎𝑡0.2𝑠𝑦𝑠superscript107BR(K_{L}\rightarrow\pi^{+}\pi^{-}e^{+}e^{-})=(3.1\pm 0.1(stat)\pm 0.2(sys))\times 10^{-7}. The asymmetry is obtained from the ϕitalic-ϕ\phi distribution corrected for acceptance (Figure 2(right)). The preliminary result on the asymmetry is given by AL=(13.9±2.7(stat)±2.0(sys))%subscript𝐴𝐿percentplus-or-minus13.92.7𝑠𝑡𝑎𝑡2.0𝑠𝑦𝑠A_{L}=(13.9\pm 2.7(stat)\pm 2.0(sys))\% which is in good agreement with the theoretical prediction.

4 Decays of KSπ+πe+esubscript𝐾𝑆superscript𝜋superscript𝜋superscript𝑒superscript𝑒K_{S}~{}\rightarrow~{}\pi^{+}\pi^{-}e^{+}e^{-}

The main contribution to the KSπ+πe+esubscript𝐾𝑆superscript𝜋superscript𝜋superscript𝑒superscript𝑒K_{S}~{}\rightarrow~{}\pi^{+}\pi^{-}e^{+}e^{-} decay ?,???\!{}^{{\bf?},{\bf?}} arises from CP conserving inner bremsstrahlung and as a result no asymmetry in the ϕitalic-ϕ\phi distribution is expected.

The events selection is done in a similar way as in KLπ+πe+esubscript𝐾𝐿superscript𝜋superscript𝜋superscript𝑒superscript𝑒K_{L}~{}\rightarrow~{}\pi^{+}\pi^{-}e^{+}e^{-}. The main background arising from KLπ+ππD0subscript𝐾𝐿superscript𝜋superscript𝜋subscriptsuperscript𝜋0𝐷K_{L}~{}\rightarrow~{}\pi^{+}\pi^{-}\pi^{0}_{D} is eliminated by requiring the event to be tagged as coming from the KSsubscript𝐾𝑆K_{S} beam. The first observation of this decay is based on the data taken in 1998 ??\!{}^{{\bf?}}. Based on the 56 KSπ+πe+esubscript𝐾𝑆superscript𝜋superscript𝜋superscript𝑒superscript𝑒K_{S}~{}\rightarrow~{}\pi^{+}\pi^{-}e^{+}e^{-} events, the value obtained for the branching ratio of KSπ+πe+esubscript𝐾𝑆superscript𝜋superscript𝜋superscript𝑒superscript𝑒K_{S}~{}\rightarrow~{}\pi^{+}\pi^{-}e^{+}e^{-} is BR(KSπ+πe+e)=(4.5±0.7(stat)±0.4(sys))×105.𝐵𝑅subscript𝐾𝑆superscript𝜋superscript𝜋superscript𝑒superscript𝑒plus-or-minus4.50.7𝑠𝑡𝑎𝑡0.4𝑠𝑦𝑠superscript105BR(K_{S}\rightarrow\pi^{+}\pi^{-}e^{+}e^{-})=(4.5\pm 0.7(stat)\pm 0.4(sys))\times 10^{-5}. This value translates into the inner bremsstrahlung component of KLπ+πe+esubscript𝐾𝐿superscript𝜋superscript𝜋superscript𝑒superscript𝑒K_{L}~{}\rightarrow~{}\pi^{+}\pi^{-}e^{+}e^{-}, BR(KLIBπ+πe+e)=(1.4±0.2)×107𝐵𝑅superscriptsubscript𝐾𝐿𝐼𝐵superscript𝜋superscript𝜋superscript𝑒superscript𝑒plus-or-minus1.40.2superscript107BR(K_{L}^{IB}\rightarrow\pi^{+}\pi^{-}e^{+}e^{-})=(1.4\pm 0.2)\times 10^{-7}.

The asymmetry, ASsubscript𝐴𝑆A_{S}, and branching ratio of KSπ+πe+esubscript𝐾𝑆superscript𝜋superscript𝜋superscript𝑒superscript𝑒K_{S}~{}\rightarrow~{}\pi^{+}\pi^{-}e^{+}e^{-} are measured by using combined 1998 and 1999 data including the 2-day KSsubscript𝐾𝑆K_{S} high intensity data. Figure 3 shows the invariant mass Mπ+πe+esubscript𝑀superscript𝜋superscript𝜋superscript𝑒superscript𝑒M_{\pi^{+}\pi^{-}e^{+}e^{-}} and ϕitalic-ϕ\phi distributions for these data. Based on 921 KSπ+πe+esubscript𝐾𝑆superscript𝜋superscript𝜋superscript𝑒superscript𝑒K_{S}~{}\rightarrow~{}\pi^{+}\pi^{-}e^{+}e^{-} events, the preliminary result for the asymetry is given by AS=(0.2±3.4(stat)±1.4(sys))%subscript𝐴𝑆percentplus-or-minus0.23.4𝑠𝑡𝑎𝑡1.4𝑠𝑦𝑠A_{S}=(-0.2\pm 3.4(stat)\pm 1.4(sys))\% which is consistent with zero. The value obtained for the branching ratio is BR(KSπ+πe+e)=(4.3±0.2(stat)±0.3(sys))×105𝐵𝑅subscript𝐾𝑆superscript𝜋superscript𝜋superscript𝑒superscript𝑒plus-or-minus4.30.2𝑠𝑡𝑎𝑡0.3𝑠𝑦𝑠superscript105BR(K_{S}\rightarrow\pi^{+}\pi^{-}e^{+}e^{-})=(4.3\pm 0.2(stat)\pm 0.3(sys))\times 10^{-5}, and the inner bremsstrahlung component of KLπ+πe+esubscript𝐾𝐿superscript𝜋superscript𝜋superscript𝑒superscript𝑒K_{L}~{}\rightarrow~{}\pi^{+}\pi^{-}e^{+}e^{-}, BR(KLIBπ+πe+e)=(1.3±0.1))×107BR(K_{L}^{IB}\rightarrow\pi^{+}\pi^{-}e^{+}e^{-})=(1.3\pm 0.1))\times 10^{-7}.

Refer to caption
Refer to caption
Figure 3: For combined 1998 and 1999 data: (left) Measured Mπ+πe+esubscript𝑀superscript𝜋superscript𝜋superscript𝑒superscript𝑒M_{\pi^{+}\pi^{-}e^{+}e^{-}} invariant mass for KSπ+πe+esubscript𝐾𝑆superscript𝜋superscript𝜋superscript𝑒superscript𝑒K_{S}~{}\rightarrow~{}\pi^{+}\pi^{-}e^{+}e^{-}, (right) After acceptance correction, the ϕitalic-ϕ\phi distribution from which asymmetry is obtained.

5 Decays of KSπ0e+esubscript𝐾𝑆superscript𝜋0superscript𝑒superscript𝑒K_{S}~{}\rightarrow~{}\pi^{0}e^{+}e^{-}

The study of KSπ0e+esubscript𝐾𝑆superscript𝜋0superscript𝑒superscript𝑒K_{S}~{}\rightarrow~{}\pi^{0}e^{+}e^{-} decay ??\!{}^{{\bf?}} is important to improve the limit on the indirect CP violating term in KLπ0e+esubscript𝐾𝐿superscript𝜋0superscript𝑒superscript𝑒K_{L}~{}\rightarrow~{}\pi^{0}e^{+}e^{-}. The branching ratio is given by: BR(KSπ0e+e)5.2×10⁹aS2similar-to𝐵𝑅subscript𝐾𝑆superscript𝜋0superscript𝑒superscript𝑒5.2superscript109superscriptsubscript𝑎𝑆2BR(K_{S}\rightarrow\pi^{0}e^{+}e^{-})\sim 5.2\times 10^{-9}a_{S}^{2} where aSsubscript𝑎𝑆a_{S} is the strength of the indirect CP violating component in KLπ0e+esubscript𝐾𝐿superscript𝜋0superscript𝑒superscript𝑒K_{L}~{}\rightarrow~{}\pi^{0}e^{+}e^{-}. The present limit on the branching ratio comes from the NA31 experiment ??\!{}^{{\bf?}}, BR(KSπ0e+e)<1.1×10⁶𝐵𝑅subscript𝐾𝑆superscript𝜋0superscript𝑒superscript𝑒1.1superscript106BR(K_{S}\rightarrow\pi^{0}e^{+}e^{-})<1.1\times 10^{-6} at 90% confidence level. A more precise measurement of branching ratio of KSπ0e+esubscript𝐾𝑆superscript𝜋0superscript𝑒superscript𝑒K_{S}~{}\rightarrow~{}\pi^{0}e^{+}e^{-} will provide better limits on the indirect CP violating contribution in KLπ0e+esubscript𝐾𝐿superscript𝜋0superscript𝑒superscript𝑒K_{L}~{}\rightarrow~{}\pi^{0}e^{+}e^{-}.

The KSπ0e+esubscript𝐾𝑆superscript𝜋0superscript𝑒superscript𝑒K_{S}~{}\rightarrow~{}\pi^{0}e^{+}e^{-} search is based on the KSsubscript𝐾𝑆K_{S} high intensity data taken in 1999. The events are selected by requiring at least four cluster in the LKR, two tracks and one vertex. Then the group of four clusters has to pass additional kinematic cuts such as the invariant mass of γγ𝛾𝛾\gamma\gamma must be within 2.5 MeV with respect to the nominal π0superscript𝜋0\pi^{0} mass, and the invariant mass of eeγγ𝑒𝑒𝛾𝛾ee\gamma\gamma must lie within 10 MeV with respect to nominal kaon mass.

The main background KSπ0e+esubscript𝐾𝑆superscript𝜋0superscript𝑒superscript𝑒K_{S}~{}\rightarrow~{}\pi^{0}e^{+}e^{-} comes from KSπD0πD0subscript𝐾𝑆subscriptsuperscript𝜋0𝐷subscriptsuperscript𝜋0𝐷K_{S}~{}\rightarrow~{}\pi^{0}_{D}\pi^{0}_{D}, where both πD0subscriptsuperscript𝜋0𝐷\pi^{0}_{D} decays into e+eγsuperscript𝑒superscript𝑒𝛾e^{+}e^{-}\gamma, and one electron and one positron are lost. This background is rejected by requiring invariant mass difference |meγmπ0|subscript𝑚𝑒𝛾subscript𝑚superscript𝜋0|m_{e\gamma}-m_{\pi^{0}}| to be greater than 30 MeV. Another source of background arises from KSπ0πD0subscript𝐾𝑆superscript𝜋0subscriptsuperscript𝜋0𝐷K_{S}~{}\rightarrow~{}\pi^{0}\pi^{0}_{D}, where πD0subscriptsuperscript𝜋0𝐷\pi^{0}_{D} decays into e+eγsuperscript𝑒superscript𝑒𝛾e^{+}e^{-}\gamma with a lost γ𝛾\gamma. Due to the origin of the electrons, their invariant mass cannot exceed pion mass. The remaining background in KSπ0e+esubscript𝐾𝑆superscript𝜋0superscript𝑒superscript𝑒K_{S}~{}\rightarrow~{}\pi^{0}e^{+}e^{-} are negligible.

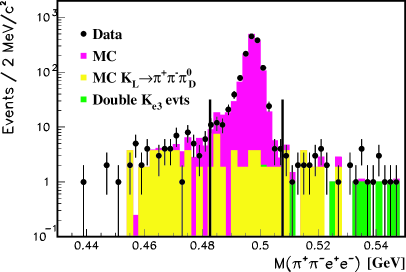
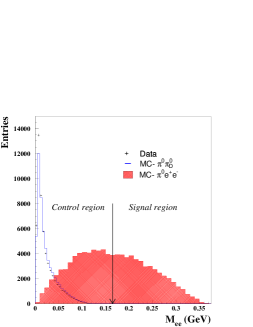
Figure 4 shows the invariant mass distribution of e+esuperscript𝑒superscript𝑒e^{+}e^{-} pair for events passing the above cuts. The events below mee<165subscript𝑚𝑒𝑒165m_{ee}<165 MeV is in good agreement with the background KSπ0πD0subscript𝐾𝑆superscript𝜋0subscriptsuperscript𝜋0𝐷K_{S}~{}\rightarrow~{}\pi^{0}\pi^{0}_{D} events. No events are observed meesubscript𝑚𝑒𝑒m_{ee} above 165 MeV. Using KSπ0πD0subscript𝐾𝑆superscript𝜋0subscriptsuperscript𝜋0𝐷K_{S}~{}\rightarrow~{}\pi^{0}\pi^{0}_{D} as a normalization channel, at 90% confidence level upper limit on the branching ratio is obtained,

BR(KSπ0e+e)<1.4×10⁷.𝐵𝑅subscript𝐾𝑆superscript𝜋0superscript𝑒superscript𝑒1.4superscript107BR(K_{S}\rightarrow\pi^{0}e^{+}e^{-})<1.4\times 10^{-7}. (2)
Refer to caption
Figure 4: Invariant mass distribution of e+esuperscript𝑒superscript𝑒e^{+}e^{-} for data (dots) and for π0πD0superscript𝜋0subscriptsuperscript𝜋0𝐷\pi^{0}\pi^{0}_{D} monte-carlo events (solid line). The expected distribution for KSπ0e+esubscript𝐾𝑆superscript𝜋0superscript𝑒superscript𝑒K_{S}~{}\rightarrow~{}\pi^{0}e^{+}e^{-} events is shown by the shaded area.

References

References

  • [1] V. Fanti et al., Phys. Lett. B 465, 335 (1999), N. Doble et al., Nucl. Instrum. Methods B 119, 181 (1996).
  • [2] J. Kambor, B.R. Holstein, Phys. Rev. D 49, 2346 (1994).
  • [3] G.D. Barr et al., Phys. Lett. B 351, 579 (1995).
  • [4] A. Lai et al., Phys. Lett. B 493, 29 (2000).
  • [5] L.M. Sehgal, M. Wanninger, Phys. Rev. D 46, 1035 (1992), Erratum: Phys. Rev. D 46, 5209 (1992).
  • [6] P. Heiliger, L.M. Sehgal, Phys. Rev. D 48, 4146 (1993), Erratum: Phys. Rev. D 60, 079902 (1999).
  • [7] A. Alavi-Harati et at., Phys. Rev. Lett. 84, 408 (2000).
  • [8] A. Lai et al., Phys. Lett. B 496, 137 (2000).
  • [9] G. D’Ambrosio, G. Ecker, G. Isidori and J.Portoles, JHEP 08, 004 (1998).
  • [10] G. Barr et al., Phys. Lett. B 304, 381 (1993).