A NEW PRECISE MEASUREMENT OF THE
MUON ANOMALOUS MAGNETIC MOMENT
The muon experiment at BNL has completed four data runs for the positive muon, beginning in 1997 and has just finished its first run for the negative muon. Recently the analysis of a 1.3 ppm result based on the 1999 run was completed and published (). The result shows a tantalizing discrepancy with the Standard Model prediction of 2.6 times the combined experimental and theoretical uncertainty. The muon experiment at BNL is ultimately aimed at measuring the anomalous magnetic moment of the muon with a relative uncertainty of 0.35 ppm.
1 Introduction
The quest for phenomena that cannot be explained by the Standard Model (SM) of fundamental interactions is a focal point of present-day particle physics. Although the SM is consistent with all available experimental data, there are increasingly strong theoretical reasons and also circumstantial evidence that point to the existence of new physics below the TeV scale . Precision experiments at low energy can probe for deviations from the SM predictions and provide complementary constraints to those obtained in high-energy collision experiments. The uncertainty principle mandates that even heavy particles — which may not yet have been discovered — make small contributions to low-energy observables, such as the magnetic moment of the muon.
In this paper, we report on the latest result of experiment E821, which is ongoing at Brookhaven National Laboratory and aims to measure the muon magnetic moment anomaly with a relative uncertainty of 0.35 parts-per-million (ppm). The experiment has been taking data since 1997 with intermediate results
| (1) | |||||
| (2) |
in good agreement with earlier measurements conducted at CERN
| (3) | |||||
| (4) |
The combination of these results is consistent with the Standard Model prediction within the combined experimental and theoretical uncertainty.
2 Theory
The magnetic moment of a particle is related to its spin,
| (5) |
According to Dirac’s theory, the proportionality constant , or gyromagnetic ratio, is equal to 2 for point-like, i.e. structureless, particles. For charged baryons differs substantially from 2, reflecting their internal structure. The electron and muon are special in that they appear to be point-like. Nevertheless, it was discovered that is slightly larger than 2 for electrons . The deviation, referred to as the magnetic moment anomaly , is defined through the relation
| (6) |
The anomaly is the radiative correction to the magnetic moment, and was first calculated in 1948 by Schwinger , predicting that, to first order, . During more than 40 years, increasingly refined experiments and equally sophisticated calculations have made the anomalous magnetic moment of the electron one of the best understood physics phenomena. The electron anomaly is now measured with an experimental uncertainty of a few parts-per-billion and is well described by QED calculations .
While the -factor of the electron has provided a testing ground for QED, the anomalous magnetic moment of the muon has provided an even richer source of information, because the magnitude of radiative corrections involving heavy virtual particles scales with the square of the lepton mass and . The contributions of virtual muons and hadrons were already demonstrated in the experiments at CERN, which have a combined uncertainty of 7.3 ppm for . This uncertainty was not sufficient to observe the contribution of the carriers of the weak interaction, the and bosons. The goal of experiment E821 is an overall uncertainty in of 0.35 ppm, which will allow the observation of the weak contributions, as well as a search for physics beyond the SM.
The SM prediction for the anomaly is traditionally calculated as the sum of three parts ,
| (7) |
The presently most accurate predictions for each of these contributions given in table 1 were taken from Ref. and references therein. The uncertainty is dominated by the hadronic contribution, which cannot be calculated from first principles and is (mostly) determined from data .
| Variable | Value () | relative contribution (ppm) |
|---|---|---|
Any contribution from “new” physics will be reflected in a measured value which deviates from this prediction. There is increasing theoretical interest in possible non-SM contributions to the muon value. Under suitable conditions, the final experimental and theoretical uncertainty will allow to set more stringent limits on possible SM extensions than obtained so far.
3 Principle of the Experiment
The experimental determination of the anomalous magnetic moment is derived from the rate at which the muon’s spin precesses in a magnetic field. When in flight, the spin precession frequency relative to the orbital (cyclotron) frequency is proportional to the product of the anomalous part of the magnetic moment and the strength of the magnetic field. The relative frequency is thus a factor 800 more sensitive to than the spin precession frequency itself.
Ideally, polarized muons are stored in a uniform magnetic field which is perpendicular to the spin direction. The spatial uniformity of the magnetic field is essential in avoiding the need for the precise measurement of the muon distribution. Thus the use of a magnetic quadrupole for vertical confinement, which a uniform magnetic field cannot provide, is prohibited. Vertical containment is therefore established with an electric quadrupole field . The relative spin precession frequency, , in the presence of both magnetic and electric fields is given by
| (8) |
For muons with the “magic” momentum ( = 3.094 GeV/), the dependence of on the electric field vanishes. The need to measure the electric field precisely is thus avoided and precise measurements of only and are sufficient to determine . It is important to note that these quantities need to be known accurately averaged over the ensemble of detected events, and not for individual muons.
The concept of experiment E821 is similar to that of the last
experiment at CERN, which is described in detail in Ref. .
Major improvements that were made compared to the CERN experiments
are
•
Higher beam intensity;
•
Direct muon injection;
•
A DC superconducting inflector;
•
The quadrupole design.
•
Circular storage aperture;
•
In vacuo field measurement;
•
Waveform Digitizers;
•
Super-ferric magnet;
•
Higher resolution detectors;
•
Scalloped vacuum chambers.
In the following sections, some of the details of the experiment are
described.
4 Creating and Storing Polarized Muons
The Alternating Gradient Synchrotron (AGS) accelerates up to 12 bunches of protons to an energy of 24.3 GeV in cycles of 2 – 3 seconds. Every 33 ms one 25 ns wide (FWHM) bunch is extracted and directed to a production target to create pions. Only pions with a momentum 1.7% above the magic momentum of 3.094 GeV/ are transported through an approximately 100 m long beamline in which they will decay, . In the pion’s center-of-mass frame, the muon’s spin is aligned with its momentum because of the pion’s spin (=0) and the uniquely defined handedness of the neutrino. Consequently, in the laboratory frame the highest energy muons are nearly 100% polarized. At the end of the beamline, muons at the magic momentum are selected by a pair of dipole magnets and collimators.
The resulting bunch of about 50,000 muons is injected into a 14.2 m diameter super-ferric storage ring through a superconducting inflector channel. The purpose of the inflector is twofold. First, its superconducting shield cancels the magnetic field of the main magnet while the beam traverses its yoke and approaches the storage orbit as close as possible. Second, a set of carefully wound coils counter-balances the effect the field-free region has on the magnetic field in the storage area.
The main field of 1.45 T is excited by three helium-cooled superconducting coils and contained in an C-shaped iron yoke. The uniformity of the field is controlled by carefully shaped and aligned pole piece segments and further optimized by inserting wedges into the air gap between the yoke and the poles. Minimization of the azimuthal variation in the field was accomplished by inserting thin ferromagnetic plates between the poles and the vacuum chamber. The transverse field variations are reduced by 2120 wires running azimuthally around the ring on the top and bottom pole surfaces and by local current loops.
The vacuum chamber inside the magnet maintains a pressure of — Torr and contains several circular 9 cm diameter collimators to define the storage volume. A circular aperture reduces the higher multipole moments of the stored beam profile. Since the average magnetic field is determined by the convolution of the magnetic field and beam distribution, this reduces the need to measure the latter to high precision. The chambers are scalloped at the inner radius to reduce pre-showering and thus help to improve the resolution with which the decay electron energy can be measured.
Direct muon injection into the storage ring is accomplished by deflecting the muon beam by 10 mrad at a quarter of a betatron wavelength from the inflector. This deflection is generated by a set of three magnetic kicker modules. Each module comprises a current loop, which guarantees a negligible effect on the main magnetic field after 20 s. The width of the pulse generated by the kickers is about 150 ns FWHM, which matches the revolution time of the ring.
In order to accommodate the kicker and inflector, the electric quadrupole field is created by four symmetrically positioned 39∘ (in azimuth) sections of two horizontal and two vertical plates each that yield a nearly pure quadrupole potential. Discharging caused by the buildup of trapped electrons originating from ionizing the residual gas in the vacuum chamber is prevented by operating the quadrupoles in pulsed mode. For up to 1.4 ms, a 20 — 25 kV voltage is applied at each plate (opposite polarities for horizontal and vertical plates). The setting and stability of the electric field is measured to 0.2%, which is sufficient to stay far away from spin and beam resonances. At this voltage, weak focusing is achieved with a field index of .
During the first 15 s, the tails of the beam distribution are scraped off by lowering the voltage of the inner and bottom plates. This will move the beam closer to the collimators, so that the edges of the distribution, which are likely to be lost later and introduce a systematic error, are removed.
5 Magnetic Field
The basic method of field measurement is the well-known proton NMR technique , which permits the absolute measurement of a local magnetic field with a precision of 0.1 ppm. The proton sample of the probes (either water or Vaseline) is “excited” with a 10 s RF pulse. The resulting free induction decay signal, which is proportional to the magnetic field strength, is measured with respect to a 61.74 MHz reference by counting the number of zero-crossings at the difference frequency of 10 — 50 kHz. A LORAN-C receiver serves as a frequency standard and has a long-time stability of and a short-time stability of better than .
Four different kinds of probes are used:
-
1.
17 probes are mounted on a movable trolley to measure the field in the storage area while under vacuum;
-
2.
360 fixed probes are mounted along the ring for field monitoring purposes and (a subset) for field regulation;
-
3.
a plunging probe serves as a secondary standard for calibrating the trolley;
-
4.
a standard probe is used for absolute calibration.
The trolley probes are mounted concentrically to cover most of the storage aperture. By driving the trolley through the vacuum chamber, the field is mapped at any azimuthal position. The transverse position of the trolley is derived from the alignment of the rails on which it rides and the azimuthal location is derived from the pulling cable and the observation of the field disturbance with the fixed probes when the trolley passes.
The fixed probes monitor time-dependent variations of the relative field strength between the trolley measurements. The final dependence was obtained by taking a weighted average of about 135 probes.
Relative calibration is obtained by measuring the field at the location of each of the trolley probes with a plunging probe. The plunging probe itself as well as some of the trolley probes are absolutely calibrated with respect to the standard probe . This is only done at the beginning and end of a data taking period since it cannot be done in vacuum. The same calibration probe was also used in the muonium hyperfine experiment for determining (see below), which eliminates (part of) the systematic error related to absolute calibration.
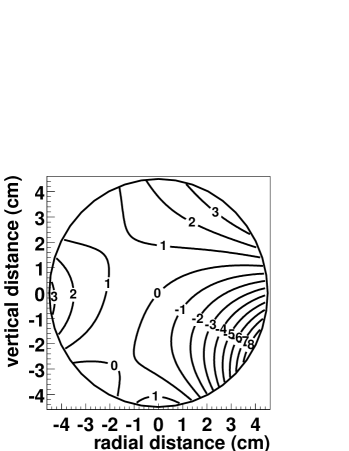
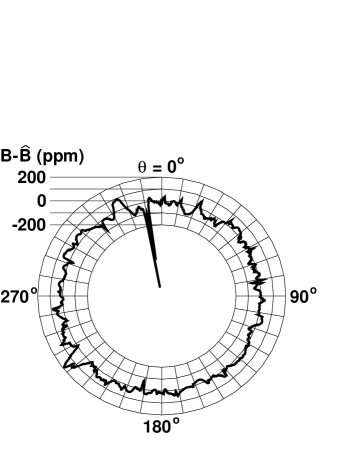
Figure 1 shows the result of a typical field measurement. The region near the inflector ( ; see fig. 1(b)) shows the fringe field caused by incomplete field compensation by the inflector, which was replaced for future data runs. This fringe field is responsible for the relatively large non-uniformity in the lower right of fig. 1(a) and constitutes one of the larger systematic errors, together with the calibration of the trolley probes and the interpolation using the fixed probes. Two largely independent analyses, which agreed to within 0.03 ppm, yielded the final result = 61,791,256 25 Hz (0.4 ppm). This is the field at the measured average beam center instead of averaged over its distribution. The resulting uncertainty, as well as other systematic uncertainties, are specified in table 2.
| Source of Uncertainties | Size [ppm] |
|---|---|
| Calibration of trolley probes | 0.20 |
| Inflector fringe field | 0.20 |
| Uncertainty from the muon distribution | 0.12 |
| Interpolation with fixed probes | 0.15 |
| Trolley measurements of | 0.10 |
| Absolute calibration of standard probe | 0.05 |
| Others | 0.15 |
| Total Uncertainty | 0.4 |
higher multipoles, trolley temperature and its power supply voltage response, and eddy currents from the kicker.
6 The Spin Precession Frequency
The muon is an unstable particle with an intrinsic lifetime of about 2.2 s, so the stored muons will eventually decay through the weak interaction, . The angular distribution of decay electrons in the center-of-mass (CM) system of the muon is spin dependent,
| (9) |
Here, is the angle between the muon spin and the electron momentum. Both the phase space factor and the parity violating asymmetry are energy dependent.
When boosted to the laboratory (LAB) system, a strong correlation between the emission angle in the CM and the energy in the LAB arises. The highest LAB energy electrons are emitted along the direction of the muon momentum. Consequently the rate of these electrons is modulated depending on the orientation of the (rotating) spin with respect to the muon momentum. Moreover, the modulation is purely sinusoidal, leading to an observed rate
| (10) |
Here, and are the LAB equivalent of and , is the relative spin precession frequency and is the dilated lifetime of 64.4 s. The energy dependent phase arises from the different flight path lengths of the decay electrons.
The energy and arrival time of the decay electrons were measured using 24 lead/scintillating-fiber calorimeters , placed at the inner radius of the ring. The signals of the four photo-multiplier tubes reading out each calorimeter block were digitized by custom 400 MHz waveform digitizers (WFD), which use the same LORAN-C frequency receiver as used for the magnetic field measurement.
In the first stage of the analysis, the arrival time and energy of the decay electrons were reconstructed from the traces recorded by the WFDs using two independent reconstruction programs. Special effort was put in understanding the effect of overlapping events and of pulses with an amplitude below the software threshold.
In the next stage of the analysis, several tests were made to ensure the quality of the data runs, AGS cycles and individual fills. Tests were made for sparking in the quadrupoles, failed extraction of the AGS, misfiring of the kicker and readout and reconstruction problems.
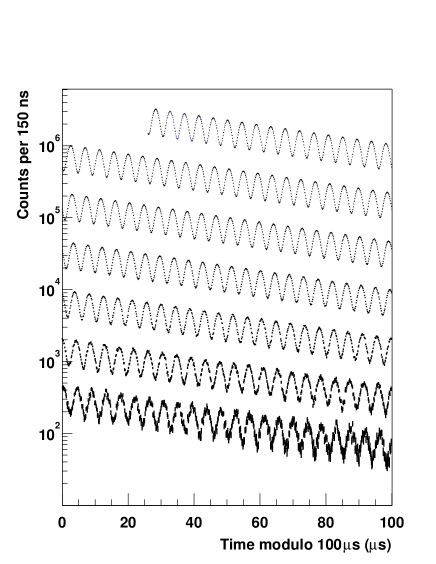
The statistical uncertainty with which can be determined from the electron rate modulation is optimal for an energy threshold of 1.8 GeV. For reasons discussed below, a slightly higher threshold of 2 GeV was used to build histograms of the number of observed electrons as a function of time. The resulting histogram containing the complete 1999 data set of about 900 million events is shown in fig. 2. During the first 25 s some of the detectors are still gated off because of the injection flash caused by beam pions.
Following injection, the rate is modulated at the cyclotron frequency because of the narrow width of the injected muon bunch, which only debunches very slowly in several hundreds of turns. This modulation is eliminated by introducing an artificial resolution and by binning the data in cyclotron periods. In dedicated studies, the revolution time and debunching characteristics were used to extract the central momentum (and thus beam center) and momentum distribution.
Fitting eq. (10) to the data does not yield an acceptable result. Deviations of the data from this ideal function form were identified to be caused by pileup, beam dynamics and gain instability. These deviations mostly cause an increase in the fitting , and affect the fitted value of only modestly. Fits are based on minimizing because log-likelihood () maximization doesn’t provide a measure of the goodness-of-fit. We define , with the bin content of the histogram and the fitted function at the center of the bin. Only bins with 40 or more counts were used in which case maximization and minimization yield equivalent results.
Four complete and independent analyses were made. In three of the four analyses, the data were fitted using a multiparameter function, based on eq. (10) with extensions to account for the deviations. In the fourth analysis, the so-called ratio method, the data was manipulated, so that it could be fitted with a function containing only three parameters. The sensitivity of the latter method to beam dynamics and gain instability is strongly suppressed compared to the other methods.
In three of the four analyses, pileup was corrected for in a statistical way. The linear dependence of the amount of pileup on the deadtime allows to extrapolate to zero deadtime from two data sets with different deadtimes. This is accomplished by extending the intrinsic pulse-finder deadtime in software. In the other analysis, the contribution of pileup was added to the function and fitted.
Two beam dynamics related distortions were identified. First, muons are being lost other than by decay. The direct influence on the spin precession frequency was negligible, but a change in the exponential decay was observed. In an independent study, based on a set of scintillator strips in front of the calorimeters, it was found that the muon loss rate relative to the decay rate could be approximated as exponential in combination with a constant (1%).
The second beam dynamics related effect was caused by coherent betatron oscillations (CBO), which occurred because the aperture of the inflector is smaller than the storage aperture, and which were enhanced by an incomplete injection kick. The radial movement and breathing of the beam and the varying radial acceptance of the calorimeters led to an easily identified modulation of the electron rate at a frequency of 470 kHz, which is the difference of the cyclotron and horizontal betatron oscillation frequencies.
Independent studies of the beam dynamics were made using a set of scintillating fiber harps, which could be inserted into the storage area. Both horizontal and vertical oscillations and breathing were observed, as well as a small contamination with protons. Similar studies were made using four straw chambers, that allowed to trace the electron back to the point at which the muon decayed and thus provided information on the beam distribution and its motions. All three multiparameter fitting method incorporated a rate modulation at the CBO frequency with a gaussian envelope with a time constant of about 100 s. It is noteworthy to mention that the CBO phase changes by 2 going around the ring, so that when all detectors are added together, the rate modulation is strongly reduced.
The gain and timing-stability of the detector system were monitored using a fiber-distributed laser system and a set of two photodiodes that served as references. The gain variation of less than 0.1% led to a change in of less than 0.04 ppm and is further reduced when detectors are added. Nevertheless, in two of the three multi-parameter analyses, a correction was applied for gain variations. In one, a time dependent energy threshold was applied, whereas in the other the effect of gain variations was accounted for in the fitting function. The time-instability attributed to less than 0.1 ppm.
| Institute | Production⋆ | Fit Start (s) | # Fit Par.† | (ppm) | |
|---|---|---|---|---|---|
| BU | PAW | 32 | 13 | ||
| BNL | PAW | 32 | 10 | ||
| UIUC | ROOT | 25–56 | 9 | ||
| UM | ROOT | 34 | 3 | ||
| ⋆ the PAW and ROOT analysis package formed the basis for the complete analysis | |||||
|
†
13 fit par: CBO, lost muons, pileup fitted;
10 fit par: CBO, lost muons, pileup corrected;
9 fit par: CBO, lost muons fixed, pileup corrected; 3 fit par: ratio of shifted time spectra |
|||||
| ‡ kHz | |||||
In table 3, the four analyses and their results are compared. The analyses underwent several internal consistency checks and were all found to be self-consistent once effects that were unaccounted for in the fitting function were considered. The differences between the four results are well within 0.5 ppm, which is the amount by which they were expected to differ based on the data overlap.
All four analyses were combined, while accounting for the data overlap, to give = 229072.80.3 Hz (1.3 ppm). This includes a correction of +0.810.08 ppm for the effects of the electric field at the muon beam center, and of vertical betatron oscillations tilting the instantaneous spin precession vector. The final result is dominated by the statistical uncertainty. The main systematic uncertainties, which were estimated from independent studies and simulations, are listed in table 4.
| Source of uncertainty | Size [ppm] |
|---|---|
| Pileup | 0.13 ppm |
| AGS background | 0.10 ppm |
| Lost muons | 0.10 ppm |
| Timing Shifts | 0.10 ppm |
| E field and vertical CBO | 0.08 ppm |
| Binning and fitting procedure | 0.07 ppm |
| Coherent betatron oscillations | 0.05 ppm |
| Beam debunching | 0.04 ppm |
| Gain instability | 0.02 ppm |
| Total Uncertainty | 0.3 ppm |
7 Results and Conclusion
In addition to and , determination of would require a value for the constant . However, since the magnetic field is measured by the (corrected) proton resonance frequency , the constant needed is , so that is given by , where and = 3.18334539(10) (0.03 ppm) . After the and analyses were finalized, separately and independently, the results were combined to yield (1.3 ppm). This in good agreement with all previous measurements (see fig. 3).
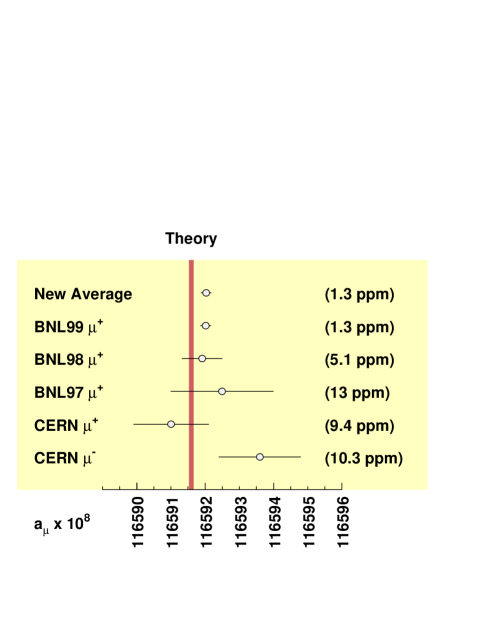
Assuming CPT symmetry, the new world average is (1.3 ppm), which deviates from the Standard Model prediction by 2.6 times the combined experimental and theoretical error,
| (11) |
Whether this tantalizing discrepancy persists or turns out to be a statistical fluke will be found out in the near future. In 2000, approximately four times more positrons were recorded as in 1999. In 2001, we completed our first measurement with negative muons, which will provide a sensitive test of CPT violation.
Acknowledgments
The author received financial support to attend this conference in the form of a European Union “Training and Mobility of Researchers Programme” grant. The work described in this paper was supported in part by the U.S. Department of Energy, the U.S. National Science Foundation, the German Bundesminister für Bildung und Forschung, the Russian Ministry of Science, and the US-Japan Agreement in High Energy Physics.
References
References
- [1] The g-2 Collaboration for 1999: Boston U.: R.M. Carey, W. Earle, E. Efstathiadis, E.S. Hazen, F. Krienen, I. Logashenko, J.P. Miller, J. Paley, O. Rind, B.L. Roberts, L.R. Sulak, A. Trofimov; BNL: H.N. Brown, G. Bunce, G.T. Danby, R. Larsen, Y.Y. Lee, W. Meng, J. Mi, W.M. Morse, D. Nikas, C. Özben, C. Pai, R. Prigl, Y.K. Semertzidis, D. Warburton; Cornell U.: Y. Orlov; Fairfield U.: D. Winn; U. Heidelberg: A. Grossmann, K. Jungmann, G. zu Putlitz; U. Illinois: P.T. Debevec, W. Deninger, F.E. Gray, D.W. Hertzog, C.J.G. Onderwater, C. Polly, S. Sedykh, M. Sossong, D. Urner; Max Planck Heidelberg: U. Haeberlen; KEK: A. Yamamoto; U. Minnesota: P. Cushman, L. Duong, S. Giron, J. Kindem, I. Kronkvist, R. McNabb, C. Timmermans, D. Zimmerman; Budker I. Novosibirsk: V.P. Druzhinin, G.V. Fedotovich, B.I. Khazin, N.M. Ryskulov, Yu.M. Shatunov, E. Solodov; Tokyo I. Tech.: M. Iwasaki, M. Kawamura; Yale U.: H. Deng, S.K. Dhawan, F.J.M. Farley, V.W. Hughes, D. Kawall, M. Grosse Perdekamp, J. Pretz, S.I. Redin, E. Sichtermann, A. Steinmetz.
- [2] P. Herczeg, in: Precision Tests of the Standard Electroweak Model, Advanced Series on Directions in High-Energy Physics, Vol. 14, edited by P. Langacker, Singapore: World Scientific, 1995, pp. 786.
- [3] H.N. Brown et al., Phys. Rev. Lett. 86, 2227 (2001).
- [4] R.M. Carey et al., Phys. Rev. Lett. 82, 1632 (1999).
- [5] H.N. Brown et al., Muon Collaboration, Phys. Rev. D 62, 091101 (2000).
- [6] J. Bailey, et al., Nucl. Phys. B 150, 1 (1979).
- [7] J.E. Nafe, et al., Phys. Rev. 71, 914 (1947), D.E. Nagl, et al., Phys. Rev. 72, 971 (1947) P. Kusch and H.M. Foley, Phys. Rev. 74, 250 (1948).
- [8] Particle Data Group, Eur. Phys. J. C 3, 1 (1998).
- [9] J. Schwinger, Phys. Rev. 73, 416 (1948) and Phys. Rev. 75, 898 (1949).
- [10] R.S. van Dyck, Jr., P. Schwinberg, and H. Dehmelt, Phys. Rev. Lett. 59, 26 (1987) and in Quantum Electrodynamics, ed. T. Kinoshita, (World Scientific, Singapore, 1990), p. 322.
- [11] V.W. Hughes and T. Kinoshita, Rev. Mod. Phys. 71, S133 (1999).
- [12] Andrzej Czarnecki, these proceedings.
- [13] Andreas Höcker, these proceedings.
- [14] A. Czarnecki and W.J. Marciano, Nucl. Phys. B (Proc. Suppl.) 76, 245 (1999).
- [15] G.T. Danby et al., Nucl. Inst. and Meth. A 457, 151 (2001).
- [16] F. Krienen, D. Loomba, and W. Meng, Nucl. Inst. and Meth. A 283, 5 (1989).
- [17] X. Fei, V.W. Hughes and R. Prigl, Nucl. Inst. and Meth. A 394, 349 (1997).
- [18] R. Prigl, U. Haeberlen, K. Jungmann, G. zu Putlitz and P. von Walter, Nucl. Inst. and Meth. A 374, 118 (1996).
- [19] S. Sedykh, et al., Nucl. Inst. and Meth. A 455, 346 (2000).
- [20] D.E. Groom, et al., Eur. Phys. J. C 15, 1 (2000).