Electroproduction of the hyperon
Abstract
Abstract
The reaction with was studied at electron beam energies of 4.05, 4.25, and 4.46 GeV, using the CLAS detector at the Thomas Jefferson National Accelerator Facility. The cos, , , and dependencies of (1520) electroproduction are presented for the kinematic region 0.9 2.4 GeV2 and 1.95 2.65 GeV. Also, the dependence of the (1520) decay angular distribution is presented for the first time. The cos angular distributions suggest t-channel diagrams dominate the production process. Fits to the (1520) t-channel helicity frame decay angular distributions indicate the parentage accounts for about 60% of the total yield, which suggests this reaction has a significant contribution from t-channel processes with either K+ exchange or longitudinal coupling to an exchanged K∗. The dependence of the (1520) production cross section is the same as that observed for (1116) photo- and electroproduction.
PACS : 13.75.Jz, 13.30.Eg, 13.30.-a, 14.20.-c
I. Introduction
Many important discoveries in nuclear and particle physics, such as CP violation, were initially observed in hadrons containing strange quarks. Current studies of strange quark phenomena are motivated by such issues as the importance of the strange quark-antiquark sea within nucleons and the predicted abundance of strange quarks within the quark-gluon plasma. The strange quark also introduces a new degree of freedom into the nuclear medium and thus provides a unique new look at conventional nuclear physics through the study of hypernuclei. Studies of strange baryon electroproduction have been noticeably missing.
During the 1970’s there were two published measurements of (1520) photoproduction [1-2], as well as one electroproduction measurement [3], and since then there have been no further published studies of these reactions. The construction of the Continuous Electron Beam Accelerator Facility (CEBAF) at the Thomas Jefferson National Accelerator Facility (Jefferson Lab) with its high duty cycle beam and modern detectors has provided a unique new opportunity to resume the study of strange baryon photo- and electroproduction. This paper reports the first measurement of (1520) electroproduction that used the CEBAF Large Acceptance Spectrometer (CLAS) in Hall B of Jefferson Lab.
One of the photoproduction measurements [1] used beam energies from 2.8 to 4.8 GeV (total center-of-mass energy from 2.5 to 3.1 GeV), and reports an exponential t-dependence dominated by t-channel exchange of the (892) meson, and not the lighter (494) meson. A measurement [2] at higher photon energies also yields an exponential t-dependence to the cross section. The lone electroproduction measurement [3] concludes the variation of the cross section with the virtual photon invariant mass from 0.1 to 0.5 GeV2 is consistent with a simple vector meson dominance model. These groundbreaking measurements were difficult due to the limited data sample sizes.
There are several motivations for further study of (1520) electroproduction. Theoretical models [4, 5] for the electroproduction of the lighter (1116) predict large contributions from the longitudinal virtual photon cross section. Similar behavior in (1520) electroproduction could result in an enhanced (494) t-channel exchange relative to the photoproduction result [1]. Such a possibility emphasizes the importance of measuring the relationship between and (494) exchange. Recently, Capstick and Roberts [6] predicted the existence of several nonstrange N∗ resonances with significant () branching ratios into the (1520) + decay channel. Extending the range of the (1520) electroproduction measurement allows an additional examination of resonance contributions to (1520) production. Furthermore, (1520) electroproduction from a hydrogen target necessitates the creation of a strange quark-antiquark pair. Although the kinematic regime studied in this work is typically associated with hadronic degrees of freedom, it is nonetheless important to search for any evidence of quark degrees of freedom in strange baryon production.
In addition to new insight into (1520) production, the current results represent a significant new step in the study of hyperon production phenomenology. For the first time, it will be possible to make quantitative comparisons of the dependencies of the (1520), (1116), and (1193) cross sections. Hopefully this information will stimulate theoretical efforts to model (1520) electroproduction, especially since currently no published theory papers discuss it apart from Ref. [6].
In the current experiment, the CLAS detector was used to study the decay angular distribution of the electroproduced (1520), as well as the dependencies on , , and the center-of-mass angles and . The data span the region of from 0.9 to 2.4 GeV2, and up to 2.65 GeV. The large acceptance and high multiplicity capabilities of CLAS make it possible to study (1520) production over this wide kinematic region. Details about the experiment and data analysis are discussed in Section II. Section III presents the results from the current analysis. In Section IV the results are summarized and compared with previous measurements and theoretical interpretations of (1116) and (1193) production.
II. Experiment
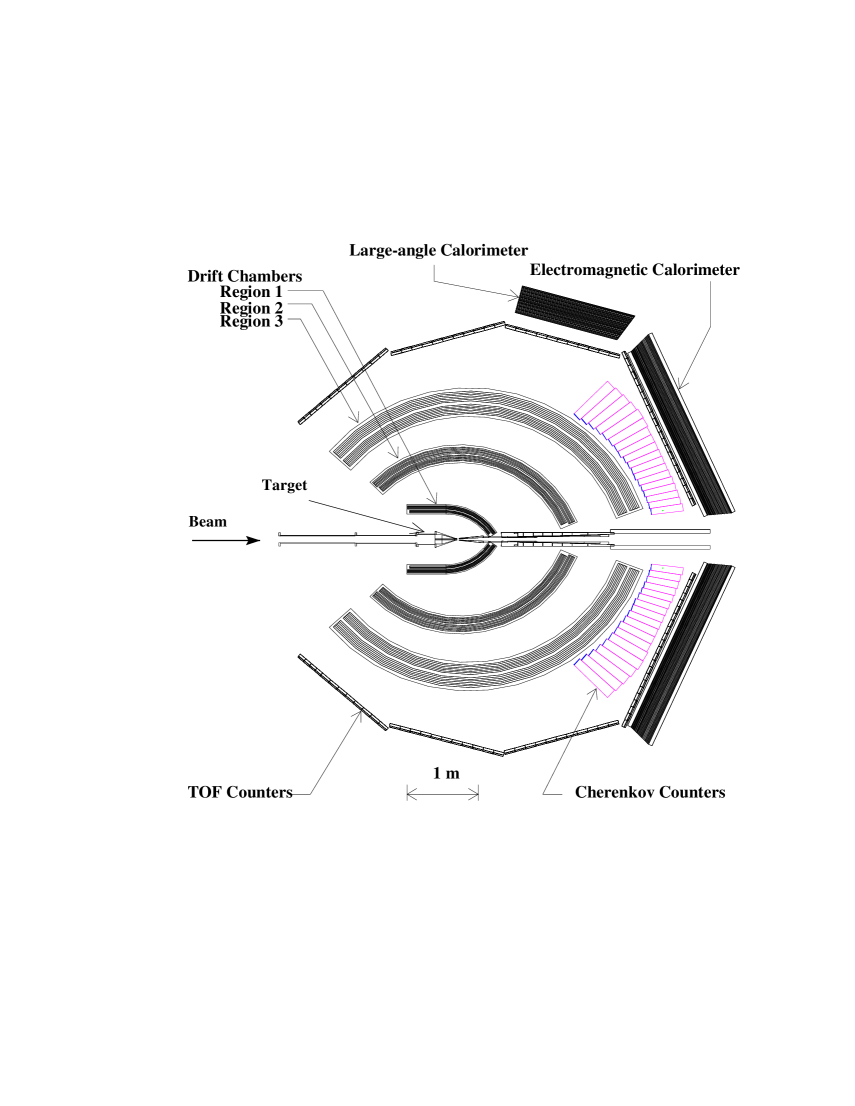
The CLAS detector [7], shown schematically in Fig. 1, is a six sector toroidal magnetic spectrometer. This design deflects charged particles toward or away from the beam line while leaving the particle’s azimuthal angle unchanged. Six wedge-shaped sectors surround the beam line. The three drift chamber [8, 9] regions per sector are used to measure the momentum vector and charge of all tracks. Each sector also contains 48 scintillator paddles [10] to determine the event start time and the hadron masses, Cherenkov detectors [11] to distinguish between electrons and negatively charged pions, and calorimeters [12, 13] to identify neutral particles, as well as to assist with the e-/ separation.
The data presented in this paper are the accumulated total for experiment E89-043 from more than 42 days of data taking during the 1998 and 1999 E1 run periods. These E1 run periods used electron beam energies of 4.05, 4.25, and 4.46 GeV, incident on a liquid hydrogen target. The electron beam current was typically 4.5 nA, which yielded a nominal luminosity of about 61033 cm-2s-1, and a total integrated luminosity of 51039 cm-2. Seventeen CLAS experiments ran concurrently during these runs, which was accomplished by the use of an inclusive electron trigger [14]. Roughly 2 billion events were recorded but less than 0.5% of them correspond to reconstructed (1520) electroproduction events.
In order to study decay angular distributions of the (1520), it is necessary to detect the scattered electron, the , and one of the decay fragments from a binary decay channel of the (1520). The final state --, with an undetected reconstructed using missing mass techniques, is best suited for study with CLAS for these E1 run periods. During these runs the toroidal magnetic field was oriented such that positively charged particles were bent away from the beam pipe. The (1520) decay channel accounts for 22.5% [15] of its total width. The main issues in identifying this decay mode of electroproduced (1520)’s are briefly discussed below, and further discussions of these topics are presented in Refs. [16] and [17].
a. Particle identification
Reconstruction of CLAS data starts with the identification of the electron. Electron candidates create a shower in the calorimeter consistent with the momentum of the track as defined by the drift chambers, and also generate a signal in the Cherenkov detector. Once an electron is identified, its path length and the TDC information from the time-of-flight scintillation paddle it traverses are used to determine the event start time. This information is then used to determine the flight time for the hadron tracks, which, combined with the reconstructed hadron momentum, determines the mass for charged tracks.
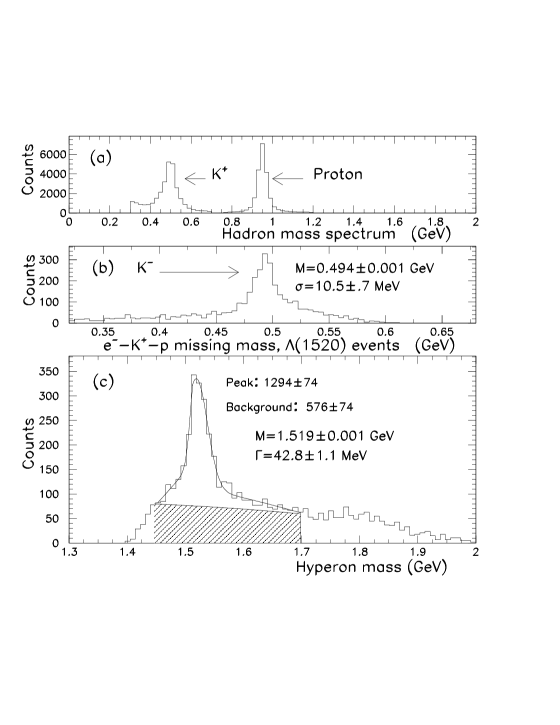
Figure 2(a) shows the hadron mass spectrum for events that contain a proton track as well as a candidate. Proton and tracks are selected by appropriate cuts on this spectrum. The mass cut is a function of the momentum of the track to compensate for the diminished mass resolution as the speed of the approaches the speed of light.
Monte Carlo simulations of CLAS indicate that events in which the decays prior to traversing the time-of-flight scintillators are the largest contribution to the background in the missing mass spectrum shown in Figure 2(b). These decays are properly modeled and accounted for in our Monte Carlo acceptance calculations.
There also exists a fairly significant monotonically decreasing background under the peak in Fig. 2(a). This is due to high momentum tracks that have a large uncertainty in their reconstructed mass. These misidentified tracks do not introduce a significant source of background to the (1520) data set, since the events containing these tracks seldom generate a missing mass consistent with the mass cut. The contribution from events containing misidentified tracks in Fig. 2(b) is less than 1% of the total yield.
The (1520) centroid and width plotted in Fig. 2(c) are based on a fit to a Gaussian with a radiated tail for the (1520) peak, and a fourth-order polynomial parameterization of the background for the hyperon mass region from 1.44 to 1.70 GeV. Given the nominal full width at half the maximum (FWHM) of 15.6 MeV [15] for the (1520) mass, the measured FWHM of 42.8 MeV shown in Fig. 2(c), indicates the intrinsic FWHM resolution of CLAS for this reaction is about 39 MeV. Therefore the width of the (1520) peak in Fig. 2(c) is dominated by the experimental resolution. The parameterization of the background is indicated by the shaded region in Fig. 2(c).
The resolution for reconstructing and is about 1%. The resolution for hadronic scattering angles varies from 0.2 to 1.2 degrees, depending on whether the scattering angle is a function of one or both of the reconstructed hadrons. For example, the reconstructed electron, , and proton are needed to calculate the (1520) helicity frame decay angles, whereas only the electron and are used to calculate the center-of-mass angle .
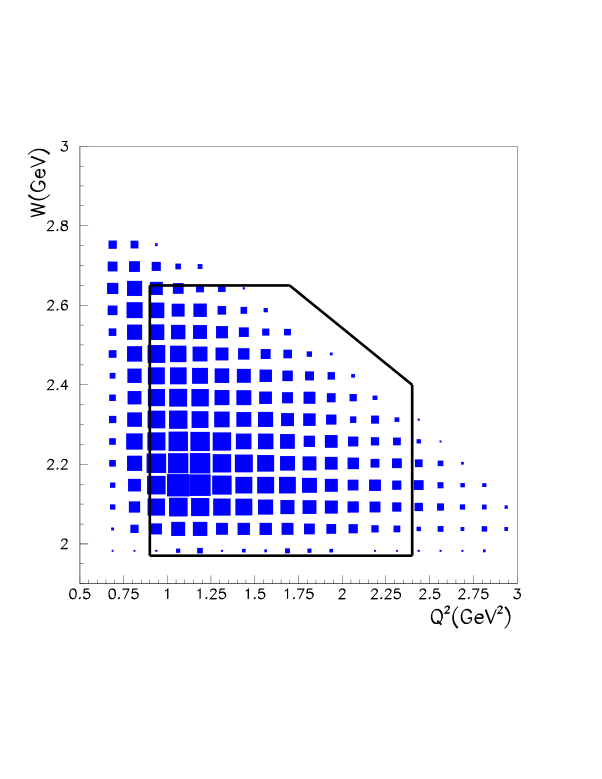
The region of versus included in this paper is shown in Fig. 3. The lower limit of 0.9 GeV2 was chosen in order to have a common cutoff for the data taken with the 4.05 and 4.25 GeV electron beam energies. The upper cutoff at 2.4 GeV2 is due to limited statistics for higher .
b. Backgrounds
Reactions that produce other hyperons, such as the , (1480), and (1600), account for the majority of the background under the (1520) peak, but the relative contributions from the individual processes are currently unknown. A complete listing of the hyperons whose mass and width have some overlap with the (1520) peak is presented in Ref. [15].
Another possible source of background in Fig. 2(c) is from the - decay of (1020) meson production. However, simulations [18] of the acceptance of CLAS for (1020) and (1520) electroproduction indicate there is little overlap between these two processes. The (1520) reaction is by far the dominant one, and the contamination due to the (1020) meson is at the level of 1-2%.
The (1520) background was studied as a function of , , cos, and . The only significant dependency in the background was for cos (and correspondingly, t), in which the background ranged from 25% of the total yield for cos1, to a 45% contribution for cos close to . The methods used to parameterize the background in the helicity frame decay angular distributions are discussed in Section III(b).
c. Cross sections
Cross sections were calculated using the following definition of the virtual photon flux factor:
| (1) |
Here is the fine structure constant, and and are the proton mass and electron beam energy, respectively. The transverse polarization of the virtual photon, , has the standard definition:
| (2) |
and is the polar scattering angle of the electron in the laboratory frame.
The (1520) cross sections shown in this paper are derived from acceptance corrected, normalized yields in the hyperon mass region from 1.492 to 1.555 GeV. These yields are scaled upward to compensate for the tails of the (1520) distribution that lie outside this interval. The acceptance of the CLAS detector was derived from a Monte Carlo simulation that folded the decay into the geometric acceptance. The cross sections are corrected for experimental dead time, track reconstruction efficiency, and contributions from the walls of the target cell. Radiative corrections were calculated following the Mo and Tsai approach [19]. The combined systematic error of the cross sections from these corrections is about 9%, and is mainly due to the geometric acceptance corrections. The yields are also scaled downward, typically by 25-30%, to correct for the presumed incoherent background under the (1520) peak. The parameterization of the hyperon background introduces an additional systematic uncertainty in the (1520) cross sections of approximately 10%.
III. Results
Details about the cos and t-distributions are the first results presented. Section III(b) presents the main results of this paper, the decay angular distributions of the (1520). Section III(c) shows plots related to the virtual photon cross sections and the scattered electron degrees of freedom.
a. cos and t-distributions
The dependence of the cross section on cos for six regions of is shown in Fig. 4. Throughout this paper cos is defined to be the center-of-mass angle subtended by the outgoing and the direction of the incident virtual photon in the rest frame of the virtual photon and the target proton. The curves plotted in these figures are the results of fits to the first four Legendre polynomials, , and the normalized fitted coefficients are summarized in Table 1. These fits provide a simple parameterization of the variation of the cos distributions with . The coefficient slowly increases in strength as approaches threshold. In addition, there is clearly some dependence to , the coefficient of the l2 Legendre polynomial, which is larger at higher than near threshold, and the fit at the highest bin only qualitatively reproduces the data. It is possible both of these effects are due to enhanced (892) exchange at higher .
If the distributions are instead plotted versus t, the squared magnitude of the exchanged meson 4-vector shown in Fig. 5, the data are fairly well parameterized by the exponential for t from to GeV2, as is shown in Fig. 6. No significant dependence to is observed. Our electroproduction value for of 2.1 0.3 GeV-2 indicates a reduction of the interaction region [16] relative to a photoproduction measurement [1], which reports an behavior for t from to GeV2.
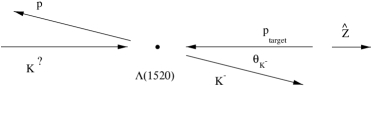
Since there is no evidence for cross section strength at large angles for any , there does not appear to be appreciable s-channel resonance contributions. Instead, both the cos and the t-distributions are consistent with the behavior expected for t-channel dominance. Therefore, the (1520) decay angular distributions will be presented in the t-channel helicity frame. The t-channel diagram for this reaction is shown in Fig. 5. Following the convention of Ref. [1], the t-channel helicity frame z-axis is defined to be antiparallel to the direction of the incident proton in the (1520) rest frame, as is illustrated in Fig. 7, and the y-axis is normal to the hyperon production plane.
b. Helicity frame distributions
The (1520) is a Jπ baryon, and its - decay is a parity conserving strong decay mode. A straightforward application of Clebsch-Gordon geometry demonstrates that for an projection the decay is characterized by a sin distribution, while an projection has a +cos distribution. These distributions are illustrated in Fig. 8.
The t-channel helicity frame cos decay angular distributions for four regions of are shown in Fig. 9. Also shown in this figure are plotted curves that are described below. The analogous distribution for the photoproduction result [1] is shown in Fig. 10. It is clear from a visual inspection of these two figures that the current results represent a significant departure from what was measured in Ref. [1]. The photoproduction angular distribution possesses a greatly enhanced parentage relative to the electroproduction results presented here. All four of the distributions shown in Fig. 9 demonstrate a large +cos contribution, which indicates the electroproduced (1520) hyperons are primarily populating the spin projection.
If (1520) electroproduction proceeds exclusively through t-channel exchange of a spinless kaon, the (1520) spin projection is always , and the ratio of the to populations is zero. On the other hand, if the reaction proceeds exclusively through the transverse exchange of a J1 vector meson, the ratio of the to spin projections, if solely determined by Clebsch-Gordon coefficients, is 3 to 1. Therefore the electroproduction distributions shown in Fig. 9 could be evidence for a roughly equal mixture of (892) and (494) contributions. In contrast, the photoproduction result [1] suggests that reaction proceeds almost exclusively through transverse (892) exchange.
Each dashed line plotted in Fig. 9 is the result of a fit to the two (1520) spin projection distributions with an additional cos term:
| (3) |
These are the only fits that were used to analyze these distributions. The solid lines in Fig. 9 are the contribution to each fit from just the two (1520) decay angular distribution terms. The spin projection parentages are derived from the ratios of the fitted parameters and . Figure 11 plots the spin projection ratios for these four regions of , along with the result from the photoproduction measurement [1]. The electroproduction ratios are summarized in Table 2.
Roughly two-thirds of the known hyperons [15] that overlap the (1520) have spin J=. Coherently combining the angular distributions from a J background with the J (1520) decay yields several interference terms possessing cos terms raised to odd powers. The cos contributions to the decay angular distributions could therefore be evidence of J background hyperons. The photoproduction decay angular distribution shown in Fig. 10 also indicates the existence of a weak cos contribution.
The J= hyperons possess flat helicity frame decay angular distributions. If a flat angular distribution is fit to the two (1520) spin projection distributions, the result will be an even mixture of the two projections, since ( + cos) + (sin)=constant. If some of the background under the (1520) peak is due to J= hyperons, it will make equal contributions to the two spin projections, and artificially shift the measured spin projection ratio closer to one. This is true regardless of whether the actual ratio for the (1520) spin projections is greater than or less than 1. Additional information about the physical processes that contribute to the background is needed to estimate this effect more quantitatively.
The t-channel helicity frame decay angular distribution for 2.43 GeV, summed over the entire range of , is shown in Fig. 12. The fit plotted in Fig. 12 includes a cos term, and indicates this term makes an important contribution. An isolated J= resonance does not possess a cos dependence, therefore, as was the case for the cos term added to the fits in Fig. 9, this cos dependence could also be due to interference effects with other hyperons.
c. , W, and Q2 distributions
The dependence on , the angle between the hadron and lepton scattering planes, is sensitive to the relative contributions of the longitudinal and transverse components of the virtual photon. This is illustrated in the following decomposition of the center-of-mass cross section,
| (4) | |||
| (5) |
The term is only an indirect measurement of the relative contributions of the longitudinal and transverse cross sections. If it makes a large contribution, we expect that both the longitudinal and transverse couplings of the virtual photon are significant. Figure 13 plots the distributions for the same four regions of Q2 shown in Fig. 9. The range of , the transverse polarization of the virtual photon, for the data presented here is from 0.3 to 0.7 with a nominal value of 0.5. The fits shown in Fig. 13 are summarized in Table 3. All four fits suggest cos contributions, indicating contributions from both the longitudinal and transverse virtual photon spin projections. However, there is a larger Q2 dependence to this term than to the ratios of the spin projections shown in Fig. 11. This demonstrates that the virtual photon L-T interference does not have a direct correspondence with the L-T decomposition of the helicity frame.
The distributions for cos 0.6, and all cos, are shown in Fig. 14. The result of a power law fit to the dependence of the total cross section is also shown in this figure. Since the cos distributions shown in Fig. 4 are forward peaked and consistent with t-channel dominance, the most likely kinematic regime to observe s-channel contributions is for larger center-of-mass angles. There are some structures in Fig. 14(a) that are absent in Fig. 14(b), but better statistical precision is needed. As was the case with a photoproduction measurement [20] of the (1116) cross section, the distribution for the (1520) electroproduction process rises steeply near threshold. The cos distribution for this region of shown in Fig. 4 suggests at least two partial waves are making significant contributions. This is not the expected behavior if this region of were dominated by a single resonance.
The dependence of the cross section for 2.43 GeV, and cos 0.2, is shown in Fig. 15. Previous measurements [3, 21 - 23] of the dependence of the (1116) cross section studied = 0∘, and the cut on cos used to generate Fig. 15 attempts to match the kinematic regimes previously studied as much as possible, given the current data set. The dependence of the lighter hyperons is customarily parameterized assuming a behavior, therefore this same function is used to parameterize the cross section shown in Fig. 15. The fitted mass shown in Fig. 15 is the same (within errors) as the mass term shown in Fig. 16 derived from the (1116) cross section [3, 21 - 23] for ranging from 0 to 4.0 GeV2.
IV. Summary and discussion of results
The electroproduction of the (1520) strange baryon was measured for from 0.9 to 2.4 GeV2, and from 1.95 to 2.65 GeV. The (1520) decay angular distributions were presented for the first time in an electroproduction measurement, along with the cos, , and t-dependencies.
Electroproduction of the (1520) appears to be dominated by t-channel processes, as does the photoproduction measurement [1]. The t-channel helicity frame angular distributions suggest longitudinal t-channel diagrams make significant contributions to electroproduction but not photoproduction. The results presented here indicate the transition between these two sets of t-channel processes occurs in the region 0 0.9 GeV2, and once the transition takes place there is little dependence to the reaction mechanism. However, it is important to keep in mind that the ranges of some other kinematic quantities do not overlap in these two measurements. For example, the difference between the photo- and electroproduction spin projections could be primarily due to different ranges. Most of the (1520) photoproduction data of Ref. [1] are from a higher region of than is presented here, and it is not unusual for the exchange of J 1 vector mesons to make a larger contribution for well above threshold. The difference could also be a consequence of different t-ranges, since Ref. [1] studied a range of t from to GeV2, far above the region of t studied in electroproduction. The CLAS detector has recently been used to measure (1520) photoproduction over the region of presented here, enabling a future direct comparison of photo- and electroproduction. In addition, once the analysis of data taken with 3.1 and 4.8 GeV electron beam energies is complete, the study of the spin projection ratios will be extended to smaller and larger values of .
It is interesting that the dependencies of the (1520) and (1116) cross sections both yield fitted mass values close to 1.65 GeV, while the (1193) cross section yields a substantially smaller value, namely 0.89 GeV [21, 24]. Therefore, it might be the case that this larger mass term is characteristic of all -hyperons. Given this possibility, it is worthwhile to revisit some of the original models, presented more than 25 years ago, that addressed the qualitative differences between (1116) and (1193) production.
Some of these first attempts [26-28] to explain the difference between the (1116) and (1193) cross sections assumed hyperon production at high is dominated by the virtual photon scattering off one of the quarks in the proton. The remaining two quarks couple into either isospin-zero or isospin-one pairings, and a few general arguments were sufficient to show the isospin-zero pairing is preferred as the Bjorken variable approaches 1.0. Therefore in these models an up quark interacts with the virtual photon, and the isospin-zero pairing of the other two quarks leads to the preference for (1116) production. This framework also predicts the (1193) cross section drops off much more rapidly with than the (1116) cross section, even for small values of at which is much less than 1.0. The fact the dependencies of the (1116) and (1520) cross sections are identical is consistent with this model, and suggests the isospin of the produced hyperon is an important quantity in determining the behavior of hyperon production.
We would like to acknowledge the outstanding efforts of the staff of the Accelerator and Physics Divisions at Jefferson Laboratory that made this measurement possible. This work was supported by the U.S. Department of Energy and the National Science Foundation, the French Commissariat à l’Energie Atomique, the Italian Istituto Nazionale di Fisica Nucleare, and the Korea Science and Engineering Foundation. We would also like to acknowledge useful conversations with F. Close, S. Capstick, and C. Bennhold. The Southeastern Universities Research Association (SURA) operates the Thomas Jefferson National Accelerator Facility for the United States Department of Energy under contract DE-AC05-84ER40150.
REFERENCES
- [1] D. Barber , Z. Physik C 7, 17 (1980).
- [2] A. Boyarski , Phys. Lett. B 34, 547 (1971).
- [3] T. Azemoon , Nuclear Physics 95, 77 (1975).
- [4] R. Williams, C. Ji, and S. Cotanch, Phys. Rev. C 46, 1617 (1992).
- [5] J. David , Phys. Rev. C 53, 2613 (1996).
- [6] S. Capstick and W. Roberts, Phys. Rev. D 58, 074011 (1998).
- [7] W. Brooks, Nucl. Phys. A 663-664, 1077 (2000); B. Mecking , in preparation.
- [8] D.S. Carman , Nucl. Instr. and Methods A 419, 315 (1998).
- [9] M. D. Mestayer , Nucl. Instr. and Methods A 449, 81 (2000).
- [10] E. Smith , Nucl. Instr. and Methods A 432, 265 (1999).
- [11] G. Adams , submitted to Nucl. Instr. and Methods A, (2000).
- [12] M. Amarian , Nucl. Instr. and Meth. A A460 (2001) 239.
- [13] M. Anghinolfi , Nucl. Instr. and Methods A 447, 424 (2000).
- [14] D. Doughty , IEEE 18, 241 (1992).
- [15] D. Groom ., The European Physical Journal C 15, 1 (2000).
- [16] K. Lukashin ., hep-ex/0101030, accepted for publication in Phys. Rev. C, (2001).
- [17] S. Barrow, CLAS-ANALYSIS Report 2000-002, 2000 (unpublished); CLAS-ANALYSIS Report 2001-004, 2001 (unpublished).
- [18] K. Loukachine, Ph.D. thesis, Virginia Polytechnic Institute, 2000.
- [19] L. Mo and Y. Tsai, Rev. Mod. Phys. 41, 205 (1969).
- [20] M. Q. Tran , Phys. Lett. B 445, 20 (1998).
- [21] C. J. Bebek , Phys. Rev. D 15, 594 (1977).
- [22] C. Brown , Phys. Rev. Lett. 28, 1086 (1972).
- [23] G. Niculescu , Phys. Rev. Lett. 81, 1805 (1998).
- [24] R. Mohring, Ph.D. thesis, University of Maryland, 1999.
- [25] C. J. Bebek , Phys. Rev. Lett. 32, 21 (1974).
- [26] F. Close, Nucl. Phys. B 73, 410 (1974).
- [27] O. Nachtmann, Nucl. Phys. B 74, 422 (1974).
- [28] J. Cleymans and F. Close, Nucl. Phys. B 85, 429 (1975).
| a0 | a1 | a2 | a3 | |
|---|---|---|---|---|
| 2.1 | 0.60.02 | 0.31.06 | 0.04.07 | 0.05.05 |
| 2.12.2 | 0.59.04 | 0.39.04 | 0.04.04 | .03 |
| 2.22.3 | 0.55.04 | 0.42.05 | 0.05.05 | .05 |
| 2.32.4 | 0.49.04 | 0.37.05 | 0.19.03 | .04 |
| 2.42.5 | 0.54.05 | 0.37.08 | 0.20.05 | .04 |
| 2.52.65 | 0.40.04 | 0.37.06 | 0.21.04 | 0.02.05 |
Table 1. The normalized coefficients of the Legendre polynomials for the fits plotted in Fig. 4. The coefficients are normalized such that they sum to unity. The uncertainty due to the parameterization of the background under the (1520) peak contributes an additional uncertainty in the coefficients of .004, which is negligible compared to the errors shown above.
| Q2 range (GeV2) | ratio () |
|---|---|
| 0.9-1.2 | .806.125 |
| 1.2-1.5 | .534.148 |
| 1.5-1.8 | .614.108 |
| 1.8-2.4 | .558.108 |
Table 2. The ratios of the spin projection parentages for the four regions of presented in Fig. 9.
| Q2 interval (GeV2) | A | B | C |
|---|---|---|---|
| 0.9 Q2 1.2 | 1.0 .07 | .10 | 0.59 .10 |
| 1.2 Q2 1.5 | 1.0 .08 | .11 | 0.10 .11 |
| 1.5 Q2 1.8 | 1.0 .07 | .10 | 0.27 .10 |
| 1.8 Q2 2.4 | 1.0 .07 | .10 | 0.46 .09 |
Table 3. Summaries of the fits shown in Fig. 13. The fits are of the form A+Bcos2+Ccos, and the entries in this table are the fitted values of the parameters with A normalized to one.