B PHYSICS AT LEP AND SLD
Recent B physics results from LEP and SLD are reviewed. In particular, results of B lifetimes, semileptonic B decays, charm counting, CKM matrix elements and mixing are presented.
1 Introduction
LEP and SLD offer favorable environments to study the detailed properties of the B hadrons. The clean environment along with precision vertexing tools, allow one to easily identify B hadrons, which have a typical decay length of about 3mm at the . The four LEP experiments have each accumulated 0.9 million events and the SLD experiment has roughly 120K events on tape. Even with a small data size, SLD remains highly competitive in B physics due to the polarized beam, small beam spot and a unique pixel based CCD vertex detector. These data sets have been used in a broad B physics program and some recent results (lifetimes, semileptonic decays, charm counting, , , and mixing) are presented in this paper.
2 B Hadron Lifetimes
The spectator model predicts that the lifetime of a heavy hadron depends only on the properties of the decaying heavy quark Q. This model fails in the charm hadron sector for which the lifetime hierarchy of is observed. Corrections to the spectator model can be calculated in the context of the heavy quark expansion and are predicted to scale with . For the B hadrons, the lifetime differences are expected to be less than 10. Hence, precise measurements of B lifetimes provide a test of our understanding of QCD in the heavy quark limit. In addition, B hadron lifetimes are important inputs to many heavy flavor analyses.
The most precise lifetime measurements are based on inclusive topological techniques where charged secondary vertices are selected to obtain a pure sample. The lifetime has also been measured using the inclusive method by selecting neutral vertices, although for the inclusive measurements, the background tends to be higher due to contamination from the other neutral B hadrons ( and B baryons). Recently, OPAL has made a measurement of lifetime using decays. The decays are reconstructed inclusively by identifying the soft pions from the decays. This approach yields the most precise lifetime measurement to date ( ps).
The lifetime measurements are most easily compared with theory through the lifetime ratios. The measurements along with theoretical predictions are shown in Figure 1. The agreement is excellent in the meson sector. However, the B baryon lifetime measurements are consistently lower than predictions. It remains to be seen whether better theoretical predictions based on lattice calculations can resolve the discrepancy.
3 B Semileptonic Branching Ratio and Charm Counting ()
A long standing puzzle in B decay physics is the discrepancy between the theoretical predictions and measurements of the B semileptonic branching ratio. A simple solution to the puzzle is to increase the expected rate of the non-semileptonic decay amplitude, thus lowering the predicted semileptonic branching fraction. There are also persistent disagreements among experiments on the value of Br(). More specifically, the measured values obtained at the pole are consistently higher than the ones obtained at .
The ALEPH collaboration has made a new measurement of the B semileptonic branching ratio using two different techniques. One is based on the lepton transverse momentum to distinquish prompt leptons from cascade charm leptons. The other technique uses the correlation between the charge of the lepton and the parent quark charge. The parent quark charge is determined by a charge estimator built using tracks in the opposite hemisphere (e.g. jet charge). Based on a sample of 886K candidates and an average B purity of about 90, the measured semileptonic branching ratios are: Br()=0.10550.00090.00240.0021model and Br()=0.08040.0014 0.0024model.
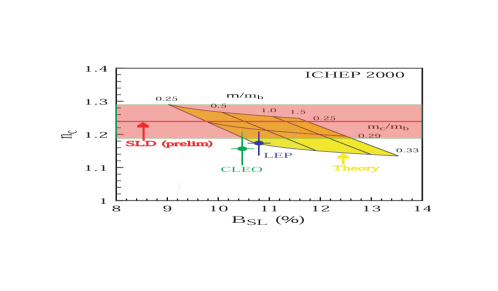
The SLD experiment has provided a new measurement of the charm production rate from B decays using a topological vertexing method. By fitting the number of reconstructed vertices per hemisphere and the vertex separation distributions to the Monte Carlo derived models, the following branching ratios are obtained: BR()=(5.61.12.0syst)% and BR()=(24.61.44.0syst)%. Assuming that the charmonia production rate is (2.40.3) and that the remaining rate is attributed to single charm hadron production, the average number of charm quarks produced per B decay is calculated to be =1.2380.055. The new value is higher than the previous world average and it is in the region preferred by theory.
The current world situation is illustrated in Figure 2 with the theoretical predictions shown in yellow. With the latest measurements and more recent calculations which included higher order QCD perturbative corrections , the experiment and theory are converging. The measured values from and are also now in good agreement.
4 The Unitarity Triangle
The major challenge in B physics for the coming decade is to perform precision measurements of the CKM matrix elements and to test the Standard Model description of CP violation. The CKM matrix elements are required to satisfy the unitarity conditions such as . This relation is commonly presented as a triangle in a complex plane with the apex of the triangle denoted by the Wolfenstein parameters and . The experimental goal is to over-constrain the triangle by measuring all three sides and three internal angles. Any detected inconsistency in the triangle relation may be a hint of new physics.
4.1 and
LEP uses both inclusive and exclusive approaches to measure the magnitude of . For the inclusive method, the partial width for semileptonic B decay to charm mesons is related to using the expression: . In the exclusive method, the value of is extracted by measuring the differential decay rate for as a function of , where is the four-momentum product of and . The differential decay rate for the decay is given by: , where is the kinematic phase space term and is the hadronic form factor of the decay. The unknown term in the expression is the form factor, however, it can be calculated in the heavy quark limit at =1 which corresponds to the scenario where the is at rest in the rest frame. Experimentally, one measures the differential decay rate near the kinematic endpoint and extrapolates to =1 to obtain the value of . Results from the inclusive and exclusive measurements are in good agreement. The combined results of the four LEP experiments gives .
ALEPH, DELPHI, and L3 collaborations have recently extracted the value of from the measurements of . The expression relating to the semileptonic transition has been derived in the context of the heavy quark expansion and is given as follows: . The inclusive method has the advantage of larger statistics and less model dependence compared to the exclusive and lepton endpoint analyses. The combined average of the three analyses gives .
4.2 B Mixing
Measuring the oscillation frequency is the most direct way to extract the CKM matrix element . The oscillation frequency, , has been measured to within a few percent. However, the extraction of from is severely limited by theoretical uncertainties of about 20%. The problem can be circumvented if one measures the ratio of and , where is the oscillation frequency in the system. As shown in equation 1, in the ratio, many theoretical uncertainties cancel and that allows one to extract to about 5%.
| (1) |
Experimentally, three basic ingredients are needed to study the time dependent oscillations: 1.) select a sample enriched in decays, 2.) determine the flavor of the B meson at production and decay and 3.) recontruct the proper decay time. The oscillation frequency is expected to be large in the Standard Model and no direct observation (maybe a hint) has been established yet. Nevertheless, a limit on is a strong constraint on the apex of the Unitarity triangle (a lower limit on translates to an upper limit on ).
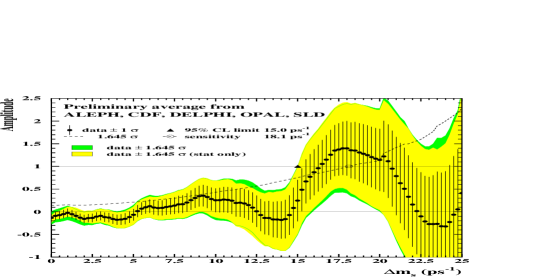
LEP and SLD have carried out complementary programs to search for oscillations. A wide variety of techniques from the fully inclusive SLD charge dipole to the fully exclusive reconstruction at ALEPH and DELPHI have been studied. The results have been combined based on the amplitude fit method. The world amplitude plot combining LEP, SLD and CDF results is shown in Figure 3. The result excludes 15 at the 95% confidence level. The most significant deviation from the amplitude of zero occurs at about 17 . The significance of the structure has been evaluated using toy Monte Carlo and is estimated to be consistent with a fluctuation at the 3% level.
5 Conclusion
LEP and SLD have made significant contributions in B physics over the past few years. The topics discussed in this paper represent only a small fraction of heavy flavor physics that have been studied at the pole. As this paper is being written, many results are still being finalized. The B physics era at LEP and SLD is not over yet. Stay tuned.
References
References
- [1] ALEPH, DELPHI, L3, OPAL, CDF, and SLD Collaborations, CERN-EP-2000, SLAC-PUB-8492, hep-ex/0009052.
- [2] G. Abbiendi et al. [OPAL collaboration], Phys. Lett. B 493, 266 (2000), hep-ex/0010013.
- [3] G. Bellini, I.I. Bigi and P.J. Dornan, Phys. Rep. 289 (1997).
- [4] N. Marinelli et al. [ALEPH collaboration], ALEPH 2000-069 (2000).
- [5] K. Abe et al. [SLD collaboration], SLAC-PUB-8686 (2001).
-
[6]
E. Bagan, P. Ball, B. Fiol and P. Gosdzinsky,
Nucl. Phys. Lett B 351 546 (1995);
M. Neubert, C.T. Sachrajda, Nucl. Phys. B 483 339 (1997). - [7] H.G. Moser and A. Roussarie, Nucl. Instrum. Methods A 384, 491 (1997).
- [8] B Oscillations Working Group 2000, http://www.cern.ch/LEPBOSC/