Super-Kamiokande atmospheric neutrino results
Toshiyuki Toshito
for the Super-Kamiokande collaboration
Kamioka Observatory, Institute for Cosmic Ray Research,
University of Tokyo, Japan.
present address: Department of physics, Nagoya university, Japan.
We present atmospheric neutrino results from a 79 kiloton year (1289 days) exposure of the Super-Kamiokande detector. Our data are well explained by 2-flavor oscillations. We have been attempting to discriminate between the possible oscillating partners of the muon neutrino as being either the tau neutrino or the sterile neutrino. Pure oscillation is disfavored at 99% C.L.. Moreover, we performed the appearance search for charged current tau neutrino interactions in the upward-going samples. Our data is consistent with appearance at roughly the two-sigma level.
Talk presented on XXXVIth Rencontres de Moriond
Electroweak Interactions and Unified Theories
10-17 March 2001.
1 Introduction
Atmospheric neutrino are produced as decay products in hadronic showers resulting from collisions of cosmic-rays with nuclei in the upper atmosphere. Production of electron and muon neutrino is dominated by the processes followed by That gives an expected ratio of the flux of to the flux of of about 2. Vertically downward-going neutrinos travel about 15km while vertically upward-going neutrinos travel about 13,000km before interacting in the detector. Thanks to good geometrical symmetry of the earth, we can expect up-down symmetry of neutrino flux. Details in prediction of atmospheric neutrino flux is discussed on Ref. 1. Neutrino oscillation occurs if a finite mass difference and mixing angle exists. The oscillation probability between two neutrino flavors is given by , where is the mixing angle, is the flight length of the neutrino, is the neutrino energy, is the mass squared difference. The range of energy of observable atmospheric neutrino is from a few hundred MeV to the order of 100GeV. The broad energy spectrum and flight distances makes measurement of atmospheric neutrino sensitive to neutrino oscillation with down to the order of . Several recent underground experiments report atmospheric neutrino results in terms of neutrino oscillation[2, 3, 4]. This paper reports on recent results of the Super-Kamiokande.
| sub-GeV () | ||
|---|---|---|
| Data | MC(Honda flux) | |
| 1ring -like | 2864 | 2668 |
| 1ring -like | 2788 | 4073 |
| multi ring | 2159 | 2585 |
| Total | 7811 | 9326 |
| multi-GeV FC() | ||
|---|---|---|
| Data | MC(Honda flux) | |
| 1ring -like | 626 | 613 |
| 1ring -like | 558 | 838 |
| multi ring | 1318 | 1648 |
| Total | 2502 | 3099 |
| Partially Contained | ||
| Total | 754 | 1065 |
2 Event sample
Super-Kamiokande is a 50 kiloton water Cherenkov detector constructed under Mt. Ikenoyama located at the central part of Japan, giving it a rock over-burden of 2,700 m water-equivalent. The fiducial mass of the detector for atmospheric neutrino analysis is 22.5 kiloton. Neutrino events interacting with the water are observed as fully-contained (FC) or partially-contained (PC) events according to the amount of anti-counter activity. FC events with only one reconstructed ring are subdivided into -like and -like based on likelihood analysis of the reconstructed Cherenkov ring. Our 1289 live-days data are summarized in Table 1 and their zenith angle distributions are shown in Figure 1. The flavor ratio is evaluated by taking the double ratio using MC expectation without oscillation as: The observed values are for sub-GeV and for multi-GeV samples. These small double ratio is consistent with our previous result[2] and indecates a deficit of muon neutrino explained by neutrino oscillation. Neutrino events interacting with rock surrounding the detector can be observed as upward through going muons or stopping muons. Details in the analysis can be found on Ref. 2.
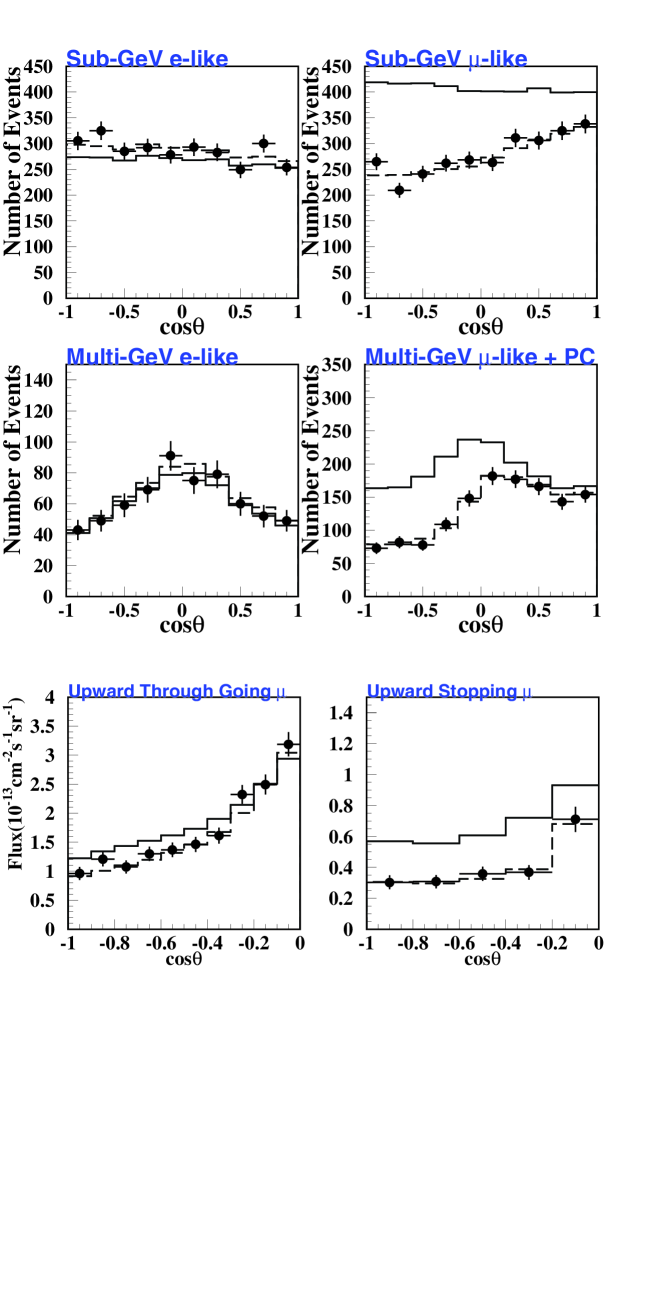
3 oscillation analysis
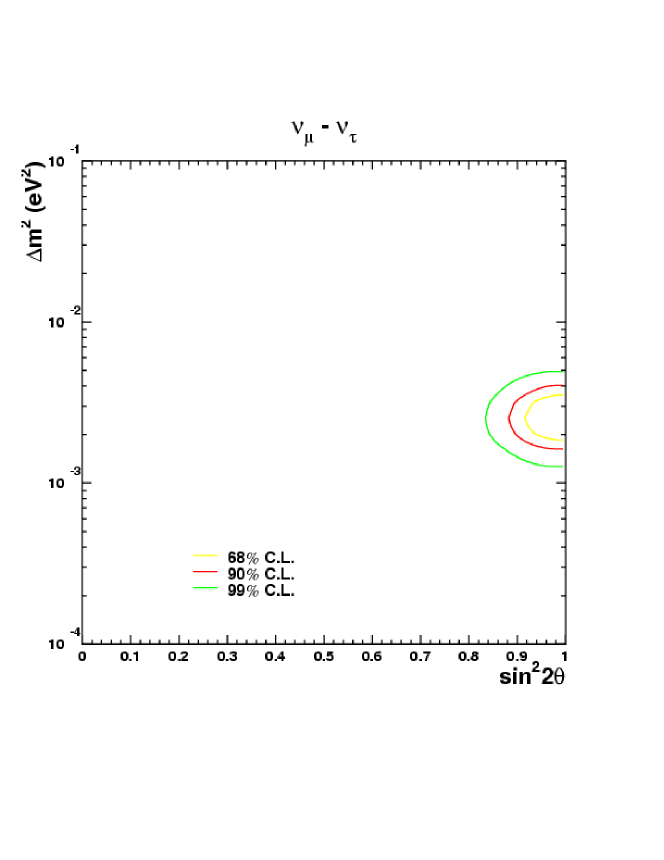
Allowed oscillation parameter region using contained and upward going muon samples is shown in Fig. 2. The minimum including unphysical region is found to be 142.1 with 152 degrees of freedom (d.o.f.) at , . The deficit of upward going -like data is well explained by assuming oscillation (Figure 1). for no oscillation was found to be 344.1 for 154 d.o.f.
4 Study on and
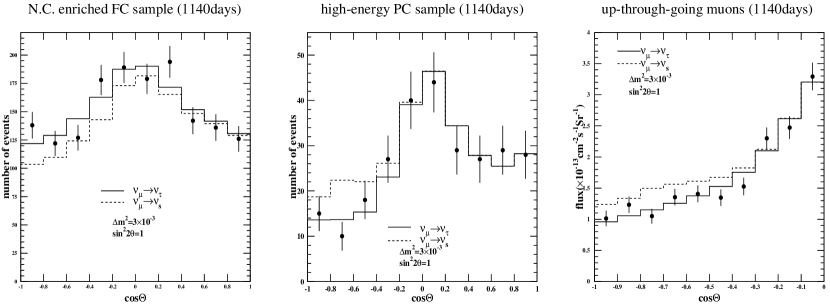
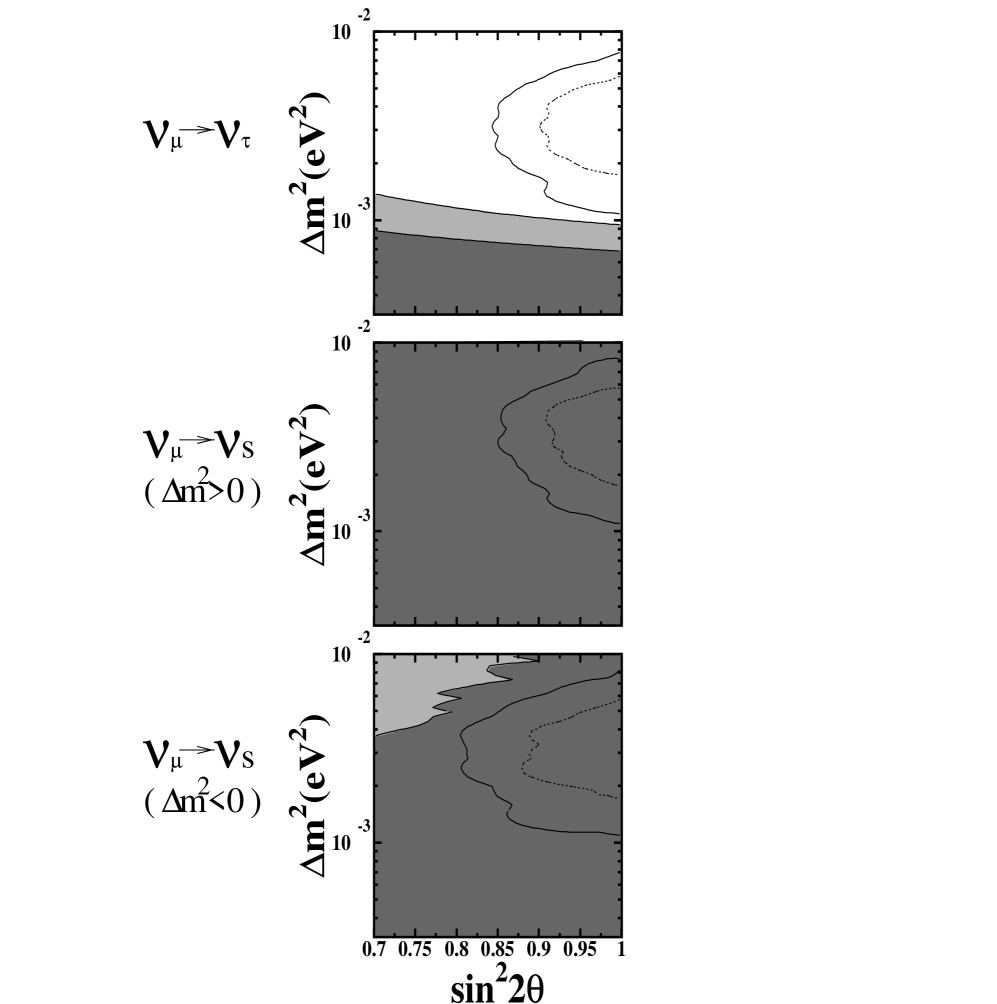
Some models predict that oscillates into “sterile” neutrino () that does not interact even via neutral current (NC). If the observed deficit of is due to oscillation, then the number of events produced via NC interaction for up-going neutrino should also be reduced. Moreover, in the case of oscillation, matter effect will suppress oscillation in the high energy (GeV) region[5]. We used the following data sample to observe these effects: (a) NC enriched sample; (b) the high-energy ( 5GeV) PC sample; and (c) up-through-going muons. Zenith angle distributions for each sample is shown in Fig. 3. The hypothesis test is performed using the up()/down() ratio in samples (a) and (b) and the vertical()/horizontal() ratio in sample (c). Fig. 4 shows excluded regions obtained by combined ((a),(b)and(c)) analysis along with the allowed regions from 1ring-FC sample analysis assuming and . The results show that pure oscillation is disfavored at 99%.
5 Search for charged current
We performed appearance search for charged current (CC) . In this analysis we assumed that 2 flavor oscillations happen at and . The difference between CC and others appear in the energy spectrum, number of charged pions in the final state, fraction of missing energy with respect to neutrino energy and so on. We have done three different analysis to enrich CC . The first one is likelihood method using parameters as visible energy ,number of ring ,number of decay electron and so on. The second one is neural network method using similar parameters which are used in the first analysis. The third analysis is likelihood method using parameters as energy flow and event shape. events appear as upward going events. Our analyses are optimized by MC and looking at only downward going events in data in which no signals are expected in order to perform blind analyses. CC events are observed as the excess of upward-going events in the zenith angle distributions if we consider only the contribution of , and NC. Results of there analyses are summarized in Table 2. MC predicts 74 CC events so far. Each result of three analyses and MC expectation agrees well within the statistical error. Zero appearance is disfavored at roughly the two-sigma level. The three analyses are highly correlated with each other, and thus cannot be combined in an independent way to increase the significance.
| analysis | 1 | 2 | 3 |
|---|---|---|---|
| number of CC | |||
| efficiency | 0.42 | 0.45 | 0.32 |
| number of CC (efficiency corrected) |
6 Summary
Super-Kamiokande results from 1289 days of contained events and up-going muons events give 90% C.L. allowed parameter regions of and . Pure oscillation is disfavored at 99% C.L.. According to the results of search for charged current events, our data is consistent with appearance at roughly the two-sigma level.
References
- [1] M. Honda et al., Phys. Rev. D52, 4985 (1995); V. Agrawal et al., Phys. Rev. D53, 1313 (1996).
- [2] Y. Fukuda et al., Phys. Lett. B433, 9 (1998); Phys. Lett. B436, 33 (1998); Phys. Rev. Lett. 81, 1562 (1998); Phys. Rev. Lett. 82, 2644 (1999); Phys. Lett. B467, 185 (1999); S. Fukuda et al., Phys. Rev. Lett. 85, 3999 (2000).
- [3] M. Ambrosio et al., Phys. Lett. B434, 451 (1998).
- [4] W.W.M.Allison et al., Phys. Lett. B391, 491 (1997).
- [5] E. Akhmedov et al., Phys. Lett. B300, 128 (1993); P. Lipari and M. Lusignoli, Phys. Rev. D58, 73005 (1998); Q. Y. Liu and A. Yu. Smirnov, Nucl. Phys. B524, 505 (1998); Q. Y. Liu et al., Phys. Lett. B440, 319 (1998).