A. Alavi-Harati
12
T. Alexopoulos
12
M. Arenton
11
K. Arisaka
2
S. Averitte
10
R.F. Barbosa
7,∗
A.R. Barker
5
M. Barrio
4
L. Bellantoni
7
A. Bellavance
9
J. Belz
10
R. Ben-David
7
D.R. Bergman
10
E. Blucher
4
G.J. Bock
7
C. Bown
4
S. Bright
4
E. Cheu
1
S. Childress
7
R. Coleman
7
M.D. Corcoran
9
G. Corti
11
B. Cox
11
M.B. Crisler
7
A.R. Erwin
12
R. Ford
7
A. Glazov
4
A. Golossanov
11
G. Graham
4
J. Graham
4
K. Hagan
11
E. Halkiadakis
10
J. Hamm
1
K. Hanagaki
8
S. Hidaka
8
Y.B. Hsiung
7
V. Jejer
11
D.A. Jensen
7
R. Kessler
4
H.G.E. Kobrak
3
J. LaDue
5
A. Lath
10
A. Ledovskoy
11
P.L. McBride
7
P. Mikelsons
5
E. Monnier
4,†
T. Nakaya
7
K.S. Nelson
11
H. Nguyen
7
V. O’Dell
7
M. Pang
7
R. Pordes
7
V. Prasad
4
X.R. Qi
7
B. Quinn
4
E.J. Ramberg
7
R.E. Ray
7
A. Roodman
4
M. Sadamoto
8
S. Schnetzer
10
K. Senyo
8
P. Shanahan
7
P.S. Shawhan
4
J. Shields
11
W. Slater
2
N. Solomey
4
S.V. Somalwar
10
R.L. Stone
10
E.C. Swallow
4,6
S.A. Taegar
1
R.J. Tesarek
10
G.B. Thomson
10
P.A. Toale
5
A. Tripathi
2
R. Tschirhart
7
S.E. Turner
2
Y.W. Wah
4
J. Wang
1
H.B. White
7
J. Whitmore
7
B. Winstein
4
R. Winston
4,‡
T. Yamanaka
8
E.D. Zimmerman4
(KTeV Collaboration)
1 University of Arizona, Tucson, Arizona 85721
2 University of California at Los Angeles, Los Angeles, California 90095
3 University of California at San Diego, La Jolla, California 92093
4 The Enrico Fermi Institute, The University of Chicago,
Chicago, Illinois 60637
5 University of Colorado, Boulder, Colorado 80309
6 Elmhurst College, Elmhurst, Illinois 60126
7 Fermi National Accelerator Laboratory, Batavia, Illinois 60510
8 Osaka University, Toyonaka, Osaka 560-0043 Japan
9 Rice University, Houston, Texas 77005
10 Rutgers University, Piscataway, New Jersey 08854
11 The Department of Physics and Institute of Nuclear and
Particle Physics, University of Virginia,
Charlottesville, Virginia 22901
12 University of Wisconsin, Madison, Wisconsin 53706
(Submited to Physical Review Letters
)
We present the first measurement of the form factor ratios
(direct axial-vector to vector), (second class current) and (weak magnetism)
for the decay using the KTeV (E799) beam line and detector at Fermilab.
From the polarization
measured with the decay and the correlation,
we measure to be , assuming the (flavor) values for and .
Our results are all consistent with exact symmetry.PACS numbers: 13.30.Ce, 14.20.Jn
The study of hyperon beta decay plays a fundamental role in discerning
the structure of hadrons.
The decay is identical to the well measured decay
except that the valence quarks are replaced by quarks
in the initial and final state baryons.
In the limit of exact (flavor) symmetry the only differences
between these processes arise from the
different baryon masses and Cabibbo-Kobayashi-Maskawa (CKM) matrix elements.
Modifications to the strong interaction dynamics
due to the difference between the
and quark masses can modify
the form factors from their values.
Different models for symmetry breaking,
using experimental data from other
hyperon beta decays, predict
different values for the
form factors of the decay [5, 6].
The general transition amplitude for the semileptonic decay of
a spin 1/2 baryon () is:
(1)
(2)
where
(3)
(4)
(5)
Here is the Fermi coupling constant,
is the appropriate CKM matrix element,
and is the mass of the initial baryon.
When and appear
in the transition amplitude, they are always
multiplied by the electron mass divided by . We therefore
neglect them. For the predictions from exact symmetry
(the Cabibbo Model) [7] are:
, (from ),
, (no second class current).
Deviations from exact symmetry
arising from the differences in the quark masses
can modify the
values of the axial-vector form factors [5, 6] by up to 20%.
The KTeV (Fermilab E799) experiment reported the
first observation [8] of the decay .
The data presented here were collected
during a later four week period of running in 1997
using an improved trigger.
The KTeV neutral beam is produced
by an 800 GeV/ proton
beam hitting a 30 cm BeO target at
an angle of 4.8 mrad. Collimators define two square sr
secondary beams. Photons in the beams are converted by a cm
lead absorber, and charged particles are swept
out of the beam by a series of magnets.
The sweeping magnets also serve to precess the polarization of the
to the vertical direction. The polarity of
the final sweeping magnet is regularly flipped
so as to have equal amounts of polarized in opposite directions, making the
ensemble average of the polarization negligible.
An evacuated decay volume extends from 94 m to 159 m
downstream of the target. Downstream of the decay volume is
a charged particle spectrometer consisting of an analysis magnet and
four drift chambers, two upstream and
two downstream of the magnet,
followed by a CsI electromagnetic calorimeter.
The neutral beams pass through two holes in the calorimeter.
Other components of the KTeV detector used here are
the photon vetoes
and the system of transition
radiation detectors (TRD).
Details of the detector and trigger system can be found
elsewhere [8].
The decay chain observed here is ,
with and .
The final state consists of five particles: a high momentum
proton which travels through one of the calorimeter beam holes,
a neutrino which is unobserved, an electron
and two photons which are required to hit the calorimeter.
The trigger selects events with a high
momentum positively charged track (proton) traveling through one of the
beam holes, an opposite charged track (electron) in the CsI calorimeter,
and two energy clusters () not associated with charged tracks.
The decay is reconstructed by finding the
longitudinal position of the decay ()
from the energies and positions of the
photon clusters in the calorimeter using the mass as a constraint.
The photon energies are required
to be at least 3 GeV and their positions to be at least 1.5 cm
away from the edge of either beam hole.
The momentum of the is determined from
the extrapolated position of the proton at .
Then the proton and momenta are added to
give the momentum of the . Finally, the trajectory
is traced back to its closest approach to the electron track,
forming the vertex.
To reduce background from kaon decays, the proton momentum is required to be
both between 120 GeV/ and 400 GeV/ and greater than times the electron
momentum. For electron identification (rejection), we accept only those
events in which the energy of the calorimeter cluster associated with the
negative track is within 10% of the track momentum. Also, we require a
probability of less than 0.1 for the TRD signal associated
with the negative track.
FIG. 1.: The mass peak, after all selection
criteria have been applied.
The background to the left of the peak is due
to decays (followed by or ).
Since is the only source of in the beam (is kinematically forbidden),
signal events are identified by
having a proton-mass within 15 MeV/
of the nominal mass.
To remove decays, we require that the
invariant mass is greater than 0.5 GeV/, or
that is at least 3 m
downstream of
the vertex.
events are suppressed by selecting events with
a invariant mass greater
than 0.57 GeV/.
Photon conversions in the drift chambers upstream
of the analyzing magnet are reduced by rejecting events
with an extra in-time hit in the horizontal views of these chambers.
To reduce background
from , we reject events with an electron track upstream
segment projected to the CsI calorimeter within
2 cm of a neutral cluster. For events the vertex is always at
or downstream of vertex within the 1 m measurement error, but for kaon background events
there is no relation between the longitudinal
positions of the observed false
and vertices.
Thus the longitudinal position of
the vertex is required to be no more than
6 m upstream of the vertex, and no
more than 40 m downstream of the vertex.
We calculate the transverse momentum of the
vertex () by taking the component of the total observed
momentum transverse to the line connecting the target
to the vertex.
Events where the magnitude of is larger than the
energy of the neutrino in the frame do not
have a physical solution for the neutrino momentum
and are therefore removed.
Signal events are identified by
having a proton-mass within 15 MeV/
of the nominal mass (Fig. 1) [9].
After the application of all selection criteria, we
have events in the signal region. We estimate
background events under the mass peak.
These events are almost entirely due
to decays with an accidental photon
in the detector (3.4 events), and decays with
two accidental photons in the detector (2.0 events).
We estimate 0.7 background events come from
with and ,
0.6 events from , and 0.7 events from other sources.
Since the average polarization in our data sample
is negligible, only four kinematic
variables are needed to describe the signal completely.
The process can be described by the
energy of the electron in the frame and the angle between the
electron and neutrino in the frame.
The polarization of the can be described
by the angle between the proton and
the electron,
and the angle between the proton and the
neutrino in the frame.
The usefulness of the final state polarization
is greatly enhanced by the large asymmetry
of the decay ().
Since the neutrino is unobserved, we cannot unambiguously reconstruct
the directions in the center of mass. However, assuming the observed
is equal and opposite to the transverse momentum of
the neutrino,
we can obtain unambiguous angular variables transverse to the direction
of the momentum. Following Dworkin
[10], we consider the decay sequence
(6)
where we have introduced the fictitious particle .
We then construct angular variables out of these
transverse quantities. Denoting quantities in the
rest frame with an asterisk, we have the transverse momenta of the
electron, proton, and neutrino in the frame:
, and
which is approximately equal
to since the and momenta are nearly parallel.
The magnitudes of the momenta in the frame are calculated
to obtain the unambiguous kinematic quantities:
(7)
which correspond to the polarization of the along the
neutrino direction, and the electron-neutrino correlations,
respectively. The kinematic quantity corresponding
to the proton-electron correlation
is , the cosine of the angle between the proton and the
electron in the frame. The one dimensional
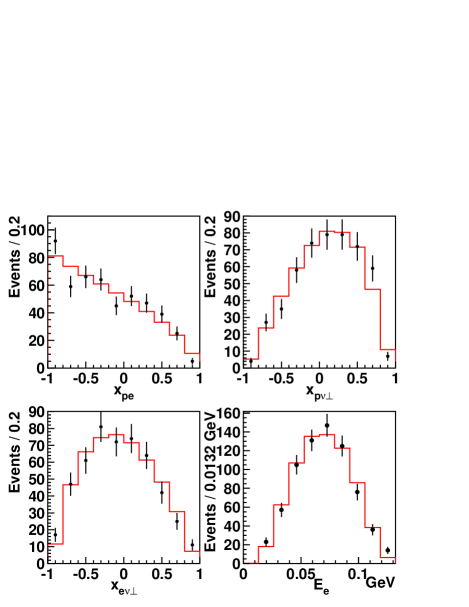
distributions for , and are shown in Fig 2.
FIG. 2.: The three variables used to fit and ,
and the energy spectrum of the electron in the frame
(used to determine ). The points
are data and the histogram is our Monte Carlo simulation with
and .
To determine , rather than calculate the asymmetries
individually, we perform a maximum likelihood fit
for using , and . We create a
histogram for data,
and create corresponding histograms for
different Monte Carlo (MC) values of .
Simulated events are reconstructed
in the same manner as data events,
and different MC values of are obtained
by re-weighting the reconstructed MC events
according to the
differential decay rate [11, 12]
using the generated MC kinematic variables.
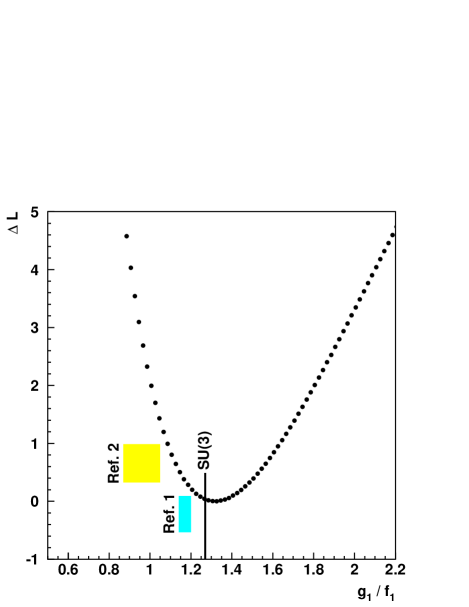
We then calculate the log likelihood for each .
The central value is the value of which maximizes the total
log likelihood (), with the standard errors being determined by
change in which changes by 1/2 (Fig. 3).
After correcting
for background,
our final value for is .
As a check of our Monte Carlo simulation,
we measure the two body asymmetry product with a sample of 70 000 events.
We measure to be
which is consistent with its
value of
[13].
The dominant contribution to the systematic error is
due to the uncertainty in the background. Other systematic
errors are estimated by changing quantities in our detector
commensurate with their
observed deviations from the data (Tab. I).
The systematic error on due to the mass shift is found to be negligible
by comparing MC simulations with masses of 1.3149 GeV/
and 1.3155 GeV/.
Source of Uncertainty
Error on
Background
0.039
Beam Shape
0.015
MC Statistics
0.020
DC Alignment
0.020
Lifetime ()
0.009
CsI Energy Scale ()
0.009
Error on ()
0.013
Total Systematic Error
0.054
TABLE I.: Systematic Error for
Radiative corrections have been explicitly determined
not to affect the final state polarization and
electron-neutrino correlation in hyperon beta decays [14].
The standard dependence of and is used [14],
neglecting the dependence of and changes the
measured value for by .
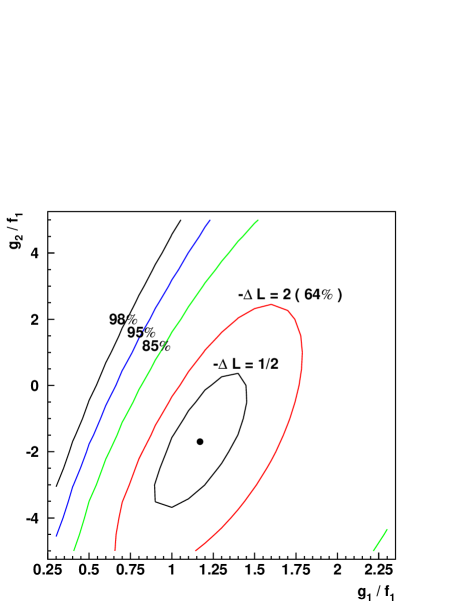
If we relax the requirement that , and fit the distributions
to and simultaneously, we see no evidence for a
non-zero second class current term (Fig. 4),
measuring
and .
Using our measured , and assuming ,
we then determine the value for using
the electron energy spectrum in the frame (Fig. 2). The beta spectrum is the only
kinematic quantity that depends on
to lowest order in .
For the measurement, we do not discard events where the
magnitude of is greater than
the energy of the neutrino in the frame.
Using a maximum likelihood method, we find the value for is .
FIG. 3.: Maximum likelihood fit to .
The shaded bands indicate the range of the theoretical predictions
found in [5, 6], the vertical line is the exact value.
The systematic errors for and are
determined in a similar manner as those for , however,
a 0.6 MeV/ shift in the mass changes by
0.25, and there is also
an additional error of 0.3 on due to the statistical error
of .
In conclusion, we have made the first measurement of for the
decay , and found that assuming both that no
second class current is present and that the weak
magnetism term has the exact value.
By using
the electron-neutrino correlation and the final state polarization
of the via its two body decay ,
we are able to determine
both the sign and the magnitude of . Our result agrees well with
the exact prediction. It therefore favors
breaking schemes that predict small corrections to .
Furthermore,
if we relax the constraint that , and simultaneously fit
for and , we see no evidence for
a second class current term but the uncertainties are large.
Our analysis of the electron energy
spectrum in the frame
gives a value for that is consistent
with the Conserved Vector Current prediction.
FIG. 4.: Maximum likelihood fit to and .
We gratefully acknowledge the support and effort of the Fermilab
staff and the technical staffs of the participating institutions for
their vital contributions. This work was supported in part by the U.S.
Department of Energy, The National Science Foundation and The Ministry of
Education and Science of Japan.
REFERENCES
[1]
[2] Permanent address University of São Paulo,
São Paulo, Brazil.
[3] Permanent address C.P.P. Marseille/C.N.R.S., France.
[4] To whom correspondence should be addressed.
Electronic address: r-winston@uchicago.edu
[5] P. G. Ratcliffe, Phys. Rev. D 59, 014038 (1999).
[6] R. Flores-Mendieta et al., Phys. Rev. D 58, 094028 (1998).
[7] N. Cabibbo, Phys. Rev. Lett. 10, 531 (1963).
[8] A. Affolder et al., Phys. Rev. Lett. 82, 3751 (1999).
The trigger used for the present data was an improved version of the one
described in this earlier paper. Further details can be found in S. Bright, Ph.D. thesis,
The University of Chicago (2000).
[9] We observe that the mean mass is MeV/
higher than its nominal value; this shift is also seen in the
mass from (with ) decays. Shifting the mass in the
Monte Carlo has a negligible effect on and .
[10] J. Dworkin et al., Phys. Rev. D 41, 780 (1990).
[11] S. Bright, R. Winston, E. C. Swallow and A. Alavi-Harati,
Phys. Rev. D 60, 117505 (1999).
[12] J. M. Watson and R. Winston, Phys. Rev. 181, 1907 (1969).
[13] Particle Data Group, C. Caso et al., Eur.
Phys. J. C 3, 1 (1998).
[14] A. Garcia and P. Kielanowski,
The Beta Decay of Hyperons, Lecture Notes in Physics Vol. 222
(Springer-Verlag, Berlin, 1985). With these metric and matrix
conventions, is positive
for neutron beta decay.