Recent Results From CLEO on Mixing, Violation in Decays, and Width
We present preliminary results of several analyses searching for the effects of violation and mixing in the decay of mesons. We find no evidence of asymmetry in five different two-body decay modes of the to pairs of light pseudo-scalar mesons: , , , , and . We present the first measurement of the rate of wrong-sign decay: . We also describe a measurement of the mixing parameter by searching for a lifetime difference between the neutral final state and the even and final states. Under the assumption that is conserved we find . Finally, we present our measurement of the width: .
1 Introduction and Motivation
The study of mixing in the and sectors has provided a wealth of information to guide the form and content of the Standard Model. In the framework of the Standard Model, mixing in the charm meson sector is predicted to be small , making this an excellent place to search for non-Standard Model effects. Similarly, measurable violation (CPV) phenomena in strange and beauty mesons are the impetus for many current and future experiments. The Standard Model predictions for CPV in charm meson decay are of the order of , with one recent conjecture of nearly . Observation of CPV in charm meson decay exceeding the percent level would be strong evidence for non-Standard Model processes.
A can evolve into a through “ordinary” on-shell intermediate states, or through off-shell intermediate states, such as those that might be present due to new physics. We denote the amplitude through the former (latter) states by , in units of . The Standard Model contributions to are suppressed to and the Glashow-Iliopolous-Maiani cancellation could further suppress down to . Many non-Standard Model processes could lead to . Contributions to at this level could result from the presence of new particles with masses as high as 100 – 1000 TV . Signatures of new physics include and violating interference between and or between and a direct decay amplitude.
“Wrong sign” (WS) processes, such as , can proceed directly through doubly-Cabibbo-suppressed decay (DCSD) or through mixing and subsequent Cabibbo-favored decay (CFD). Both DCSD and mixing followed by CFD can contribute to the time-integrated WS rate, and the inclusive asymmetry , where , is the charge conjugated quantity, and is a WS final state, such as .
The different contributions to and can be separated by studying the proper decay time dependence of WS final states, as we have done in , and has been done by FOCUS . The differential WS rate relative to the time-integrated right sign (RS) process, in time units of the mean lifetime, , is given by . is the relative rate of DCSD, , , and is the strong phase between the DCSD and CFD amplitudes. There are theoretical arguments that should be small , although this should not be taken for granted.
A measurement of opens an important window to non-perturbative strong physics involving heavy quarks. The basic framework of the theory is well understood, however, there is still much speculation - predictions for the width range from 15 kV to 150 kV . We know the width is dominated by strong decays since the measured electromagnetic transition rate is small, % . A measurement of the width of the gives unique information about the strong coupling constant in heavy-light systems.
2 General Experimental Method
All of the analyses discussed herein, unless otherwise stated, use the same data set and reconstruction techniques described below. The data set was accumulated between February 1996 and February 1999 and corresponds to of collision data at GV provided by the Cornell Electron Storage Ring (CESR). The data were recorded by the CLEO II detector upgraded with the installation of a silicon vertex detector (SVX) and by changing the drift chamber gas from an argon-ethane mixture to a helium-propane mixture. The upgraded configuration is referred to as CLEO II.V.
The Monte Carlo simulation of the CLEO II.V detector is based on GEANT , and simulated events are processed in the same manner as the data.
The candidates are reconstructed through the decay sequence . The charge of the slow pion () tags the flavor of the candidate at production. The charged daughters of the are required to leave hits in the SVX and these tracks are constrained to come from a common vertex in three dimensions. The trajectory of the is projected back to its intersection with the CESR luminous region to obtain the production point. The is refit with the requirement that it come from the production point, and the confidence level of the of this refit is used to reject background.
The energy release in the decay, , obtained from the above technique is observed to have a narrow width, of order 190 kV depending on decay mode, which is a combination of the intrinsic width and detector resolution. and are the reconstructed masses of the and candidates respectively, and is the charged pion mass. In the mixing analyses described below, the distribution of candidates in the – plane are fit to determine both RS and WS yields.
We calculate using only the vertical component of the candidate flight distance. This is effective because the vertical extent of the CESR luminous region has m. The resolution on the decay point (, , ) is typically m in each dimension. We express as , where is the vertical component of the total momentum of the candidate. The error in , , is typically (in lifetimes), although when the direction is near the horizontal plane can be large.
3 Violation in Decay
Violation in charm meson decay is expected to be small in the Standard Model, which makes this a good place to look for non-Standard Model effects. Cabibbo-suppressed charm meson decays have all the necessary ingredients for violation – multiple paths to the same final state and a weak phase. However, in order to get sizable violation, the final state interactions need to contribute non-trivial phase shifts between the amplitudes. Large final state interactions may be the reason why the observed ratio of branching ratios is roughly twice the predicted value. Thus, decays may provide a good hunting ground for violation.
Previous searches for mixing-induced or direct violation in the neutral charm meson system have set limits of or a few percent, respectively. We present results of searches for direct violation in neutral charm meson decay to pairs of light pseudo-scalar mesons: , , , and .
3.1 Search for Violation in and Decay
The asymmetry result is obtained by fitting the energy release () spectrum of events for the yields from and decays. The background-subtracted spectrum is fitted with a signal shape obtained from data and a background shape determined from Monte Carlo. The mass spectra are also fitted as a check.
We measure the asymmetry,
where the flavor of the is tagged by the slow pion charge in . The decay asymmetry may be measured using this method because the production and strong decay of are -conserving.
The parameters of the slow pion dominate the distribution, so all modes have the same shape. We do the fits in bins of momentum to eliminate bias arising from differences in the momentum spectra between the data and the MC. The preliminary results are and .
We use many variations of the fit shapes, both empirical and analytical, to assess the systematic uncertainties due to the fitting procedure (0.69%). We also consider biases due to the detector material (0.07%), the reconstruction software (0.48%), and forward–backward acceptance variations ( pairs are not produced symmetrically in the forward/backward directions in collisions at GV, and the collision point was not centered exactly in the middle of the detector) (0.014%).
The measured asymmetries are consistent with zero, and no violation is seen. These results are among the most precise measurements .
3.2 Search for Violation in , and Decay
This analysis differs from the other analyses presented in this paper in some of its reconstruction techniques and in the data set used. The and final states do not provide sufficiently precise directional information about their parent to use the intersection of the projection and the CESR luminous region to refit the slow pion, as described in Section 2. The final state is treated the same for consistency. This analysis uses the data from both the CLEO II and CLEO II.V configurations of the detector, corresponding to 13.7 of integrated luminosity.
The and candidates are reconstructed using only good quality tracks and showers. The tracks (showers) whose combined invariant mass is close to the () mass are kinematically constrained to the () mass, improving the mass resolution. The tracks used to form candidates are required to satisfy criteria designed to reduce backgrounds from decays and combinatorics. candidates with masses close to the known mass are selected to determine the asymmetry . Prominent peaks due to decay are observed in the distributions of all three decay modes.
The yields of and candidates for a given final state are determined by subtracting the background yield obtained by fitting the sideband regions to a non-relativistic threshold function, . The background yield under the signal is obtained by interpolation from the sidebands.
After background subtraction, we obtain candidates, candidates, and candidates.
We have searched for sources of false asymmetries introduced by the finding (0.19%), fitting (0.5%), and backgrounds (0.35% , 0% and 12% ). We find no significant bias, but apply the measured corrections and add their uncertainties to the total. We obtain the results , and , where the uncertainties contain the combined statistical and systematic uncertainties. All systematic uncertainties, except for the 0.5% uncertainty due to possible bias in the fitting method, are determined from data and would be reduced in future higher luminosity samples.
All measured asymmetries are consistent with zero, and no indication of violation is observed. This measurement of is a significant improvement over previous results, and the other two asymmetries reported are first measurements.
4 First Rate Measurement of Wrong-Sign Decay
candidates are reconstructed using the selection criteria described in Section 2, with additional requirements specific to this analysis. In particular, candidates with momenta greater than 340 MV/ are reconstructed from pairs of photons detected in the CsI crystal calorimeter. Backgrounds are reduced by requiring specific ionization of the pion and kaon candidates to be consistent with their respective hypotheses.
We fit for the scale factor which relates the small number of WS events, , to the large number of RS events: . If the -spin symmetry prediction of -flavor is not badly violated , we would expect the WS channel to have a different resonant substructure than that observed in the RS data. We account for the efficiency difference which could arise from this by allowing a correction factor : .
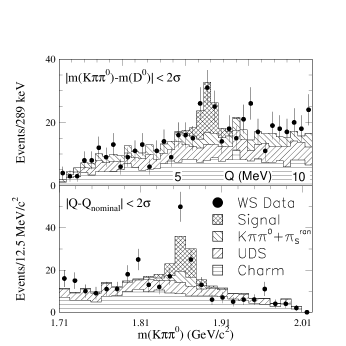
The scale factor is measured by performing a two-dimensional maximum likelihood fit to the distribution in and . The signal distribution in these variables is taken from the RS data. The backgrounds are broken down into three categories: 1) RS decay combined with an uncorrelated , 2) combinations from , , and , and 3) combinations from charm particle decays other than correctly reconstructed RS decays. The background distributions are determined using a large Monte Carlo sample, which corresponds to approximately eight times the integrated luminosity of the data sample. The – fit yields a WS signal of events and a ratio . Projections of the data and fit results in slices through the signal region in each variable are shown in Fig. 1. The statistical significance of this signal is found to be 4.9 standard deviations.
The correction factor is determined using a fit to the Dalitz plot of the WS data. The RS mode was recently fitted by CLEO and found to have a rich Dalitz structure consisting of , , , , , , and resonances and non-resonant contributions. In this fit, the amplitudes and phases are initialized to the RS values, with those corresponding to the and resonances allowed to vary relative to the dominant and other minor contributions. We measure a correction of . Studies are under way to examine the extent and significance of the surprising similarity between the RS and WS Dalitz plots.
We estimate an uncertainty of 14% on due to the Monte Carlo – background, based on a series of fits using specific background subregions of the – plane. The 9.5% uncertainty in has contributions from the unknown amplitudes and phases that are fixed in the determination of (8%), the Dalitz plot fit method (3.6%), and the Dalitz plot of non- backgrounds (3%). Other minor contributions come from mismodeling of selection variables (3%), and statistics of the Monte Carlo background sample (2.4%).
We measure the WS rate to be (preliminary). Work is in progress to use the lifetime distribution of this sample to yield independent limits on , , and .
5 Search for -Dependent Lifetime Differences Due to Mixing
In the limit of no violation in the neutral system, we can express as
| (1) |
where is the lifetime of a neutral state, such as , and is the lifetime of a even state, such as or . Thus, to measure we simply measure the ratio of the lifetimes of and or . Since the final states are very similar, our backgrounds are small, and cross-feed among the final states is negligible, many of the sources of uncertainty cancel in the ratio. A similar analysis has recently been published by FOCUS comparing the and final states .
We fit the proper time distributions of candidates near the mass using an unbinned maximum likelihood fit. The proper time measurement technique is described in Section 2.
The signal likelihood function is an exponential convolved with three resolution Gaussians. The width of the primary Gaussian is due to the propagation of errors from the track fit to the flight distance and momentum for each candidate. The second and third Gaussians represent candidates that have been mismeasured by the addition of spurious tracking hits or due to hard non-Gaussian scatters in the material of the detector. The first of these has its width determined in the fit to the copious sample, while the second is fixed to a large value of 8 ps. The relative contribution of the two mismeasured signal resolutions is determined using the data sample and fixed for the and samples. According to our simulation, the fraction of the second Gaussian is about 4% of the well-measured signal and the third Gaussian is less than 0.1% of the signal. The probability for a candidate to be signal is determined by its measured mass , and is based on a fit to that distribution.
The background is considered to have contributions with both zero and non-zero lifetimes. All parameters that describe the background are allowed to vary in the fits except for the width of the widest Gaussian which is fixed to 8 ps.
The background in all three samples has a large component with a lifetime consistent with that of the . This agrees with the prediction of our simulation that the background with lifetime is dominated by misreconstructed fragments of charm decays.
We calculate separately for the and samples. Systematic uncertainties are dominated by the statistical uncertainty in a Monte Carlo study used to determine small corrections, consistent with zero, that are applied to the measured result to account for differences between measured and generated values of the lifetimes (). Additional significant systematic uncertainties come from variations in the description of the background (), uncertainties in our model of the proper time resolution (), and details of the fit procedure (), where the listed values are the contribution to the average result. Our preliminary results are and . We form a weighted average of the two to get (preliminary), which is consistent with zero. It is also consistent with our previous result using and the FOCUS results using and .
6 Width Measurement
The challenge of measuring the width of the is understanding the experimental resolution, which exceeds the width we are trying to measure. Unfortunately, there is no decay mode with small width, large cross-section, and similar kinematics to use as a calibration of the method. We depend on exhaustive comparisons between our detector simulation and data in order to understand the effect of candidates with mismeasured hits, errors in pattern recognition, or large angle Coulomb scattering on the measured width.
In addition to the cuts described in Section 2, we require events to be within the kinematically allowed regions of momentum, momentum, and - opening angle in order to remove a small amount of misreconstructed background. We also remove poorly measured events by requiring kV and do not consider candidates within 0.3 radians of the horizontal plane.
We assume that the intrinsic width of the is negligible, , implying that the width of is simply a convolution of the shape given by the width and the tracking system response function. We consider pairs of and for the decay , where is given for each candidate by propagating the tracking errors from the kinematic fit of the charged tracks.
The width is extracted using an unbinned maximum likelihood fit to the distribution. The observed distribution is fitted to a Breit-Wigner signal and polynomial background, with its shape fixed by the simulation.
For each candidate, the signal shape is convolved with a Gaussian resolution function with width given by the event-by-event error on , . The detector resolution on is approximately 150 kV. We find excellent agreement between the simulation of and that observed in the data, as shown in Fig. 2. This reflects the correct modeling of the kinematics and sources of errors on the tracks in the simulation, such as number of hits on a track and the effects of multiple scattering in detector material.

In order to account for poorly measured events, we allow a small fraction of the signal to be parameterized by a single Gaussian resolution function of width . In the fit, we constrain the level of this contribution to %. This value was determined by fitting a range of simulated widths, while allowing to vary.
The fitter has been tested extensively using Monte Carlo samples generated with different and is found to reproduce inputs ranging from 0 to 130 kV. In this study, we observe a bias of kV, which is consistent with zero. We apply this small correction to our fit result.
We observe a corrected width of .
We test the simulation of the distribution and estimate the corresponding systematic uncertainty by comparing its dependence on kinematic variables of the decay with data. Specifically, we compare the Gaussian peak width and mean as a function of , , , , , and . The derivatives test correlations among the basic kinematic variables. We compare by dividing the sample into ten slices in each variable and fitting the ten distributions of to Gaussians.
We observe some discrepancy between the Gaussian mean of the peak in data and Monte Carlo as a function of , , and . While measuring the mean is not our goal, we include the observed deviation as a systematic uncertainty of 16 kV on .
We find excellent agreement between the Gaussian width of the peak in data and Monte Carlo as a function of all variables if events are generated with an intrinsic width in the range kV. Even when comparing with a sample of zero intrinsic width, we see excellent agreement in the dependence on the kinematic variables.
In order to test our modeling of effects that contribute to the tracking errors, we perform fits in which we allow a scale factor to multiply the event-by-event error . We estimate this effect by varying our cut on from the nominal 200 kV in the range 75 kV to 400 kV. Several effects, such as improper modeling of material in the detector, could lead to deviations of from unity. Repeating our analysis with all parameters fixed except , we find . We measure an uncertainty of kV on by rerunning the analysis with fixed at its limits.
We take into account correlations among the less well-measured parameters of the fit, such as , , and , by varying each parameter one standard deviation from its central fit value. We find an uncertainty of kV.
Biases in the reconstruction are estimated by replacing reconstructed parameters with their generated values in the analysis. We find only a small bias in the reconstruction of the origin point. This contributes an uncertainty kV.
Uncertainties from the background shape are determined by allowing the coefficients of the background polynomial to vary in the fit. We observe a change on the width of kV.
These studies were confirmed using subsamples of the data. One sample uses events restricted to kinematic regions in which the mean and are well-modeled: and . The other uses events in which very tight selection criteria are applied to the tracks. In both cases the background from poorly measured tracks is negligible and not included in the fit. We measure to be consistent with our nominal sample: () kV (() kV) in the former (latter) sample.
We measure the width of the to be (preliminary) by studying the distribution of the energy release in followed by decay.
This is the first measurement of the width, corresponding to a strong coupling of (preliminary). This is consistent with theoretical predictions based on HQET and relativistic quark models, but higher than predictions based on QCD sum rules.
7 Summary
We present preliminary results of several analyses searching for the effects of violation and mixing in the decay of mesons. We find no evidence of asymmetry in five different two-body decay modes of the to pairs of light pseudo-scalar mesons: , , , and . We present the first measurement of the rate of WS decay: . We describe a measurement of the mixing parameter by searching for a lifetime difference between the neutral and the even and final states. Under the assumption that is conserved we find . Finally, we describe our preliminary measurement of the intrinsic width of .
8 Acknowledgments
We gratefully acknowledge the effort of the CESR staff in providing us with excellent luminosity and running conditions. M. Selen thanks the PFF program of the NSF and the Research Corporation, and A.H. Mahmood thanks the Texas Advanced Research Program. This work was supported by the National Science Foundation, the U.S. Department of Energy, and the Natural Sciences and Engineering Research Council of Canada.
References
- [1] H.N. Nelson, hep-ex/9908021.
- [2] F. Bucella et al., Phys. Rev. D 51, 3478 (1995).
- [3] I.I. Bigi, hep-ex/0009021.
- [4] T.D. Lee, R. Oehme, and C.N. Yang, Phys. Rev. 106, 340 (1957); A. Pais and S.B. Treiman, Phys. Rev. D 12, 2744 (1975).
- [5] S.L. Glashow, J. Iliopolous, and L. Maiani, Phys. Rev. D 2, 1285 (1970).
- [6] M. Leurer, Y. Nir, and N. Seiberg, Nucl. Phys. B 420, 468 (1994); N. Arkani-Hamed et al., hep-ph/9909326.
- [7] CLEO Collaboration, R. Godang et al., Phys. Rev. Lett. 84, 5038 (2000).
- [8] FOCUS Collaboration, J.M. Link et al., hep-ex/0012048.
- [9] C. Caso et al. (Particle Data Group), Eur. Phys. J. C 3, 1 (1998).
- [10] S.B. Treiman and R.G. Sachs, Phys. Rev. 103, 1545 (1956).
- [11] L. Wolfenstein, Phys. Rev. Lett. 75, 2460 (1995); T.E. Browder and S. Pakvasa, Phys. Lett. B 383, 475 (1996); A.F. Falk, Y. Nir, and A.A. Petrov, J. High Energy Phys. 9912, 019 (1999).
- [12] Y. Kubota et al., Nucl. Instrum. Methods Phys. Res. A 320, 66 (1992).
- [13] R. Ruckl, WUE-ITP-98-011, CERN-TH/98-124, hep-ph/9810338.
- [14] J.Bartelt et al. (CLEO Collaboration), Phys. Rev. Lett. 80, 3919, (1998).
- [15] T.S. Hill, Nucl. Instrum. Methods Phys. Res. A 418, 32 (1998).
- [16] R. Brun et al., GEANT3 Users Guide, CERN DD/EE/84-1.
- [17] Charge conjugation is implied throughout, except in discussions of violation.
- [18] CLEO Collaboration, J. Bartelt et al., Phys. Rev. D 52, 4860 (1995).
- [19] FOCUS Collaboration, J.M Link et al., Phys. Lett. B 491, 232 (2000); Erratum-ibid. 495, 443 (200); E791 Collaboration, E.M. Aitala et al., Phys. Lett. B 421, 405 (1998); E687 Collaboration, P.L. Frabetti et al. , Phys. Rev. D 50, 2953 (1994); E691 Collaboration, J.C. Anjos et al., Phys. Rev. D 44, 3371 (1991).
- [20] CLEO Collaboration, G. Bonvicini et al., to be published in Phys. Rev. D Rap. Comm., CLNS 00/1708, hep-ex/0012054.
- [21] CLEO Collaboration, S. Kopp et al., to be published in Phys. Rev. D, (2001), hep-ex/0011065.
- [22] M. Gronau, J. L. Rosner, to be published in Phys. Lett. B., hep-ph/0010237.
- [23] CLEO Collaboration, G. Bonvicini et al., Phys. Rev. Lett. 82, 4586 (1999).
- [24] FOCUS Collaboration, J.M. Link et al., Phys. Lett. B 485, 62 (2000).