Investigations of fast neutron production by 190 GeV/c muon interactions on different targets
Abstract
The production of fast neutrons (1 MeV - 1 GeV) in high energy muon-nucleus interactions is poorly understood, yet it is fundamental to the understanding of the background in many underground experiments. The aim of the present experiment (CERN NA55) was to measure spallation neutrons produced by 190 GeV/c muons scattering on carbon, copper and lead targets. We have investigated the energy spectrum and angular distribution of spallation neutrons, and we report the result of our measurement of the neutron production differential cross section.
keywords:
underground neutron flux , fast neutron production , muon-nucleus interaction , time-of-flightPACS:
25.30.Mr, 25.20.-x, 25.40.Sc, 28.20.-v, , , ††thanks: Present address: Jet Propulsion Laboratory, Pasadena CA 91109, U.S.A. , , , ††thanks: Present address: Monitor Company, 12 Place Vendôme, 75001 Paris, France , ††thanks: Present address: Foveon Inc., 3565 Monroe St., Santa Clara CA 95051, U.S.A. ,
1 Introduction
Neutrons are an important source of background in many low rate underground experiments. Detectors such as the Palo Verde detector [1], the Kamiokande detector [2], the CDMS detector [3], the Gallex detector [4], and most of the other underground experiments are concerned with neutron background. It is therefore important to understand the different neutron production mechanisms in the environment of such experiments.
There are two sources of neutrons in underground laboratories. The first one is the natural radioactivity such as (,n) reactions and spontaneous fission, due to uranium and thorium traces in the rock or in the materials used in the experiments themselves. The second source is the interaction of atmospheric muons, produced by cosmic rays, with matter, such as the surrounding rock, the different shieldings or the detector itself. Propagating through matter, muons lose energy mainly continuously by ionization. In addition, they lose energy in discrete bursts along their trajectory by bremsstrahlung, direct pair production and nuclear interactions [5]. The goal of the CERN NA55 experiment was to study neutron production in muon-nucleus interactions, which at present is poorly understood. In this paper we report the result of our measurement of the cross section for fast neutron production by interaction of high energy muons off carbon, copper and lead nuclei. Specifically, we investigated the energy spectrum and angular distribution of spallation neutrons produced by the inelastic scattering of 190 GeV/c muons on each target, via the time-of-flight method.
2 Interaction of high energy muons with matter
The total neutron yield measured at different depths has been reported in references [1] and [6, 7]. However, very little is known about the energy and angular distributions of the neutrons, even though the neutron energy spectrum in a scintillator has been determined in [7] for neutrons which penetrated at least 1 m from the muon track. Moreover, one expects that many neutrons are produced in secondary processes following the primary muon-nucleus interaction and it is difficult to separate the two effects in the inclusive measurements performed underground.
To describe the process theoretically, one assumes that the muon scattering occurs primarily at very small angles. Such a process can be viewed as produced by a beam of nearly real equivalent photons [8]. Even with this drastic simplification, it is difficult to obtain reliable estimates for actual yields and spectra of the neutrons. The difficulty lies in the estimation of the equivalent photon flux, as well as in the shortage of experimental nuclear photo-disintegration data for high energy photons.
3 Experimental apparatus
3.1 Experimental set-up
The layout of our NA55 experiment is similar to a CERN LEAR experiment [9] in which neutrons and pions were measured following anti-protons stopping in the target. Another group, E665 at Fermi-lab [10], measured neutrons produced by deep-inelastic scattering of 470 GeV/c muons. However, the latter experiment measured neutrons in a small energy range from 1 to 10 MeV, with high-energy deep inelastically scattered muons from nuclear targets. In the frame of the CERN NA54 experiment, measurements were done on a carbon target to study the production of radioactive isotopes in scintillation detectors by 100 and 190 GeV muons and their secondary shower particles [11].
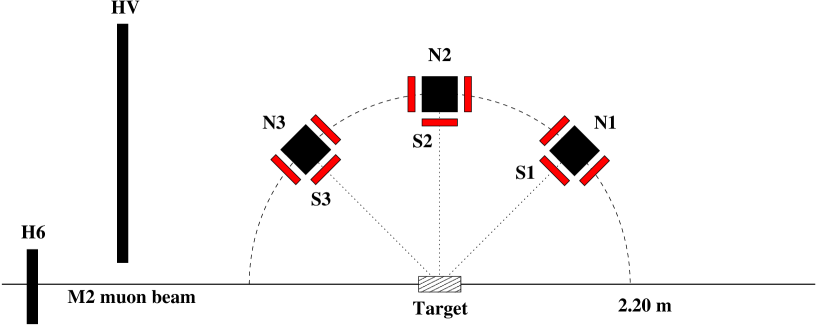
The M2 muon beam at the CERN-SPS was well suited for our investigation. At 190 GeV/c, the energy of the SPS muons is similar to the mean energy of cosmic-ray muons at many underground experimental sites. The beam transverse size is 2.2 cm (FMWH). Our experiment was performed with a cylindrical target of 75 cm length and 8 cm diameter for the graphite, 25 cm length and 10 cm diameter for the copper, 10 cm length and 20 cm diameter for the lead target. Three neutron detectors (see section 3.2) were placed at 45 (N1), 90 (N2) and 135 (N3) degrees relative to the muon beam, for a target-detector distance of 2.20 m (see Fig. 1). A beam counter H6 (from NA47 experiment [12]) consisting of plastic scintillators is placed directly in the muon beam and is thus exposed to rates of about 20 MHz, during the two-seconds beam-on phase. To reduce the detector rate to a manageable level, the beam counter is segmented into 4 rings, each divided in 16 counters thus reducing the rate per phototube to at most 1 MHz in the center. Several large plastic scintillators are placed upstream from the neutron detectors and are used to veto muons originating from the beam halo. An iron hadron absorber was placed far behind the target along the beam axis.
3.2 The neutron detectors and electronics
Each detector is a 20 x 20 cm cylindrical glass vessel, equipped with two photomultipliers (Philips XP4512 photomultipliers with fast 1.1 nsec RMS pulse) and filled with Bicron 501A liquid scintillator which possesses excellent pulse shape discrimination properties for neutron identification [13]. Thin plastic scintillators (7 mm) are positioned in front of and around each neutron detector to tag charged particles, such as protons and pions. They are also used to veto the cosmic muons.
The particle energy is measured via the time-of-flight (TOF) from its production site in the target. The signal of the neutron detector provides the TOF start, and the signal of the segmented beam counter, located 6 m upstream from the target, is delayed to provide the TOF stop. The analog signals of each of the neutron counters N are coded using 3 different CAMAC ADC’s digitizing respectively the full analog pulse, the pulse rise and the pulse tail. The pulse itself provides the three ADC gates by means of a low-threshold discriminator, which also provides a CAMAC multi-hit TDC with the TOF start signal. The analog signals of each of the plastic scintillators S are coded using 15 different CAMAC ADC’s.
4 Neutron detector efficiency
The neutron detection efficiency was simulated using the GCALOR Monte Carlo package [14]. Neutrons were generated with energies from 2 to 1000 MeV. The efficiency for neutrons entering the detector was obtained as a function of both the detector energy threshold and the neutron energy. The geometrical acceptance of the detector, the quenching effect and each detector threshold were taken into account. The calculation of scintillator quenching was taken from Ref. [15], as the amount of light depends on the particle type and is not directly proportional to the deposited energy. Above a neutron energy of 50 MeV, the electron equivalent energy in the scintillator is assumed to be a linear function of the proton energy [16], with a proportionality constant of 0.83. Below 50 MeV, we applied the following formula:
| (1) |
where was the electron kinetic energy in MeV and the proton kinetic energy in MeV.
As will be shown later, the neutron energy spectrum in each counter is peaked at low energies. Therefore, the detection efficiency is strongly dependent upon the neutron detectors thresholds. The thresholds are determined from the energy loss spectrum of cosmic muons in the scintillator cells. Vertical muons (cosmics) are selected by requiring a coincidence signal above pedestals in the top and bottom scintillation counters during beam-off runs. Because of the hardware thresholds, these spectra show a clear cut-off at low energy. The neutron detector thresholds are then extracted by comparing a simulated energy spectrum of cosmic muons with the measured one. The Monte Carlo spectrum of cosmic muons is then convoluted with a gaussian response function, for the detectors:
| (2) |
where is the measured spectrum in ADC counts . The response function parameters are of the same form as the ones used by Arneodo et al. [13] who have described and tested the response of similar Bicron 501A liquid scintillator cells. Applying this procedure, we obtain thresholds in electron equivalent energy of MeV for N1, MeV for N2 and MeV for N3. In neutron or proton recoil energy they are 8.70.7 MeV, 9.60.5 MeV and 11.40.5 MeV for N1, N2 and N3 respectively. Fig. 2 shows a comparison of the measured and simulated, , energy spectra of cosmic muons for the N3 detector. The errors on the thresholds are assigned to be 2 channels (see Fig. 2) and are overestimated.
Finally, Fig. 3 shows the Monte Carlo simulation of the neutron detection efficiency as a function of both neutron energy and energy threshold. Neutrons were assumed to be detected only if recoil protons ionize heavily and stop in the scintillator producing delayed light and thus making pulse shape discrimination possible.
5 Data analysis
The results of the analysis of our data from the different targets is presented below.
5.1 Background
The challenge of this experiment is to discriminate neutrons from the abundant bremsstrahlung photons. Furthermore, four other background sources may contribute to the measured spectra: charged particles from the target, cosmic muons, muons from the beam and ambient neutrons. Cosmic muons and charged particles can be rejected using the plastic scintillators. Muons from the beam halo are eliminated by the dedicated veto counter (HV, see Fig. 1). Surrounding neutrons cannot be eliminated, but their contribution can be estimated from dedicated empty-target runs. Finally, neutrons and photons are identified by a pulse shape discrimination (PSD) of their signal in the liquid scintillator.
5.2 Pulse shape discrimination
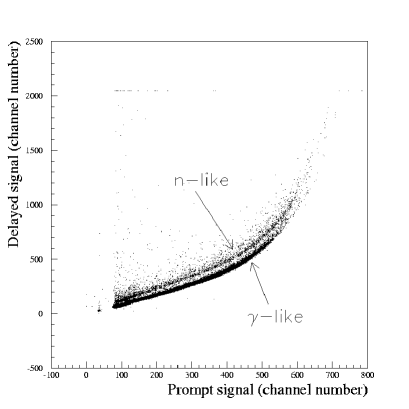
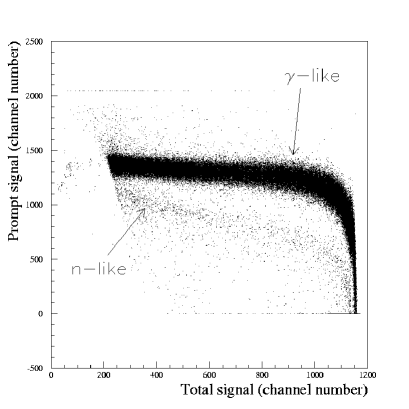
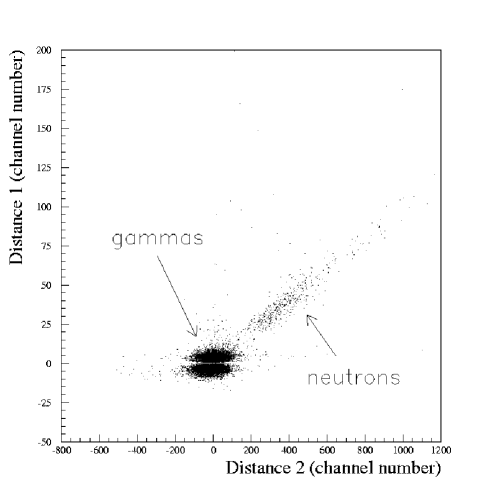
The time-development of scintillation light depends on the nature of the ionising particle. In scintillators such as Bicron 501A higher ionisation density due to slow charged particles, such as recoil protons from neutron scattering, leads to the excitation of longer lived states and thus to a slower component in the light pulse. Measuring the signal amplitude at 2 different time intervals allows to visualize this in a PSD plot [17]. The complete PSD method is explained in Ref. [18]. Fig. 5 shows the amplitude obtained in a delayed window as a function of the amplitude measured in a prompt one (PSD1). Based on the same principle, Fig. 5 is obtained by comparing the amplitude in the prompt window with the total signal amplitude (PSD2). In these two different PSD representations, we can distinguish a -like curve containing bremsstrahlung photons and cosmic and remaining beam halo muons, and a neutron-like zone containing all the neutrons and the charged hadrons from the target. The -like events are easily selected from the time-of-flight since they are prompt with respect to the beam muons. Then we calculate for each event the real distance (in units of channel number) between the corresponding amplitudes and the fitted -like curve for PSD1 (distance 1) and PSD2 (distance 2). We can then represent distance 1 as a function of distance 2, for all events including the charged particles. Figure 6 shows the events left after the cuts which select only neutral particles. A clear separation can be seen between photons and neutrons. A cut is applied to select neutron like events achieving nearly complete suppression of the -like events. The acceptance is calculated by applying a gaussian fit on the projected neutron and gamma peaks, and evaluating the relative area under the gamma peak above threshold. The acceptance was calculated separately for each detector and target. This was necessary because of the limited stability of the PSD, and because of the differences in the relative strengths of the neutron and gamma peaks from case to case. The global cut acceptances, reflecting these variations between targets and detectors, are shown in Table 1. The accepted neutron events are then used for the time-of-flight analysis.
5.3 Time-of-flight analysis
Before being converted into energy distributions, the selected neutron time-of-flight spectra must be corrected for off-target events and for random TOF stop signals. The first background arises from triggers correlated with beam particles, as neutrons bouncing on the ground or walls, for example. Their contribution can be deduced from ’empty target’ runs properly normalized to the incident flux. The second background component is due to multiple TOF stop signals given by randomly incoming muons hitting the H6 detector scintillators. As their time distribution is flat (see Fig. 7), they can be easily subtracted.
The calibration of the time spectrum is obtained from the gamma peak. The time resolution slightly depends on the target. As an example, it is 1.0 ns, 4.6 ns and 3.8 ns for N1, N2 and N3 respectively for the carbon target. In this case we measure maximum neutron energies of around 1 GeV, 250 MeV and 310 MeV for N1, N2 and N3 respectively. The time resolution determines the energy resolution, which is shown as function of energy in Fig. 8. The energy distribution is computed from the TOF distribution, and corrected for the detector efficiency as described in section 4.
6 Results
6.1 Additional acceptance corrections
The charged particle rejection using the scintillators S leads to a loss of good neutron events. The corresponding acceptances are determined from the comparison of neutron samples with and without scintillator cut for each neutron detector, and strongly depend on the scintillator efficiencies and thresholds. In addition, the 85 Hz trigger rate for all detectors above a threshold of 50 MeV leads to a dead time of 2.1. All the efficiencies taken into account in the calculation of the neutron production cross section are summarized in Table 1.
6.2 Production cross section and energy spectrum
The neutron production cross section was calculated using the following formula:
| (3) |
where dn is the number of selected neutrons corrected for all acceptances. All parameters are given in Table 2. Figures 8, 9 and 10 show the differential neutron production cross section as a function of the neutron energy, including all efficiency corrections, for the three angles, and for the different targets. The energy integrated values from the corresponding threshold up, are gathered in Table 3. It is worth noting that the neutron energy spectrum is displaced towards low energies when going from forward to backward angles. As a consequence, no neutrons are detected above 70 MeV at 135∘. Our measurements show that the angular distribution is forward peaked, with the exception of the lowest energy bin. This effect can be understood as due to the recoil of the source nucleus combined with an isotropic distribution of the emitted neutron at the lowest energies. One also observes that the angular distribution gets wider with increasing atomic number. Generally our angular and energy distributions agree with the FLUKA simulation performed by Wang et al. [19]. The slope of the neutron energy spectrum for carbon is in a qualitative agreement with the slope (integrated over all angles) found in Ref. [7].
Figure 11 shows the integrated cross section as a function of the atomic number for the three different angles and three different targets. We note that the cross section increases significantly with the atomic number.
7 Conclusion
We investigated the production of spallation neutrons obtained from 190 GeV/c muons scattering on graphite, copper and lead targets. The neutrons were observed by liquid scintillator detectors, allowing background rejection by means of pulse shape discrimination. The neutron energy distribution was determined via time-of-flight. The 190 GeV muon energy corresponds to the mean energy of cosmic-ray muons at underground experimental sites of about 2000 meters water equivalent depth.
It should be noted, however, that in the present experiment only neutrons associated with the primary muon-nuclear spallation process are detected, while in the underground detectors the total neutron yields are measured. Thus the present experiment is not dependent on the subsequent neutron transport and multiplication. In view of this, and also in the view of the difference in the muon spectrum (narrow vs. broad distribution) direct comparison is difficult. Nevertheless, the cross sections quoted in Table 3 are in a qualitative agreement with the yields underground and, as mentioned above, their shape agrees with the FLUKA simulation.
Results on neutron angular distribution and energy distribution were obtained for the first time. The differential cross section as a function of the neutron energy were obtained for 45∘, 90∘ and 135∘ production angles with around 15 accuracy.
Acknowledgements
Special thanks go to G. Gervasio for his contribution to the data decoding and O. Drapier for many useful discussions. We are grateful to D. Hilscher of HMI, Berlin for providing us with a PSD module. We thank H. Wong, A. Schopper, L. Gatignon and the staff at CERN for assistance provided. This project was supported in part by the US Department of Energy.
References
- [1] F. Boehm et al., Phys. Rev. D62 (2000) 092005.
- [2] Y. Fukuda et al., Phys. Lett. B388 (1996) 397.
- [3] S.R. Golwala et al., Nucl. Instrum. Meth. A444 (2000) 345.
- [4] M. Cribier et al., Astropart. Phys. 4 (1995) 23.
- [5] T.K. Gaisser, Cosmic Rays and Particle Physics, Cambridge University Press (1990).
-
[6]
R. Hertenberger et al., Phys. Rev. C52 (1995) 3449.
L.B. Bezrukov et al., Sov. J. Nucl. Phys. 17 (1973) 51.
R.I. Enikeev et al., Sov. J. Nucl. Phys. 46 (1987) 883.
M. Aglietta et al., Nuovo Cim. C12 (1989) 467. - [7] M. Aglietta et al., hep-ex/9905047, Proc. of 26th Intern. Cosmic Ray Conf., Salt Lake City (USA), August 17-25, 1999, HE 3.1.15.
- [8] J. Delorme et al., Phys. Rev. C52 (1995) 2222.
- [9] D. Polster et al., Phys. Rev. C51 (1995) 1167.
- [10] M.R. Adams et al., Phys. Rev. Lett. 74 (1995) 5198. Erratum-ibid. 80 (1998) 2020.
- [11] T. Hagner et al., Astropart. Phys. 14 (2000) 33.
- [12] SMC (NA47) Collaboration, SPSC/88-47/P242.
- [13] F. Arneodo et al., Nucl. Instrum. Meth. A418 (1998) 285.
- [14] C. Zeitnitz and T.A. Gabriel, Nucl. Instrum. Meth. A349 (1994) 106.
- [15] R.A. Cecil et al., Nucl. Instrum. Meth. 161 (1979) 439.
-
[16]
R.L. Craun and D.L. Smith, Nucl. Instrum. Meth. 80
(1970) 239.
Y. Uwamino et al., Nucl. Instrum. Meth. 204 (1982) 179. -
[17]
F.D. Brooks, Nucl. Instrum. Meth. 4 (1959) 151.
G. Ranucci, Nucl. Instrum. Meth. A354 (1995) 389. - [18] G.F. Knoll, Radiation Detection and Measurement; 3rd ed, John Wiley (2000).
- [19] Y-F. Wang et al., Phys. Rev. D64 (2001) 013012


| Target | Analysis cuts | N1 (45∘) | N2 (90∘) | N3 (135∘) |
|---|---|---|---|---|
| Carbon | PSD cuts | 87 | 66 | 64 |
| Plastic scintillators | 67 | 82 | 66 | |
| Copper | PSD cuts | 48 | 91 | 26 |
| Plastic scintillators | 69 | 85 | 88 | |
| Lead | PSD cuts | 50 | 28 | 28 |
| Plastic scintillators | 57 | 84 | 87 | |
| Life time | 97.9 | |||
| parameter | target | value |
|---|---|---|
| Angular acceptance | (5.2 0.6) x 10-4 sr | |
| Muons on target | C | 1.63 x 10¹¹ muons |
| Cu | 1.84 x 10¹¹ muons | |
| Pb | 1.93 x 10¹¹ muons | |
| Target density N=L | C | (8.52 0.11) x 1024 atoms/cm2 |
| Cu | (2.12 0.03) x 1024 atoms/cm2 | |
| Pb | (3.30 0.04) x 1023 atoms/cm2 |
| Total number of neutrons, | 45∘ | 100500 neutrons | |
|---|---|---|---|
| above threshold, corrected | C | 90∘ | 53510 neutrons |
| for the detector efficiency | 135∘ | 29395 neutrons | |
| 45∘ | 277960 neutrons | ||
| Cu | 90∘ | 135545 neutrons | |
| 135∘ | 148955 neutrons | ||
| 45∘ | 251360 neutrons | ||
| Pb | 90∘ | 316820 neutrons | |
| 135∘ | 105060 neutrons |
| Differential cross section | target | barn/sr | neut/srgcm-2 |
|---|---|---|---|
| C | (0.21 0.04) x 10-3 | (1.06 0.20) x 10-5 | |
| (0.09 0.02) x 10-3 | (0.46 0.08) x 10-5 | ||
| (0.06 0.01) x 10-3 | (0.31 0.06) x 10-5 | ||
| Cu | (2.00 0.40) x 10-3 | (1.90 0.38) x 10-5 | |
| (0.80 0.15) x 10-3 | (0.76 0.14) x 10-5 | ||
| (0.83 0.15) x 10-3 | (0.79 0.14) x 10-5 | ||
| Pb | (13.53 3.00) x 10-3 | (3.93 0.87) x 10-5 | |
| (11.67 2.38) x 10-3 | (3.39 0.69) x 10-5 | ||
| (3.75 0.72) x 10-3 | (1.09 0.21) x 10-5 |