SLAC-PUB-8724
BABAR-PROC-00/35
November, 2000
Physics results from BABAR and prospects.
Marie-Hélène Schune
Laboratoire de l’Accélérateur Linéaire
Batiment 208, BP 34
91898 Orsay Cedex, France
(for the B AB AR Collaboration)
Abstract
The BABAR experiment has been taking data since about one year. Physics results, complementary to those described in [1], are presented : various measurements of the neutral and charged B mesons lifetimes, the mixing frequency, the mistag fractions, and the and branching ratios. Some prospects for the close future are shown. All the numbers given here are preliminary.
Contribued to the Proceedings of the International Conference On CP Violation Physics,
9/18/2000—9/22/2000, Ferrara, Italy
Stanford Linear Accelerator Center, Stanford University, Stanford, CA 94309
Work supported in part by Department of Energy contract DE-AC03-76SF00515.
1 Physics results
The results shown here have been chosen not only for their interest but also because they are representative of future measurements :
-
•
the B lifetime measurement using inclusive reconstruction is a prototype analysis for CP violation studies using the same type of technique.
-
•
the B lifetime measurement using fully reconstructed B decays demonstrates the good vertex resolution of the Silicon Vertex Tracker.
-
•
the measurement using dileptons events relies heavily both on the vertex resolution and the lepton identification
-
•
when this measurement is performed using fully reconstructed B decays it can be really seen as a practice ground for CP violation analyses
-
•
finally the measurements of BR() and BR are steps towards a better understanding of the B decays.
1.1 B lifetimes
The and charged B lifetimes can be measured in BABAR due to the boost of the : the two B mesons are separated by an average distance in z of .
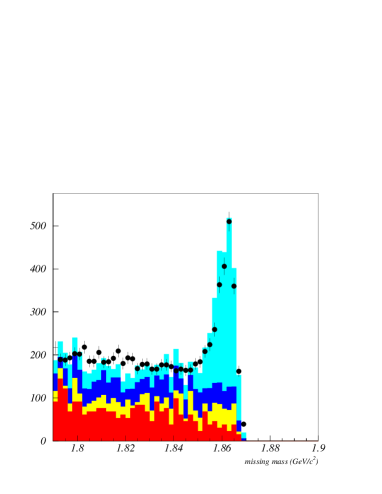
The first result given here is performed using an inclusive reconstruction of the . An integrated luminosity of has been used. The decay which is considered is where the is signed only by the soft pion coming from the decay . This soft pion is combined with the fast bachelor one (). There are enough constraints to reconstruct the missing mass, assuming that the slow and fast pions are coming from a decay into [2]. The missing mass is shown in Figure 1.
The lifetime is measured to be :
The main systematics are due to the backgrounds and the resolution function.
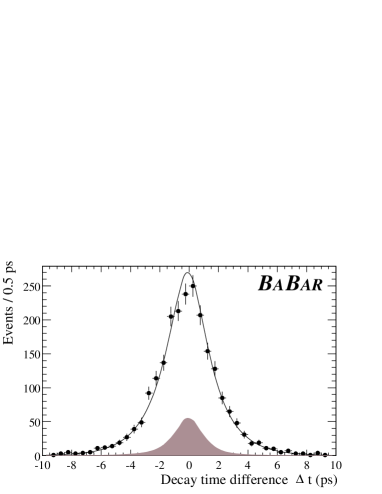
The and lifetimes have been also measured using less abundant but fully exclusive B decay modes [3]. The B mesons are reconstructed using , and decay modes. There is only one background source : the combinatorial background which is estimated from the side-bands of the beam energy substituted mass variable. The two proper time fits are shown in Figure 2 and the results for an integrated luminosity of are given in Table 1.

These B lifetime measurements are in good agreement with the values from the PDG2000 [4].
1.2 measurements
The resonance decays coherently into a pair. One of these two B mesons (let’s take for example that the ) decays at time , then the other one (the ) starts to oscillate and decays at time . If the second B decays as a the event will be named as mixed and the time behaviour will follow a law (). If it decays as a the event is called unmixed and the time behaviour will follow a law. The main ingredients for a measurement are :
-
•
to identify the flavor of one B (the one which decays at )
-
•
to tag the flavour of the other B (the one which decays at )
-
•
to measure the distance between the two vertices in order to deduce
In the first analysis presented here the two B mesons are tagged by two energetic leptons. The performances of the lepton identification are given in Table 2.
| Lepton | Efficiency | Mis identification |
|---|---|---|
| electron | ||
| muon |
The background coming from secondary leptons () is reduced by the use of a Neural Network based on 5 discriminating variables (the two leptons momentum in the rest frame, the total energy in the event, the missing momentum and the angle between the 2 leptons). The extraction is performed by a binned maximum likelihood fit on the asymmetry between like and unlike sign events. The fit is simultaneously done for , the sample composition (the B± contribution) and the mistag fraction (and its time dependence). The data and the fit are shown in Figure 3. With an integrated luminosity of , is measured to be equal to [5] :
The measurement using fully reconstructed is in fact divided into two samples : the hadronic sample with a reconstructed using D, D, D and . With an integrated luminosity of about 2600 candidates with a purity of about are reconstructed. The background is of combinatorial type and is estimated from the side bands of the beam energy substituted mass variable . The other sample is which allows to select about 7500 candidates with a purity of roughly . The backgrounds are of different types :
-
•
combinatorial background from the , it is estimated from the =M(D∗)-M(D0) side bands
-
•
fake ( it is obtained from control samples on the data)
-
•
and from 2 Bs (taken mainly from data)
-
•
continuum background (estimated from Off resonance data)
-
•
(estimated from LEP measurements, its relative efficiency is obtained from BABAR MC)
The flavor of the other B is tagged using a prioritized algorithm :
-
1.
: , tag with (Priority(Priority())
-
2.
K : tag with
-
3.
a Neural Network for the rest of the event. The output is divided into two regions NT1 and NT2.
An unbinned maximum likelihood fit is performed on the probability distribution functions for the mixed and unmixed events. It treats simultaneously , the main parameters of the resolution function and the mistag fraction (see section1.3).
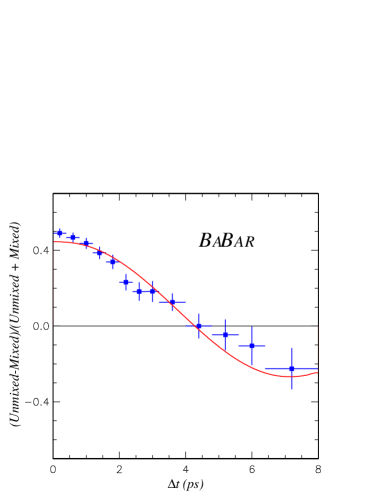
The results are displayed using the asymmetry between the two types of events and are shown on Figure 4. The results for the hadronic and semileptonic samples are [6] :
The combined result is :
The main systematics are due to the t resolution function, the MC statistics and the background for the semileptonic sample.
The various measurements are in agreement with the PDG2000 [4].
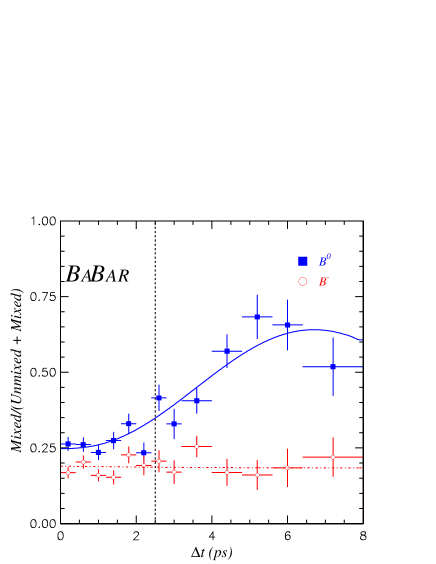
1.3 Mistag fraction measurements
The knowledge of the mistag fractions is a pre-requisite for the analyses aiming at measuring . The mistag fraction extraction should be done on a data set identical to the one used for the CP analysis. It can be done simultaneously with the likelihood fit or on the same events but with a counting method.
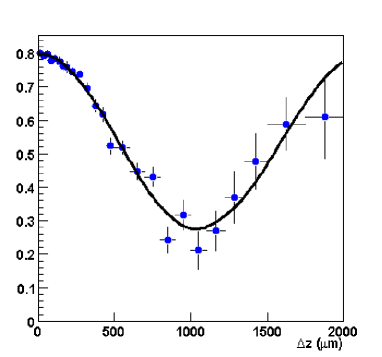
For this last case, considering signal events the fraction of mixed events can be expressed as where is the mixed signal fraction within a time interval (). This fraction is shown for charged and neutral B on Figure 5. The oscillatory term is clearly visible for the neutral B. If the whole range in is used one has [4]. However from Figure 5 it can be seen that all the information about is contained in the region close to 0. This range can be optimized in order to reduce the statistical uncertainty due to the loss of information of a counting method compared to a full likelihood fit and is shown in Figure 5. The two methods are complementary since the counting one is simple, has a weak dependence on the resolution function (which is however obtained from data), but needs as an input . The full likelihood fit performs simultaneously the extraction of the mistag fractions, the main parameters of the resolution function and .
The figure of merit for the tagging is since . The results are given in Table 3 for an integrated luminosity of 8.9 [6].
The overall quality factor is of the order of 28%. The results of the two methods (full likelihood and counting) are in agreement. The main systematics are due the knowledge of the backgrounds (for the sample), the z resolution and the MC statistics.
| tag | Mistag fraction() | |
|---|---|---|
| K | ||
| NT1 | ||
| NT2 |
1.4 BR() and BR
With an integrated luminosity of about 19000 are reconstructed in the mode. The invariant mass plot is shown in Figure 6 where both the and the Cabibbo suppressed decay are clearly visible. The branching ratio BR( is extracted[7]:
The last and dominating uncertainty is due to the bad knowledge of the branching ratio of the decay [4]. Once a is found it can be paired with photons in order to try to reconstruct the decay . The Figure 6 shows the mass difference between the and the . The branching ratio
is obtained[7]. Both measurements are in agreement with the PDG2000 [4]. The branching ratios for the decay modes are measured using a partial reconstruction technique very similar to that used for the analysis : the is signed by the soft pion coming from its decay. The results are[7] :
The last systematical uncertainties are due to the mis-knowledge of the branching ratio.


2 Prospects
In view of drawing some prospects it is useful to note that the PEP-II machine is very well working : since June 1999 an integrated luminosity of 19.5 has delivered out of which 18 have been recorded by BABAR . In order to be able to make some previsions some anticipated evolutions have been done and are given in Table 4 [8].
| Year | Peak Lumi | |
|---|---|---|
| () | total | |
| 2000 | 2 | 25 |
| 2001 | 5 | 65 |
| 2002 | 8 | 145 |
| 2003 | 10 | 260 |
For the purpose of the prospects I will stop at the end of the year 2001 which corresponds to an integrated luminosity of 65 . No major detector upgrades are expected to happen before 2002. In 2002 trigger improvements will be necessary (z cuts at the level 1 trigger) in order to cope with the increased currents in the two beams (and backgrounds!). In addition the modules of the Silicon Vertex Tracker of the horizontal plane will be replaced because of the higher radiation level in that region. Finally the DIRC electronics will be modified. Drawing some prospects is not an easy task …only some examples are going to be shown.
2.1 prospects
With an integrated luminosity of has been measured to be [9]
. The list of the decay modes and the reconstructed number of events are given in Table 5.
| Mode | N(events) |
|---|---|
| () | |
| () | |
| () |
Out of these 170 events, 120 are tagged. With the expected integrated luminosity one should reach a statistical uncertainty of about 0.2 at the end of 2001 () and about 0.12 at the end of 2002 (). In addition, an important part of the systematical uncertainty is due to the statistics of the control samples and as such should decrease in the future. In addition other channels are going to be used to measure :
-
•
: a signal is already clearly visible in the data (Figure 7) and the yield is in agreement with the Monte Carlo expectation[10].
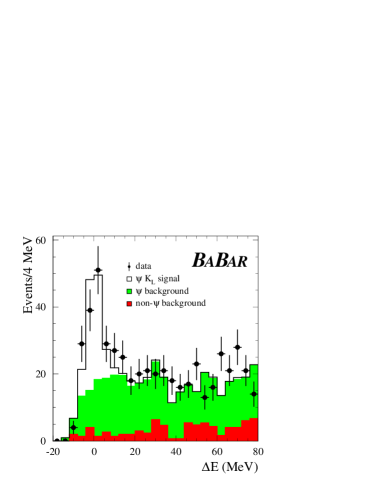
Figure 7: Comparison of data with Monte Carlo simulation for the decay. -
•
, with : the branching ratio is measured : and an angular analysis using the charged decay mode of the confirms the fact that it is mainly CP even so that the dilution of the CP asymmetry is going to be small.
-
•
: an analysis with partial reconstruction (one of the is reconstructed only via its and the other is fully reconstructed). This type of analysis has been exercized with the measurement using . From a full reconstruction in the mode 30 to 40 events are expected for .
This list is not exhaustive and other modes are also pursued (eg ) since it is interesting to try to measure separately with as many modes as possible in order to search for New Physics.
2.2 Charmless B decays prospects
As was shown at this conference by M. Neubert[11], with the measurement of a large number of charmless B decays, it should be possible to extract . In addition and should allow to measure the angle . Today, with an integrated luminosity of about 8 , the , branching ratios are measured with a precision of 25 to 30 %, and a 90 % CL limit is obtained for [12]. The results are given in Table 6 and compared with the results from CLEO [13] and BELLE[14].
| Mode | BABAR | BELLE | CLEO |
|---|---|---|---|
| at 90% CL | at 90% CL | at 90% CL |
At the end of 2001 the statistical uncertainty should be reduced by a factor 2.5 and the region of theoretical interest should be reached. Concerning up to now only a branching ratio has been measured [15] :
. There is not at the present stage enough experimental information to be able to draw some precise prospects on the time dependent measurement of .
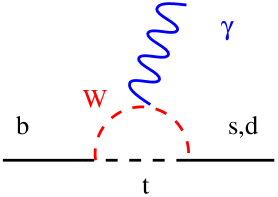
2.3 prospects
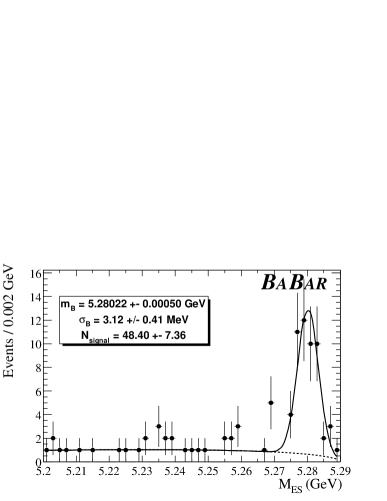
This decay mode is due to the penguin diagram shown in Figure 8. In the Standard Model the branching ratio is expected to be of the order of . It is however sensitive to new particles in the loop and could be enhanced by New Physics. With an integrated luminosity of about 8 the branching ratio has been measured [16]:
The beam energy substituted mass is shown in Figure 8. At the end of 2001, with 65 , this decay mode should be precisely measured. However, the measurement will probably be systematically limited at that time and one will have to perform more inclusive analyses () or search for higher resonance. The decay mode will also be searched for in order to compare it to to obtain some information on .
3 Conclusion
The measurements of the Unitarity Triangle are the first priority for BABAR not only to validate the Standard Model but also to search for New Physics. This will be done with the measurements of the same Unitarity Triangle angle with as many modes as possible. These measurements have already started for the easiest modes, and the first building blocks are in place in the other cases.
Not only the “sparkling” analyses are important (and done!) : some competitive physics results have already been obtained by the BABAR collaboration. In the near future we will have in hand a clean sample of B mesons of an unprecedented size and we will use them in order to take part in the understanding of the overall picture of the B decays.
Due to lack of time I have not presented any prospects on charm and physics but these two important subjects are studied also by the BABAR collaboration.
Finally I would like to add that recording, reconstructing and analysing an integrated luminosity of 65 is both a hardware and a software challenge.
Acknowledgements
I would like to thank all my BABAR colleagues who helped me in preparing this talk, in particular G. Bonneaud for the informations on the upgrade. Finally many thanks to Stéphane Plaszczynski for the careful reading of this proceedings.
References
- [1] G. Sciolla, First results from BABAR, 2000 CP Physics Conference, Ferrara, September 2000.
- [2] BABAR Collaboration,SLAC-PUB-8531.
- [3] BABAR Collaboration,SLAC-PUB-8529.
- [4] D.E. Groom et al, The European Physical Journal C15, 1 (2000).
- [5] BABAR Collaboration,SLAC-PUB-8532.
- [6] BABAR Collaboration,SLAC-PUB-8530.
- [7] BABAR Collaboration,SLAC-PUB-8535.
-
[8]
BABAR Collaboration, Detector Upgrades,
http://www.slac.stanford.edu/BFROOT/www/
Detector/Upgrades/FINALREPORT.pdf - [9] BABAR Collaboration,SLAC-PUB-8540.
- [10] BABAR Collaboration,SLAC-PUB-8527.
- [11] M. Neubert, QCD factorization and CP asymmetries in Hadronic B decays, 2000 CP Physics Conference, Ferrara, September 2000.
- [12] BABAR Collaboration,SLAC-PUB-8536.
- [13] R. A. Stroynowski, CLEO results on Charmless B meson decays, ICHEP2000, Osaka, July 2000.
- [14] P, Chang, Studies of charmless hadronic decays of B mesons with Belle, ICHEP2000, Osaka, July 2000.
- [15] BABAR Collaboration,SLAC-PUB-8537.
- [16] BABAR Collaboration,SLAC-PUB-8534.