New FOCUS results on charm mixing and CP violation
Abstract
We present a summary of recent results on CP violation and mixing in the charm quark sector based on a high-statistics sample collected by photoproduction experiment FOCUS (E831 at Fermilab). We have measured the difference in lifetimes for the decays: and . This translates into a measurement of the mixing parameter in the system, under the assumptions that is an equal mixture of CP odd and CP even eigenstates, and CP violation is negligible in the neutral charm meson system. We verified the latter assumption by searching for CP violating asymmetry in the Cabibbo suppressed decay modes , and . We report preliminary results on a measurement of the branching ratio .
1 INTRODUCTION
Particle-antiparticle mixing in the charm sector has distinctive features that make it a high sensitivity probe to search for New Physics. Recently, the possibility of collecting large, high-quality samples of fully reconstructed meson decays have germinated several new results [1]. In § 2 we review the basic formalism of charm mixing and CP violation (CPV), as well as the experimental techniques for measuring the mixing parameters. After briefly describing the FOCUS detector in § 3, in § 4 we report on a new measurement of the difference in lifetimes for the decays: and . In § 5 we show how we searched for CPV asymmetry in the Cabibbo suppressed decay modes , and . Finally, in § 6 we report preliminary results on a measurement of the branching ratio .
2 CHARM MIXING AND CPV
Let us recall the key features of particle-antiparticle mixing [2][3][4]. Because of weak interactions, flavor of a generic pseudoscalar neutral meson is not conserved. Therefore, it will try and decay with new mass eigenstates which no longer carry definite flavor : they are new states with different mass and lifetime where complex parameters and account for any CPV. The time evolution of is given by the Schrödinger equation. After a time the probability of finding the state transformed into is
| (1) | |||||
with definitions , and . The two states will oscillate with a rate expressed by and , which are usually calibrated by the average decay rate by means of the mixing parameters
| (2) |


In the case of charm mesons, because of the Cabibbo-favored decay mechanism and the large phase space available for their decay, decay widths are very similar , and the time-integrated ratio of mixed and nonmixed rates is
| (3) |
Theoretical estimates of traditionally fall into two main categories, short distance (SD) and heavy quark/long distance (HQ-LD): the former arise from the box diagram (Fig.1a), with GIM mechanism suppressing the charm case (Tab.1) or the dipenguin diagram, the latter come from QCD diagrams and final state interactions (FSI) such as rescattering of quarks with known intermediate light states (Fig.1c).
| c | ||||
| s | ||||
| t | ||||
| t |
Recently, OPE-based approaches have also been proposed[6].
An important comment was made recently[7] on the possibility of measuring separately from . Indeed, means that mixing is genuinely produced by transitions (either SD or HQ-LD, or both), while means that the fast-decaying component quickly disappears, leaving the slow-decaying component behind, which is a mixture of and . Infinite discussion is active on the extent to which the three contributions are dominant: consensus seems to exist on the HQ–LD being, in the case of charm mesons, larger than the SD, and in any case small. Standard Model predictions are
| (4) |
still somewhat below the PDG2000 limit[5] . Any observation of mixing above the predicted level, once HQ–LD effects are understood, is a signal that new physics contributions are adding to the box diagrams. A recent compilation of predictions on mixing is in Ref. [8]. Traditionally, mixing is searched for by means of event-counting techniques, while advances in event statistics now allow studies of the parameter.
2.1 Wrong sign vs right sign counting
Mixing is searched for in the decay chains
| (5) |
with the flavor of the neutral meson at production and at decay given by the sign of and respectively. In the case of a hadronic final state, life is complicated by pollution of the mixing by the Doubly-Cabibbo-Suppressed Decay , proportional to . The measurable – the rate of wrong-sign events – has therefore contributions[9] from DCSD, interference, and mixing
| (6) |
The X term (pure DCS) is characterized by exponential decay time behavior, unlike the Z term (pure mixing), and this feature can in principle be used to suppress the DCS pollution. The Y (interference) term receives contributions from , which can be nonzero if a) CPV is present, thus introducing a phase in ; and/or b) a strong phase is present, due to different FSI in the DCS and mixed CF decays. By assuming CP conservation, i.e., , defining
| (7) |
and measuring in units of we can write a simpler expression for
| (8) |
where the interference angle is given by . Equation 8 shows how a meaningful quote of the result must specify which assumptions where made on the CPV and strong angles and . In particular, it was recently pointed out in[10][11] how the possibility of a nonzero strong phase , which vanishes in the limit of unbroken SU(3) symmetry, should in fact be carefully taken into account in mixing, due to the experimentally known feature of SU(3) to be badly broken in D decays. If one assumes CP invariance , then
| (9) | |||
| (10) |
The alternative option in counting techniques is the use of semileptonic final states , which do not suffer from DCSD pollution but are harder experimentally.
2.2 Lifetime difference measurements
The parameter can be determined directly by measuring the lifetimes of CP=+1 and CP=–1 final states – such as and (CP=+1), (CP=–1) – and (mixed CP), assuming both CP conservation, i.e., that and are indeed CP eigenstates, and that is a mixed-CP eigenstate. We shall call such parameter , and if the above assumptions are verified
| (11) |
In principle, a measurement of would allow, along with an independent measurement of , limits to be set on .
2.3 CPV asymmetries
The assumption of negligible CPV in the charm system is important in the study of mixing. CPV occurs if the decay rate for a particle differs from the decay rate of its CP-conjugate particle [2]. In charm meson decays (as well as in and decays), two classes of CP violation exist: indirect and direct. In neutral charm meson decays, indirect CPV may arise due to mixing. In the case of direct violation, CP violating effects occur in a decay process only if the decay amplitude is the sum of two different parts, whose phases are made of a weak (CKM) and a strong contribution due to final state interactions [12]
| (12) |
The weak contributions to the phases change sign when going to the CP–conjugate process, while the strong ones do not. In singly Cabibbo-suppressed decays, penguin terms in the effective Hamiltonian may provide the different phases of the two weak amplitudes. The CP asymmetry will then be
| (13) | |||||
Compared to the strange and bottom sectors, the SM predictions of CPV for charm decays are much smaller, making the charm sector a good place to test the SM and to look for evidence of new physics. In the SM, direct CP violating asymmetries in decays are predicted to be largest in singly Cabibbo-suppressed decays, at most , and non-existent in Cabibbo-favored and doubly Cabibbo-suppressed decays[2]. However, a CP asymmetry could occur in the decay modes due to interference between Cabibbo-favored and doubly Cabibbo-suppressed decays.
3 FOCUS
The data for this paper were collected in the wideband photoproduction experiment FOCUS during the Fermilab 1996–1997 fixed-target run. FOCUS is a considerably upgraded version of a previous experiment, E687 [13]. In FOCUS, a forward multi-particle spectrometer is used to measure the interactions of high-energy photons on a segmented BeO target. We obtained a sample of over 1 million fully reconstructed charm particles in the three major decay modes: and .
The FOCUS detector is a large-aperture, fixed-target spectrometer with excellent vertexing, particle identification, and reconstruction capabilities for photons and ’s. A photon beam is derived from the bremsstrahlung of secondary electrons and positrons with an GeV endpoint energy produced from the 800 GeV/ Tevatron proton beam. The charged particles that emerge from the target are tracked by two systems of silicon microvertex detectors. The upstream system, consisting of four planes (two views in two stations), is interleaved with the experimental target, while the other system lies downstream of the target and consists of twelve planes of microstrips arranged in three views. These detectors provide high-resolution separation of primary (production) and secondary (decay) vertices with an average proper time resolution of for two-track vertices. The momentum of a charged particle is determined by measuring its deflections in two analysis magnets of opposite polarity with five stations of multiwire proportional chambers. Three multicell threshold Cerenkov counters are used to discriminate between pions, kaons, and protons, and complement the electron identification provided by the em calorimetry. For each charged track, the Cerenkov particle identification algorithm generates a set of -like variables where ranges over the electron, pion, kaon, and proton hypotheses.
4 SEARCH FOR CP-VIOLATING ASYMMETRIES
We have studied[14] the Cabibbo-suppressed decay modes that have the largest combination of branching fraction and detection efficiency. For this reason we selected the all-charged decay modes , , and (charge conjugate state implied, unless otherwise noted). In decays the charged is self-tagging and the neutral is tagged as a or as a by using the sign of the bachelor pion in the decay. The CP asymmetry parameter measures the direct CP asymmetry in the case of and the combined direct and indirect CP asymmetries for .
Before searching for CP asymmetry we must account for differences, at the production level, between and in photoproduction (the hadronization process, in the presence of remnant quarks from the nucleon, gives rise to production asymmetries[15]). This is done by normalizing to the Cabibbo-favored modes and , with the additional benefit that most of the corrections due to inefficiencies cancel out, reducing systematic uncertainties. An implicit assumption is that there is no measurable CPV in the Cabibbo-favored decays. The CP asymmetry can be written as:
| (14) |
where is (considering, for example, the decay mode ):
where is the number of reconstructed candidate decays and is the efficiency obtained from montecarlo simulations.
Table 2 shows the asymmetry numbers obtained by FOCUS, compared to previous published asymmetry measurements. The statistical error of the neutral decay channel is not as good as the charged one, since tagging is necessary to determine the flavor of the parent . There is no clear evidence for CPV in our measurements, which correspond to new limits two-three times better than the previous measurements by E791.
5 LIFETIME DIFFERENCES AND MIXING PARAMETER
We have studied[16] the mixing parameter by measuring the difference in lifetimes for the decays: and .
5.1 Event selection
The cuts used to obtain a clean signal were designed to produce a nearly flat efficiency in reduced proper time , which is defined as the proper time subtracted event-by-event by the minimum amount of detachment required between primary and secondary vertices. Our quoted result was based on requiring a minimum detachment and kaon hypothesis over pion hypothesis in Cerenkov response favored for kaon candidates. Then we either require a tag, or a set of more stringent cuts, such as more stringent Cerenkov requirements on kaons and pions, momenta of decay particles balancing each other, primary vertex inside the target material, and resolution of proper time less than 60 fs. The tagged sample has a better signal-to-noise ratio, while the inclusive sample accommodates larger sample size. From the combination of two samples, we obtain 119 738 and 10 331 events (Fig. 2).


5.2 Fitting technique
The sample is characterized by a prominent reflection background coming from misidentified decays (Fig. 2). We accommodate the reflection effect by using a modified version of the mass sideband subtraction fitting technique used in the E687 experiment[13]. The amount of reflection is obtained by a mass fit to the sample and the shape of the reflection is deduced from a high-statistics montecarlo sample. We assume that the time evolution of the reflection is described by the lifetime of and we fit the reduced proper time distributions of the and samples at the same time. The fit parameters are the lifetime, the lifetime asymmetry , and the number of background events under each and signal region. The signal contributions for the , and the reflection from the misidentified in the reduced proper time histograms are described by a term
| (15) |
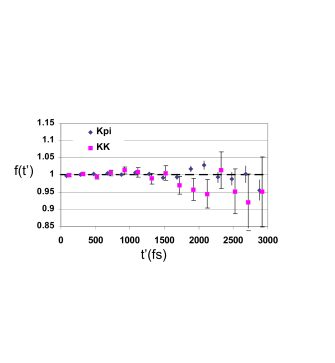
in the fit likelihood function. The function , determined from montecarlo, covers any deviation of the reduced proper time distribution from a pure exponential due to acceptance (Fig. 3).

The background yield parameters are either left floating, or fixed to the number of events in mass sidebands using a Poisson penalty term in the fit likelihood function. We choose 200 fs as the bin size of the reduced proper time, which is large compared to our proper time resolution. Twenty bins are used in the fit (Fig. 4).
The systematic errors are estimated by changing the selection cuts and by trying different fitting methods. We tested the Cerenkov identification hypothesis for kaon candidates and the minimum detachment required between primary and secondary vertices. The former affects the level of reflection backgrounds, the latter affects the amount of non-charm backgrounds. We tried different numbers of histogram bins and two options of background handling, as stated in the previous subsection. Other variations of selection and fitting yielded results consistent with our number. We obtained
| (16) | |||
| (17) |
Our result on has a statistical error only. Detailed systematics studies, including absolute distance scale, are needed to obtain the final number.
6 PRELIMINARY MEASUREMENT OF
As described in § 2.1, the can decay to through two physical processes: 1) by a DCS decay or 2) by mixing to followed by the CF decay to . The Standard Model predicts a DCS to CF branching ratio of the order . The Standard Model predictions for mixing rate were discussed in § 2. We also discussed how CP violation can cause rate asymmetries for both mixing and DCS decays. In this analysis[17] we ignore possible CPV effects which, in the SM, are expected to be small compared to the current experimental sensitivity.
The selection algorithms and analysis cuts are identical for both the mode under study and the normalizing mode . To separate these modes we tag the flavour of the neutral meson via the decay . In describing the event selection procedure we shall refer to the events consistent with the (dominant) CF process as right-sign (RS) tagged, and to the events consistent with DCS decay or mixing as wrong-sign (WS) tagged.

6.1 Event selection
Candidate events consist of a pair of oppositely charged tracks that form a vertex and have a invariant mass between 1.7 and 2.1 GeV/. These candidates are used as a seed to search for a suitable production vertex consisting of at least two other charged tracks. The production vertex is required to be isolated from both candidate daughter tracks, the production vertex is also required to be in target material. The production and decay vertices have to be well separated, and both primary and secondary have to be formed with a good confidence level. To remove background that results from a high-momentum track paring with a random low-momentum track to form a candidate, we apply a momentum-dependent cut is applied that removes highly asymmetrical pairs.
Doubly misidentified pairs from decays form a broad peak directly under the signal in and a narrow peak in the mass difference signal region. The mass difference background is indistinguishable from the real WS tagged signal. To eliminate this background, the invariant mass is computed with the kaon and pion particle hypotheses swapped. Any candidate whose swapped mass is within of the mass is subjected to a cut on the sum of the separations for both tracks. Finally, all tracks in the production vertex are tested as potential candidates, and are accepted if within a window of the nominal mass difference, and if they satisfy a loose Cerenkov cut.

6.2 Fitting technique
Reflections from partially reconstructed and/or misidentified decays with a real can contribute significantly to the WS signal. The measurement method adopted allows one to deal with reflections and feed downs from all known decays ( and reconstructed as , partially reconstructed, and partially reconstructed and doubly misidentified). To deal with these backgrounds we isolate the true decays by fitting the invariant mass distribution. The invariant mass distribution is generated by splitting the RS and WS tagged samples into 1-MeV-wide bands in the mass differences (Fig.5). Reflections ( and ) are fit to montecarlo line shapes, the unstructured background is fit to a polynomial, and the signal is fit to a Gaussian. The fitted yields are plotted as a function of the appropriate mass difference bins (Fig.6). By fitting the in this way we generate a mass difference distribution that has only true events: the signal is true events with a true tag, and the background is true with a random tag. The random tagged events form a smooth threshold background which is parametrized by the function
| (18) |
where and are free fit parameters. The RS signal is used in the fit as a shape model for the WS signal. At each fit iteration, the RS background – fit outside the signal region – is subtracted from the RS distribution. The final fit parameter is a scale factor used to match the background-subtracted RS signal to the WS signal. In the WS signal region the total fit function is the sum of the scaled RS signal and the WS background parametrization. This signal scale factor is the WS to RS branching ratio. The fit is shown in Fig.6, and we obtain a preliminary WS to RS branching ratio (statistical error only)
| (19) |
From the fit we find RS events corresponding to a WS equivalent yield of . The result above is preliminary, only the statistical error is quoted.
7 CONCLUSIONS
We have presented a measurement of the and lifetime indicating that the eigenstate has a shorter lifetime than
| (20) |
Our value is compared in Tab. 3 with E791 and BELLE. Also reported is the recent CLEO measurement of by studying the time evolution of WS hadronic decays (see § 2.1). Comparison with the CLEO measurement is not clear because of lack of information on the strong phase [10][11], and any comparison of the and the into one parameter should be taken cum grano salis. [22]
We have also presented new limits on CPV asymmetries for Cabibbo-suppressed decays such as , and . All results are consistent with zero, with errors at the percent level.
Finally, we showed a preliminary measurement of the WS to RS branching ratio, which, assuming no mixing, corresponds to (statistical error only)
| (21) |
This preliminary result preludes a full-blown lifetime analysis which soon will provide the FOCUS measurement of the mixing parameter.
We wish to acknowledge the assistance of the staffs of the Fermi National Accelerator Laboratory, the INFN of Italy, and the physics departments of the collaborating institutions. This research was supported in part by the U. S. A. National Science Foundation, the U. S. A. Department of Energy, the Italian Istituto Nazionale di Fisica Nucleare and Ministero dell’Università e della Ricerca Scientifica e Tecnologica, the Brazilian Conselho Nacional de Desenvolvimento Científico e Tecnológico, CONACyT-México, the Korean Ministry of Education, and the Korean Science and Engineering Foundation.
References
- [1] For recent experimental reviews see P. D. Sheldon, hep-ex/9912016; S. Bianco, hep-ex/9911034.
- [2] I. I. Bigi and A. I. Sanda, “CP violation,” Cambridge, UK: Univ. Pr. (2000) 382 p.
- [3] G. C. Branco, L. Lavoura and J. P. Silva, “CP violation,” Oxford, UK: Clarendon (1999) 511 p.
- [4] E. Leader and E. Predazzi, “An introduction to gauge theories and modern particle physics”, Cambridge 1996, ISBN 0 521 57742 X.
- [5] D.E.Groom et al. (PDG), Eur. Phys. Jour, C15 (2000) 1.
- [6] I. I. Bigi and N. G. Uraltsev, hep-ph/0005089.
- [7] T. Liu, CHARM 2000, hep-ph/9408330; FCNC 97, Santa Monica, February 1997 hep-ph/9706477.
- [8] H.N. Nelson, hep-ex/9908021.
- [9] I.I. Bigi, 23rd ICHEP, Berkeley, 1986 (SLAC-PUB-4074), S.C. Loken (Ed.), World Scientific, 1986, p.857 ; G. Blaylock, et al., Phys. Lett. B355, 555 (1995).
- [10] A. F. Falk, et al., JHEP 9912, 019 (1999).
- [11] S. Bergmann, et al., Phys. Lett. B486, 418 (2000).
- [12] F. Buccella et al., Phys.Rev. D51 (1995) 3478.
- [13] P. L. Frabetti et al. [E687 Coll.], Nucl. Instrum. Meth. A320, 519 (1992).
- [14] J. M. Link et al. [FOCUS Coll.], Phys. Lett. B491, 232 (2000).
- [15] P.L. Frabetti et al. [E687 Coll.], Phys. Lett. B370 (1996) 222.
- [16] J. Wiss [FOCUS Coll.], seminar at Fermilab April 2000; D. Kim, Proc. BEACH2000; J. M. Link et al., Phys. Lett. B485, 62 (2000).
- [17] J.M. Link [FOCUS Coll.], Proc. DPF2000, Columbus, Ohio (USA), presented by J.M. Link.
- [18] P.L. Frabetti et al. [E687 Coll.], Phys. Rev. D50 (1994) R2953.
- [19] E.M. Aitala et al. [E791 Coll.], Phys. Rev. Lett. 83 (1999) 32.
- [20] R. Godang et al. [CLEO Coll.], Phys. Rev. Lett. 84, 5038 (2000).
- [21] J. Tanaka, hep-ex/0010078.
- [22] Papers which have commented on the FOCUS result to-date: M. Gronau et al., hep-ph/0010237; A.A. Petrov, hep-ph/0009160; M. Battaglia, hep-ex/0009026; Y. Nir, hep-ph/0008226; D. Atwood et al., hep-ph/0008090; J.P. Silva, hep-ph/0007214; J.L. Rosner, hep-ph/0007194; J.L. Rosner, hep-ph/0005258; S. Bergmann et al., hep-ph/0005181.