Measurement of the Lifetime
Abstract
The lifetime is measured using 9.0 fb-1 of annihilation data collected on or just below the resonance with the CLEO II.V detector at CESR. Using an unbinned maximum likelihood fit, the lifetime is measured to be fs. The precision of this colliding beam measurement is comparable to other measurements, which are based on fixed-target experiments, with different systematic uncertainties.
A. H. Mahmood,1 S. E. Csorna,2 I. Danko,2 K. W. McLean,2 Sz. Márka,2 Z. Xu,2 R. Godang,3 K. Kinoshita,3,***Permanent address: University of Cincinnati, Cincinnati, OH 45221 I. C. Lai,3 S. Schrenk,3 G. Bonvicini,4 D. Cinabro,4 S. McGee,4 L. P. Perera,4 G. J. Zhou,4 E. Lipeles,5 S. P. Pappas,5 M. Schmidtler,5 A. Shapiro,5 W. M. Sun,5 A. J. Weinstein,5 F. Würthwein,5,†††Permanent address: Massachusetts Institute of Technology, Cambridge, MA 02139. D. E. Jaffe,6 G. Masek,6 H. P. Paar,6 E. M. Potter,6 S. Prell,6 V. Sharma,6 D. M. Asner,7 A. Eppich,7 T. S. Hill,7 R. J. Morrison,7 H. N. Nelson,7 R. A. Briere,8 G. P. Chen,8 B. H. Behrens,9 W. T. Ford,9 A. Gritsan,9 J. Roy,9 J. G. Smith,9 J. P. Alexander,10 R. Baker,10 C. Bebek,10 B. E. Berger,10 K. Berkelman,10 F. Blanc,10 V. Boisvert,10 D. G. Cassel,10 M. Dickson,10 P. S. Drell,10 K. M. Ecklund,10 R. Ehrlich,10 A. D. Foland,10 P. Gaidarev,10 R. S. Galik,10 L. Gibbons,10 B. Gittelman,10 S. W. Gray,10 D. L. Hartill,10 B. K. Heltsley,10 P. I. Hopman,10 C. D. Jones,10 J. Kandaswamy,10 D. L. Kreinick,10 M. Lohner,10 A. Magerkurth,10 T. O. Meyer,10 N. B. Mistry,10 E. Nordberg,10 J. R. Patterson,10 D. Peterson,10 D. Riley,10 J. G. Thayer,10 D. Urner,10 B. Valant-Spaight,10 A. Warburton,10 P. Avery,11 C. Prescott,11 A. I. Rubiera,11 J. Yelton,11 J. Zheng,11 G. Brandenburg,12 A. Ershov,12 Y. S. Gao,12 D. Y.-J. Kim,12 R. Wilson,12 T. E. Browder,13 Y. Li,13 J. L. Rodriguez,13 H. Yamamoto,13 T. Bergfeld,14 B. I. Eisenstein,14 J. Ernst,14 G. E. Gladding,14 G. D. Gollin,14 R. M. Hans,14 E. Johnson,14 I. Karliner,14 M. A. Marsh,14 M. Palmer,14 C. Plager,14 C. Sedlack,14 M. Selen,14 J. J. Thaler,14 J. Williams,14 K. W. Edwards,15 R. Janicek,16 P. M. Patel,16 A. J. Sadoff,17 R. Ammar,18 A. Bean,18 D. Besson,18 R. Davis,18 N. Kwak,18 X. Zhao,18 S. Anderson,19 V. V. Frolov,19 Y. Kubota,19 S. J. Lee,19 R. Mahapatra,19 J. J. O’Neill,19 R. Poling,19 T. Riehle,19 A. Smith,19 C. J. Stepaniak,19 J. Urheim,19 S. Ahmed,20 M. S. Alam,20 S. B. Athar,20 L. Jian,20 L. Ling,20 M. Saleem,20 S. Timm,20 F. Wappler,20 A. Anastassov,21 J. E. Duboscq,21 E. Eckhart,21 K. K. Gan,21 C. Gwon,21 T. Hart,21 K. Honscheid,21 D. Hufnagel,21 H. Kagan,21 R. Kass,21 T. K. Pedlar,21 H. Schwarthoff,21 J. B. Thayer,21 E. von Toerne,21 M. M. Zoeller,21 S. J. Richichi,22 H. Severini,22 P. Skubic,22 A. Undrus,22 S. Chen,23 J. Fast,23 J. W. Hinson,23 J. Lee,23 D. H. Miller,23 E. I. Shibata,23 I. P. J. Shipsey,23 V. Pavlunin,23 D. Cronin-Hennessy,24 A.L. Lyon,24 E. H. Thorndike,24 C. P. Jessop,25 H. Marsiske,25 M. L. Perl,25 V. Savinov,25 X. Zhou,25 T. E. Coan,26 V. Fadeyev,26 Y. Maravin,26 I. Narsky,26 R. Stroynowski,26 J. Ye,26 T. Wlodek,26 M. Artuso,27 R. Ayad,27 C. Boulahouache,27 K. Bukin,27 E. Dambasuren,27 S. Karamov,27 G. Majumder,27 G. C. Moneti,27 R. Mountain,27 S. Schuh,27 T. Skwarnicki,27 S. Stone,27 G. Viehhauser,27 J.C. Wang,27 A. Wolf,27 J. Wu,27 and S. Kopp28
1University of Texas - Pan American, Edinburg, TX 78539
2Vanderbilt University, Nashville, Tennessee 37235
3Virginia Polytechnic Institute and State University, Blacksburg, Virginia 24061
4Wayne State University, Detroit, Michigan 48202
5California Institute of Technology, Pasadena, California 91125
6University of California, San Diego, La Jolla, California 92093
7University of California, Santa Barbara, California 93106
8Carnegie Mellon University, Pittsburgh, Pennsylvania 15213
9University of Colorado, Boulder, Colorado 80309-0390
10Cornell University, Ithaca, New York 14853
11University of Florida, Gainesville, Florida 32611
12Harvard University, Cambridge, Massachusetts 02138
13University of Hawaii at Manoa, Honolulu, Hawaii 96822
14University of Illinois, Urbana-Champaign, Illinois 61801
15Carleton University, Ottawa, Ontario, Canada K1S 5B6
and the Institute of Particle Physics, Canada
16McGill University, Montréal, Québec, Canada H3A 2T8
and the Institute of Particle Physics, Canada
17Ithaca College, Ithaca, New York 14850
18University of Kansas, Lawrence, Kansas 66045
19University of Minnesota, Minneapolis, Minnesota 55455
20State University of New York at Albany, Albany, New York 12222
21Ohio State University, Columbus, Ohio 43210
22University of Oklahoma, Norman, Oklahoma 73019
23Purdue University, West Lafayette, Indiana 47907
24University of Rochester, Rochester, New York 14627
25Stanford Linear Accelerator Center, Stanford University, Stanford, California 94309
26Southern Methodist University, Dallas, Texas 75275
27Syracuse University, Syracuse, New York 13244
28University of Texas, Austin, TX 78712
Lifetime measurements of heavy quark mesons and baryons provide an important window into the non-perturbative sector of heavy quark decay. Contrary to initial expectations [1], mechanisms other than spectator quark decay make significant contributions to the lifetimes of weakly decaying charm mesons and baryons. Charm baryon lifetimes differ by large amounts (e.g. :: 4:2:1) [2], as is also seen in the charm mesons. However, the underlying reasons for this pattern may be different than for the mesons as exchange in baryon decay is neither helicity nor color-suppressed. Other effects, such as Pauli interference, may also play a different role in the baryon sector [1]. This paper reports a new measurement of the lifetime of the , the lowest-mass charm baryon, with a precision comparable to that from measurements of the charm meson lifetimes. The data used in this analysis were obtained in an colliding beam environment, where the event topologies and backgrounds are very different from those encountered in high energy fixed-target experiments [3], which have historically provided the most precise measurements of charm hadron lifetimes [2].
This analysis uses an integrated luminosity of 9.0 fb-1 of annihilation data recorded with the CLEO II.V detector at the Cornell Electron Storage Ring (CESR). The data were taken at energies at or slightly below the resonance ( GeV) and contain approximately 11 million events. The CLEO II.V detector upgrade consists of an interaction region (IR) and a change in the gas used in the primary tracking volume (refer to [4] for a detector description before the upgrade). The IR consists of a small-radius, low-mass beam pipe surrounded by a three-layer double-sided silicon vertex detector (SVX). The SVX records precision 3-dimensional tracking information close to the interaction point [5, 6]. The proximity of the SVX to the IR, combined with the low mass beam-pipe, delivered excellent vertex resolution. The momentum resolution was enhanced as a result of replacing the primary tracking volume gas from a 50:50 mixture of argon-ethane to a 60:40 mixture of helium-propane. This change increased the hit efficiency and decreased the effects of multiple scattering. The helium-propane replacement also enhanced specific ionization information used for particle identification. Further, to optimize the data from the upgraded detector, a Kalman filter track reconstruction package [7] was implemented. The response of the CLEO detector to both signal and background events was simulated in detail using a GEANT-based [8] Monte Carlo package.
The is reconstructed in the decay mode (the charge conjugate mode is implied throughout this paper). General track quality and event shape cuts are used to remove poorly reconstructed tracks and non-hadronic events. A decay vertex measurement is needed for a proper time measurement, so we require at least two of the three decay tracks to have 2 or more hits simultaneously on a track in both the and [9] views. The efficiency to have two or more SVX hits simultaneously in both views is 95% per track, yielding 99% efficiency per ; the average decay vertex resolution was about 110 m.
The combinatoric background to the signal is suppressed by taking advantage of the detector upgrades. Tracks forming a candidate are required to originate from a common vertex () in a 3-dimensional vertex fit. We require the vertex fit probability to be . Particle identification information from specific ionization must be consistent with the daughter hypothesis. Electrons are rejected using drift chamber and calorimeter information. Backgrounds tend to populate the low track momentum spectrum and low momentum spectrum. Each decay track is therefore required to have momentum greater than 0.3 GeV/, and the momentum is required to be greater than 2.6 GeV/. As a result of these cuts, the selected ’s have an average momentum of 3.3 GeV.
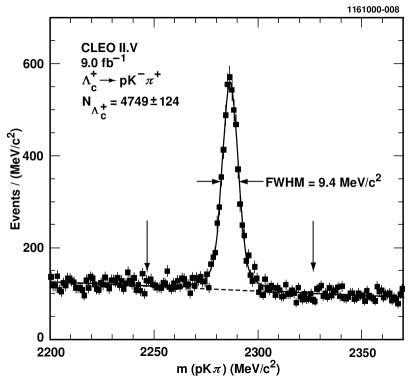
Combinatoric backgrounds from random combinations of tracks from , , and decays, which may populate the reconstructed mass region non-uniformly and bias the lifetime result, are studied using data and Monte Carlo. From tests using CLEO data and Monte Carlo simulated events, we find that events (where one of the pions passes the proton requirements) preferentially populate the reconstructed mass region above the mass peak. Such events are a potentially problematic kinematic reflection that we remove by rejecting candidates whose reconstructed mass is consistent with a mass when the proton hypothesis is changed to a pion hypothesis. All other backgrounds (e.g. ) are found to be either uniform throughout the mass region or small enough not to affect the final lifetime result.
The reconstructed mass distribution of the candidates is shown in Fig. 1, and a fit to the data yields 4749 124 signal events. The mass distribution is fit using two Gaussians (, ) constrained to a common mean for the signal and a linear function for the background. The fraction of background in the mass region within 7 MeV/ (1.94 ) of the fitted mass value is 27.2%, while 85.2% of the ’s are within this region as well.
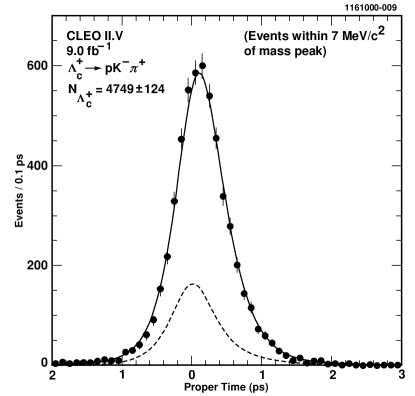
The production point () is needed for the proper time determination. A run-averaged beam centroid determined from two-track and hadronic events provides an estimate of the production point. The dimensions of the beam profile are about 350 m, 7 m, and 1 cm along the , , and directions, respectively, as determined by CESR [10] optics. Given the extent of the profile in and , the measurement is effectively determined by the component. The -components of the decay length, , and momentum, , are used to determine the proper decay times, calculated from using the PDG [2] world average for . The decay length variance is calculated using the results of the vertex fit and the beam profile dimension uncertainties. The proper time distribution for the candidates within 7 MeV/ of the signal peak is shown in Fig. 2. The average decay length is about 80 m, comparable to the vertex resolution.
The lifetime is extracted from the proper time distribution with an unbinned maximum likelihood fit [11]. There are three inputs to the fit for each candidate: the measured proper time , the estimated uncertainty of the measured proper time , and a reconstructed mass-dependent signal probability . The signal probability distribution is obtained from a fit of the reconstructed mass distribution to two Gaussians constrained to the same mean for the signal and a linear function for the background. The likelihood function is
| (3) | |||||
where the product is over the candidates, , and . The seven output parameters of the lifetime fit are , , , , , and . The parameter is the lifetime. Each candidate is weighted in the fit according to its proper time uncertainty . The fit allows for a global scale factor for the proper time uncertainty estimates. For a small fraction of candidates the fitted uncertainty underestimates the true uncertainty. Track reconstruction errors such as those caused by hard multiple scattering are examples of such mismeasurements. The proper time distribution of the background is modeled by a fraction having a background lifetime with the remaining background having zero lifetime. In order to estimate the background properties, we include the candidates in a wide region of MeV/ ( 11.1 ) around the nominal mass in the unbinned maximum likelihood fit. We account for mismeasured candidates with two Gaussians in the fit. In order to accommodate a small fraction of candidates that fall outside the resolution parameterization, a wide Gaussian ( = 8 ps) is used to approximate a flat distribution. Fig. 2 shows the proper time distribution of events within MeV/ of the signal peak and the results of the unbinned maximum likelihood fit scaled to the MeV/ reconstructed mass region. The fit converges to fs, where the uncertainty is statistical only, and the correlations between the lifetime and the other fit parameters range from to 0.10.
Consistency checks are performed by measuring the lifetime as functions of azimuthal angle, polar angle, momentum of the candidate, charge of the candidate, and data taking period. No statistically significant variation is found in any of these variables. The lifetime is also measured as a function of reconstructed mass in the background regions for CLEO data and simulated Monte Carlo events. The lifetimes are consistent with being uniform, and thus properly parameterized.
| Contribution | Uncertainty (fs) |
|---|---|
| Decay vertex resolution | |
| Global detector scale | |
| Beam spot position | negligible |
| mass measurement | |
| momentum measurement | |
| Signal probability from mass fit | |
| – correlation | |
| Large proper times | |
| Statistics of Monte Carlo sample | |
| Total |
The contributions considered in the systematic uncertainty for the lifetime are listed in Table I and are described below. Decay vertex measurement errors lead to decay length errors which in turn could lead to an error in the lifetime measurement. A m bias in the decay vertex position is estimated from a “zero-lifetime” sample of events. To obtain the corresponding proper time bias, the error of the decay vertex position bias is multiplied by the average 1/ of the candidates. The vertices of events having interactions at the beam pipe are used to determine a relative radial position uncertainty of %. The quadrature sum of these uncertainties yields the systematic uncertainty due to the decay vertex measurement. The global detector scale is known to a precision of % from detailed surveys using beam pipe interactions. A systematic uncertainty of fs is assigned. In order to determine the sensitivity of the analysis to the beam spot position, the vertical beam spot position is shifted m, the uncertainty of the beam spot position, and the decay lengths of the candidates from CLEO data are recalculated. The differences between these shifted lifetimes and the nominal lifetime are included as a systematic uncertainty.
The uncertainty in the mass [2] and the momentum scale lead to systematic errors since these quantities are used in the conversion of decay lengths to proper times. The statistical uncertainty of the signal probability assigned to each candidate leads to systematic uncertainties in the fitted lifetimes, which are estimated by coherently varying the signal probability of each candidate by its statistical uncertainty and repeating the fits. There also exists a correlation between the measurements of the proper time and the candidate reconstructed mass . This correlation is measured in simulated events and confirmed in data to estimate a corresponding systematic uncertainty.
Poorly measured candidates are another source of systematic uncertainty. These candidates are accounted for in the unbinned maximum likelihood fit with a wide Gaussian that approximates a flat distribution ( = 8 ps). Another method of accounting for candidates with large proper times is to omit the wide Gaussian component from the likelihood function and fit the candidates in a restricted proper time interval. The systematic uncertainty due to these candidates is estimated from the maximum variation of in varying the width of the wide Gaussian from 8 to 12 ps and removing the wide Gaussian in a restricted proper time fit ( ps).
Other possible sources of lifetime measurement bias include selection requirements and parameterization of the background in the likelihood function. These are checked by performing the unbinned maximum likelihood fit on an artificial sample composed of background events extracted from annihilation data and simulated events with known average lifetime of 206.2 fs. Accurately measuring the lifetime of this combined sample is an important test of the unbinned maximum likelihood method. The lifetime obtained from the maximum likelihood fit, fs, is consistent with the known input lifetime of the signal Monte Carlo sample. The statistical uncertainty of this measured lifetime, 2.8 fs, is included as a contribution to the total systematic uncertainty. The lifetime difference of fs is subtracted from the lifetime extracted from data yielding a corrected lifetime of fs, where the uncertainty is statistical only. The total systematic uncertainty of 4.4 fs is obtained by adding the individual contributions in quadrature.
In summary, a new measurement of the lifetime using 9.0 fb-1 of integrated luminosity has been made with the CLEO II.V detector. The measured lifetime is fs, where the first uncertainty is statistical and the second systematic. This is the first lifetime measurement made in a non-fixed target environment.
We gratefully acknowledge the effort of the CESR staff in providing us with excellent luminosity and running conditions. This work was supported by the National Science Foundation, the U.S. Department of Energy, the Research Corporation, the Natural Sciences and Engineering Research Council of Canada, the A.P. Sloan Foundation, the Swiss National Science Foundation, the Texas Advanced Research Program, and the Alexander von Humboldt Stiftung.
REFERENCES
- [1] G. Bellini, I. Bigi, and P.J. Dornan, Phys. Rept. 289, 1 (1997) and references contained within.
- [2] Particle Data Group, D. E. Groom et al., Eur. Phys. J. C 15, (2000).
-
[3]
E687 Collaboration, P.L. Frabetti et al., Phys. Rev. Lett. 71,
827 (1993);
Phys. Lett. B 323, 459 (1994);
E691 Collaboration, J.R. Raab et al., Phys. Rev. D 37, 2391 (1988);
E791 Collaboration, E.M. Aitala et al., Phys. Lett. B 445, 449 (1999). - [4] CLEO Collaboration, Y. Kubota et al., Nucl. Instrum. Methods A 320, 66 (1992).
- [5] The inner radius of the beam pipe is 1.875 cm. The three layers of silicon are located at 2.35, 3.25, and 4.75 cm from the detector origin.
- [6] T. Hill, Nucl. Instrum. Methods A 418, 32 (1998).
- [7] P. Billoir, Nucl. Instrum. Methods A 255, 352 (1984).
- [8] We use a GEANT-based computer model to simulate the response of the CLEO detector. R. Brun et al., GEANT 3.15, CERN Report No. DD/EE/84-1 (1987).
- [9] The right handed coordinate system has the axis along the beam direction and the axis upward.
- [10] D. Cinabro et al., Phys. Rev. E 57, 1193 (1998).
- [11] G. Bonvicini et al., Phys. Rev. Lett. 82, 4586 (1999).