Recent Results From the K2K (KEK-to-Kamioka) Neutrino Oscillation Experiment
Abstract
The latest results of the K2K experiment are reported. The results are based on data taken from June, 1999, to June, 2000, corresponding to a total protons on target. Twenty seven fully-contained events in the 22.5 kton fiducial volume of Super-Kamiokande (SK) are observed. The expected number of events is estimated to be assuming the null oscillation hypothesis.
1 Introduction
For many years experiments studying neutrinos produced in interactions of cosmic rays with atmospheric nuclei have been measuring a significant suppression of the ratio of to with respect to the expectation derived from standard hadronic shower models [1, 2, 3, 4, 5, 6]. The popular interpretation of this suppression is that neutrino oscillations, in which change to some other neutrino flavour in flight, are occurring. Neutrino oscillations can only take place if the neutrino has a finite mass and if, as in the quark sector, the neutrino mass eigenstates are not the same the flavour eigenstates.
The probabilty of a neutrino with energy (GeV) produced a distance (km) from a detector to oscillate into another flavour is expressed (in the two-flavour approximation) as :
| (1) |
where is the difference between the squared masses of the two neutrino mass eigenstates and is a mixing parameter. The recent results from the Super-Kamiokande experiment [7] have presented strong evidence that the atmospheric neutrino problem can be described assuming the existence of neutrino oscillations with in the range to and at the 90% confidence level.
The K2K experiment is the first accelerator-based long baseline neutrino oscillation experiment. With a baseline of 250 km, an average neutrino energy of E1.3 GeV and an intense neutrino beam which is 98.0% pure , K2K is ideally placed to investigate neutrino oscillations in the oscillation parameter region favoured by Super-Kamiokande. The primary oscillation search mode is oscillations (the disappearance mode). However K2K can also investigate flavour oscillations through the appearance mode.
In this paper, the most recent results from K2K are presented. Section 2 describes the beam and the near detector components. Section 3 discusses the measurement technique and the calculation of the expected flux of neutrinos at Super-Kamiokande. Section 4 outlines the selection of KEK beam-related events in Super-Kamiokande, compares the number of events observed in Super-Kamiokande with the expected number and describes the systematic errors in the measurement. Finally, a conclusion is drawn in Section 5.
2 K2K Experiment
2.1 Beamline and beam monitors
| Neutrino Flavour | Flux Abundance |
|---|---|
| 98.0% | |
| 1.0% | |
| 1.0% |
The KEK neutrino beam is produced by 12 GeV/c protons incident on an aluminium target. The 66 cm long aluminium target is embedded in the first of two focussing horns which serve to focus(defocus) the positive(negative) pions and kaons produced by the proton-Aluminium interactions. The positive hadrons then passed to a 200 m long decay pipe where they decay, producing a wide-band neutrino beam with a mean energy of 1.3 GeV. The beam composition estimated from Monte Carlo simulation is shown in Table 1. The beam Monte Carlo program itself uses the proton beam profile before the target and generates , and secondary protons according to a parametrisation of existing data on secondary particle production in p-Al interactions[8]. GEANT 3.15[9] is then used to trace the secondary particles through the target, the magnetic horns, and into the decay tunnel.
Within the target hall, and before the decay pipe, a threshold gas Cerenkov detector (the pion monitor) has been constructed. This monitor can be moved in and out of the beam and is used to measure the energy and angular spectra of the secondary pions after focussing. The measurements are then used to verify the predictions of the beam Monte Carlo. Figure 1 compares the ratio of the flux seen in the far detector (see Section 3) and in the near detector as predicted by the pion monitor and by the beam simulation. Above a neutrino energy of 1 GeV (the lower limit of the pion monitor sensitivity) the pion monitor predictions and the beam simulation agree.

At the end of the decay pipe is an iron and concrete beam dump after which is positioned a segmented plate ionisation chamber and a set of silicon detectors. These monitor the residual beam-associated muons and are used to check the beam centering and intensity.
The direction from KEK to Super-Kamiokande along which to point the beam was surveyed using a method based on GPS[10]. The survey precision is and the construction precision is . Due to beam divergence over the 250 km flight path, the flux of neutrinos at Super-Kamiokande is constant over a distance of approximately one km around Super-Kamiokande, requiring a pointed accuracy of , well above the estimated accuracy.
2.2 The near detector
In a disappearance oscillation experiment it is essential that the neutrino beam at the point of production be understood completely. The understanding of the neutrino beam is the primary goal of the suite of detectors located 300 m downstream of the target. The near detector is composed of a one kiloton water Cerenkov detector (1kt) and a fine-grained detector (FGD).
The 1kt detector measures neutrino interactions using the same target and techniques as used in the far detector (Super-Kamiokande) thus cancelling many of the systematic errors in the calculation of the expected event rate in the far detector (see Section 3).
The FGD complements the one kiloton detector. It is used for precise measurements of the energy spectrum and flux, the beam profile and the contamination in the beam. The fine-grained detector consists of a scintillating fiber tracking detector (SciFi)[11], a lead-glass electromagnetic calorimeter and a large muon range detector (MRD).
The SciFi is constructed from 20 modules. Between each module is a 6 cm thick layer of aluminium tubes filled with water. These form the target for neutrino interactions in the SciFi. Such interactions are used to study the neutrino energy spectrum and for studying other properties of neutrino-water interactions at the 1 GeV energy scale.
Downstream of the SciFi is the lead-glass array. The purpose of the lead-glass array is to identify interactions. The energy resolution of the lead-glass detector is .
The muon range detector (MRD) is a large ( cross-sectional area) iron tracking calorimeter with a target mass of 915 tons. It consists of 12 iron plates interleaved with drift chambers. The four most upstream plates are 10 cm thick and the last eight plates are 20 cm thick. The MRD is used to monitor the beam profile, to study the stability of beam intensity and to determine the energy of muons from neutrino interactions in the MRD or SciFi using rangeout techniques.
3 Performance of the near detector and beam stability


Comparison of the expected and observed number of events in Super-Kamiokande depends on understanding the stability and characteristics of the neutrino beam profile and energy spectrum.
The neutrino beam profile measured in the MRD is shown in Figure 2. The beam profile is centered on Super-Kamiokande and is reproduced well by simulation. The Monte Carlo histogram has been normalised to the number of events in data. The center of the beam profile is plotted as a function of time in Figure 4. The beam direction has been stable within mrad throughout the running time of the experiment.
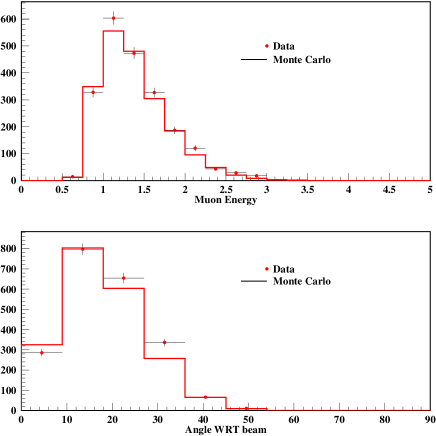
The energy and angular distributions of muons from neutrino interactions in the Scifi is shown in Figure 4. The simulation has been normalised to the number of events in data. The Monte Carlo shows good agreement with the data.
The number of events predicted to be observed at Super-Kamiokande () in the absence of neutrino oscillations is calculated using the observed number of events in the near detector () corrected for the differences in neutrino flux, target mass, detector efficiencies and livetimes between the near and far detector :
| (2) |
where is the detection efficiency of neutrino interaction in Super-Kamiokande(KEK), is the fiducial target mass at Super-Kamiokande(KEK), is the number of protons on target collected by Super-Kamiokande(KEK) and R is the ratio of the number of events expected at Super-Kamiokande and at KEK :
| (3) |
is calculated from the beam simulation.
| Detector | Expected number of events in SK |
|---|---|
| 1kt | |
| Scifi | |
| MRD |
The expected number of events observed in Super-Kamiokande based on the observed event rate in each of the near detector components, corresponding to a collected intensity of protons on target, are shown in Table 2. The errors are systematic with the statistical error being negligible. Despite different detection techniques and sources of systematic error, the predictions of the near detector components agree well. The error for the prediction using the 1kt detector is smaller than for the Scifi or MRD predictions, since the 1kt detectors uses the same target matrial and the same detection technique as used in Super-Kamiokande. Hence, the uncertainties in the neutrino-water interactions cross section and some detector-based biases cancel. For this reason, the prediction of the 1kt detector will be used when comparing with the observed number of events in Super-Kamiokande. The largest sources of systematic error in the expected number of events derived from the 1kt event rate are a 7% error in , the far-to-near ratio, and a 6% error in the measurement of the 1kt event rate. The extrapolation error arises from uncertainties in the pion monitor measurement and in modelling low energy neutrino production. The error in the 1kt rate arises mostly from uncertainties in vertex fitting and the propagation of these uncertainties into the fiducial volume estimate.
4 Events in Super-Kamiokande
KEK beam associated interactions in Super-Kamiokande are tagged by comparing the UTC time stamps of the Super-Kamiokande trigger and the KEK beam spill. If the event is indeed associated with the KEK beam, the difference between the two time stamps, , where is the time the neutrino takes to move between KEK and Super-Kamiokande, should be distributed between 0 and 1.1 , a reflection of the KEK beam spill width. The intrinsic time resolution of the GPS system is approximately 150 ns so a 1.5 search window is used. The contamination from atmospheric neutrino events in the Super-Kamiokande sample is estimated to be less than events over the running period to date.
The events collected at Super-Kamiokande are sorted into two categories : fully-contained (FC) events, in which the Cerenkov light from all particles in the event is contained in the Super-Kamiokande inner detector, and outer-detector (OD) events, in which the interaction occurs in the Super-Kamiokande anti-detector volume or in the rock surrounding the detector. The FC events are furthur subdivided into FC-in(out) events, in which the interaction occurs inside(outside) the 22.5 kt fiducial volume. The reconstruction efficiency and systematics of the FC-in events are well known and it is this category which will eventually be used in the full spectral analysis. The OD and FC-out events, which have larger systematic errors, are used as consistency checks on the event rate of the FC events. Other selection criteria for FC events are
-
1.
no activity 30 s before the event
-
2.
, the total number of photo-electrons collected in the inner detector in a 300ns timing window, must be greater than 200 photoelectrons, corresponding to 30 MeV energy threshold.
-
3.
, the number of hits in the largest cluster in the anti-detector must be less than 10.
The selection efficiency of events in Super-Kamiokande is approximately 80%, dominated by the 30 MeV energy threshold. Figure 5 shows the FC event distribution within 500 and 5 of the KEK beam spill.

| Data | No oscillation | ||||
|---|---|---|---|---|---|
| 1 ring -like | 14 | ||||
| 1 ring -like | 1 | ||||
| Multi Ring | 12 | ||||
| FC-in | 27 |
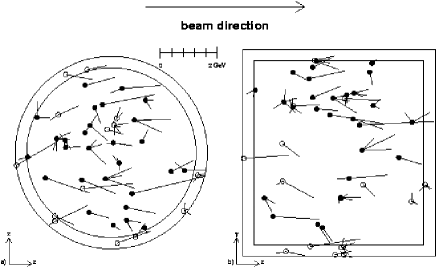
A clear peak corresponding to beam-associated events may be observed from -0.2 to 1.3 . The number of FC-in events and their characteristics are summarised in Table 3. The events are subdivided into events with a single Cerenkov ring (1-ring events) and multi-ring events. The 1-ring events are furthur decomposed into “mu-like” and “electron-like” events. The table also includes the expected number of events in each category for the case of no oscillations and for three sets of oscillation parameters. Figure 6 shows the fitted vertex distribution of all FC events in Super-Kamiokande. The direction and length of the lines on each vertex indicate the direction and momentum of each detected particle in the event. There is an obvious momentum flow in the direction of the KEK beam.
5 Summary
The K2K experiment has been running smoothly since June, 1999, and collected protons on target. The expected interaction rates at Super-Kamiokande as determined by the near detectors (SciFi, MRD and 1kton) are consistent with one another. The neutrino beam direction has been within of the direction to Super-Kamiokande throughout the experiment. Twenty seven KEK beam associated FC-in events have been observed in the Super-Kamiokande fiducial volume with a background of less than events. The expected number is in the case of null oscillations. Our data disfavor null oscillations at the level. With more data a definitive analysis of both the event rate and reconstructed energy spectrum of the events in the far detector will be carried out.
References
- [1] K.S.Hirata et al., Phys. Lett. B205, 416 (1988).
- [2] K.S.Hirata et al., Phys. Lett. B280, 146 (1992).
- [3] Y.Fukuda et al., Phys. Lett. B433, 9 (1998).
- [4] Y.Fukuda et al., Phys. Lett. B436, 33 (1998).
- [5] R.Becker-Szendy et al., Phys. Rev. D46, 3720 (1992).
- [6] W.W.M. Allison et al., Phys. Lett. B391, 491 (1997).
- [7] Y.Fukuda et al., Phys. Rev. Lett. 81, 1562 (1998).
- [8] Y.Cho et al., Phys. Rev. D4, 1967 (1971).
- [9] R. Brun et al., CERN DD/EE/84-1 (1987).
- [10] H.Noumi et al., Nucl. Instrum. Meth. A398, 399 (1997).
- [11] A.Suzuki et al., (K2K collab.), Nucl. Instrum. Meth. A453 165 (2000).