Measurement of Orthopositronium Decay Rate Using Powder: Integration of Thermalization into Time Spectrum Fitting Procedure
Abstract
The intrinsic decay rate of orthopositronium (o-Ps) formed in powder was measured using a modified method which determined the time dependence of the pick-off annihilation rate using high-energy-resolution germanium detectors. That is, the main systematic error due to thermalization was accounted for and integrated into the time spectrum fitting procedure. The averaged value was found to be , which agrees well with the QED prediction; varying 2.8-4.2 experimental standard deviations from other measurements.
1 Introduction
1.1 o-Ps lifetime problem
The bound state of an electron and positron, positronium (Ps), is a pure quantum electrodynamical system that provides a highly sensitive field for testing accurate descriptions of bound states in quantum field theory. The triplet () state of Ps, orthopositronium (o-Ps), will in most cases decay into three photons due to having odd-parity under the C-transformation. For the last two decades, vast number of theoretical works [1, 2, 3, 4, 5, 6, 7, 8] have been done to yield the decay rate of o-Ps, up to some partial results on correction. Recent theoretical efforts have evaluated the value up to corrections (7.039 934(10) [9]), order corrections (7.039 968(10) [10, 11]), and so far neglected binding energy corrections [12] which is apart from [9] by about . Therefore there still exists a level uncertainty on the theoretical side. The decay lifetime is sufficient such that a large number of direct measurements have been carried out [13, 14, 15, 16, 17, 18]. However recent precise measurements [19, 20, 21] have indicated that the measured decay rate is much larger, i.e., 1670, 1600, and 1170 ppm respectively, than the theoretical QED prediction [9]. These respective discrepancies of 9.1, 8.0, and 5.2 experimental standard deviations are statistically significant, being referred to as the ‘o-Ps lifetime problem.’
1.2 Thermalization of o-Ps
We went on to perform further study [29] in which two independent precision measurements were carried out using two types of powder. Results correlated well, giving a combined value of
which is consistent with the QED prediction. This measurement employed a completely new method that took into account the thermalization process of o-Ps.
Since some fraction of o-Ps inevitably results in ‘pick-off’ annihilations due to collisions with atomic electrons of the target material, the observed o-Ps decay rate is the sum of the intrinsic o-Ps decay rate and the pick-off annihilation rate , i.e.,
| (1) |
where is proportional to the collision rate of o-Ps with the target materials; hence being proportional to the densities of the target materials and the velocity of o-Ps.
Immediately after formation, o-Ps has a kinetic energy of about 1 , thermalizing via elastic collisions with surrounding molecules to an ultimate thermal energy of about 0.03 . Due to the deceleration or thermalization process, must be described as a function of time dependent on the properties of the respective materials. was previously measured [19, 20, 21] by varying the densities of the target materials, with the extrapolation to zero densities expected to yield under the assumption of constant o-Ps velocity. Unfortunately, however, such extrapolation results in large systematic error due to an expected low thermalization rate, especially regarding the low density limit. Measurements in powder indicated this systematic problem [29, 30]; while in other experiments, o-Ps thermalization rates measured in gas were also substantially smaller than previously thought [31]. Another problem is that the assumption of linear dependence of on the densities of the target materials is not always valid, i.e., o-Ps collisions with materials could very well be more complex due to the occurrence of multiple scattering at material surfaces.
Therefore, our previous measurements adopted a formulation containing all information representing the thermalization process [29] ; hence completely removing systematic errors related to the thermalization process. From Eq. (1), the population of o-Ps, , can be expressed as
| (2) |
Note that the energy distribution of photons from the 3-body -decay is continuous below the steep edge at 511 , whereas the final state of the pick-off annihilation is 2-body; a behavior producing the 511- monochromatic peak. If the energy and timing information are simultaneously measured, can be determined from the energy spectrum of the emitted photon. Then, providing the ratio is determined as a function of time, the intrinsic o-Ps decay rate can be directly obtained by fitting the observed time spectrum with Eq. (2); an approach which precludes any ambiguity due to the thermalization process.
2 Experimental setup
2.1 Uncertainties in previous measurements
Although our 1995 results were consistent with QED predictions, the error was large in comparison with that of other experiments [19, 20, 21]. The time spectrum was obtained using CsI(Tl) scintillators which provided a relatively broad time response function () and long scintillation decay time. Accordingly, since some fraction of the prompt annihilation may have flown into the o-Ps decay region, uncertainties occurred in the time spectrum range immediately after the prompt events. This uncertainty led a restriction in the statistics such that we obtained a rather large error.
Here, although a new experimental setup/technique is used similar to the previous one, the above-mentioned problems are mitigated by employing NaI(Tl) versus CsI(Tl) scintillators.
2.2 Apparatus
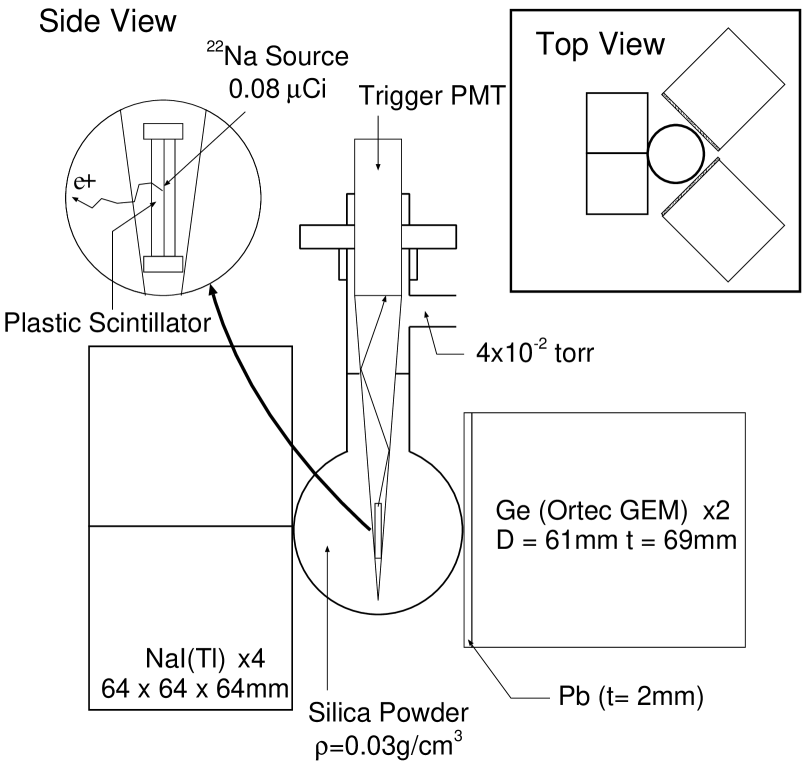
Figure 1 shows the experimental setup, where a very weak positron source () with 2- spot diameter is sandwiched between two sheet-type plastic scintillators (NE104) having a 12- diameter and 100- thickness. The source, held by a cone made of 25--thick aluminized myler, is situated at the center of a 48- diameter vacuum chamber made of 500--thick glass. The chamber, evacuated to torr, is filled with silica powder, AEROSIL 300CF(obtained from Nippon Aerosil Ltd.), having a grain size of 7- in diameter with density of 0.03 . Since the powder is hydrophile, they were heated for 4 hours at to remove the absorbed water molecule.
Most emitted positrons passing through the scintillators transmit a light pulse to a trigger photo-multiplier (PMT) (Hamamatsu H-3165-04) such that Ps is formed as the positrons are stopped in the silica powder. The photons subsequently emitted by the decay of o-Ps are measured using two types of detectors.
Two germanium semiconductor detectors (diameter, 61 ; thickness, 69 ; Ortec, GEM 38195) precisely determine as a function of time. The detectors are arranged perpendicular to each other (Fig. 1) to reduce the incidence of Compton scattered photons from the other detector. A 2.0--thick lead sheet located in front of the detectors eliminates the contribution of the two simultaneous low-energy photons produced by the -decay of o-Ps. Due to the detector’s excellent energy resolution, i.e. ,1.78 FWHM at 1274.6 , the resultant energy spectrum allows the monochromatic pick-off annihilation to be easily distinguished from the continuous -decay.
The four NaI(Tl) scintillators (crystal size, 64x64x64 ) simultaneously obtain time and energy information. Because they have much higher efficiencies compared to the Ge detectors, while also having good time response functions, the obtained time spectrum can be fit to Eq. (2).
2.3 Electronics
Trigger PMT output is fed to a discriminator which provides the start signal for both time-to-digital converters (TDCs) (Hoshin C006 and CAEN C414) and the reset signals for other electronics blocked (vetoed) during measurements. The TDCs are calibrated by a time-calibrator (Ortec 462) having an intrinsic time accuracy of 50 .
One output from the Ge detector preamplifier is fed into a fast-filter amplifier (FFA)(Ortec 579) whose output is divided into three signals by a linear fan-out module (LFF)(Lecroy 428F). One signal feeds a constant-fraction discriminator (CFD)(Ortec 473A) whose output is used as the stop signal for the TDC, while the other two feed a charge-sensitive analogue-to-digital converter (C-ADC) (Lecroy 2249SG). This enables measuring energy with a narrow gate width (1.25 ) and the base-line condition just prior to an event having a 200- ADC gate width. The differential and integral time of the fast-filter amplifier are optimized to obtain good time resolution of 6 rms. To measure a precise energy spectrum, the other output from the preamplifier is amplified by a spectroscopy amplifier (Ortec 673) such that shaped signals are fed into a peak-holding amplitude-to-digital converter (PH-ADC) (Hoshin C011) with 40- gate width.
The output from each of the four NaI(Tl) scintillators is divided by the LFF into four signals. One output is fed into a discriminator whose output with good time resolution of 1.2 rms provides the stop signal for the TDCs, while the other three outputs are fed to C-ADCs. One C-ADC with 3- gate width, called the wide ADC (Lecroy 2249W), measures the whole charge for the duration of the signal; one with 250- gate width, called the narrow ADC (Lecroy 2249SG), measures the charge itself; and one with 180- gate width, called the base ADC (Lecroy 2249SG) measures the base-line condition of the signal just prior to the event.
Accordingly, each Ge detector and NaI(Tl) scintillator provides three types of ADC information. Because pile-up events result in larger charge integration on the wide versus narrow ADC, their values are compared such that these events are effectively rejected. The base ADC is also used to reject pile-up events which can occur if the base-line condition is shifted due to any remaining tail of the previous signal. All ADCs use entirely independent gate input such that they are able to start charge integration using self timing, which results in the ADC gate width being narrower in accordance with signal duration.
Approximately the o-Ps events were collected for two month, and during the time a room temperature was maintained at to ensure stability of the amplifiers, ADCs, and TDCs.
The absolute strength of magnetic field around the Ps formation assembly was measured to be Gauss corresponding to a mixing between the o-Ps and the p-Ps by the ratio . Thus the observed o-Ps can be considered as a pure o-Ps sample.
3 Analysis
Use of the energy spectrum precisely measured by the Ge detectors enables determining . The energy spectrum of the photon originating from the pure o-Ps sample is obtained by subtracting the accidental contribution (time range, ) from the measured spectrum.


Figure 2 shows the resultant o-Ps spectrum, where the pick-off annihilation peak at 511 is clearly evident at the edge of the -decay continuous spectrum.
Using Monte Carlo simulation in which the setup geometry and various material distributions are reproduced in detail allowed us to calculate the expected -decay energy spectrum. That is, for every simulated event, three photons are generated according to an corrected energy spectrum, with successive photoelectric, incoherent, or coherent scattering interactions of every photon with materials being followed until all photon energy is deposited. The response function of the detector is determined based on the measured spectrum of monochromatic -rays emitted from ), ), and ), the lines of which are convoluted in the simulation.
As shown in Fig. 2, the o-Ps and spectra indicate good agreement below 508 . Although the simulation produced a detailed structure of the actual experimental setup, the shape of the spectrum is nearly independent of simulation details in that the sharp drop-off at 511 is solely due to the phase-space cutoff, being almost entirely determined by the energy response function of the Ge detectors. Figure 3 shows an enlarged view of the o-Ps spectrum after subtracting the spectrum, where the resultant spectrum peak and measured Ge detector response function fit well. Since the center of the fitted peak is located at , this indicates that subtraction of the contribution is properly performed. Hence, the peak is considered to represent a pure sample of pick-off annihilations, and the number of pick-off annihilations can be counted. The number of decays of o-Ps into ’s can accordingly be counted using the o-Ps spectrum such that is simply estimated from the counts ratio, where is multiplied by a normalization factor considering relative efficiencies of the Ge detectors and the corrected energy spectrum. Since is only dependent on the relative efficiencies of the Ge detectors vice absolute efficiencies, the resultant ratio is stable against various systematic errors.

ratios are respectively calculated in the same manner using various time windows, with Fig. 4 showing time dependencies of these values. Because the fractional energy loss of o-Ps per collision is dependent on its energy in powder, the time dependence of the average kinetic energy of o-Ps at time , , can be expressed by the following differential equation [32, 33]:
where , and are the mass of o-Ps, effective mass at the surface of the grain, and mean distance between the grains. Since the pick-off annihilation rate is proportional to the average velocity of o-Ps, can be expressed as
| (4) |
where , and are constants. With the exception that the summation term is replaced with abbreviated form in which is an arbitrary real number, Eq. (4) is used for fitting measured values. As indicated by the results in Fig. 4, o-Ps takes about 600 to become well thermalized in powder.

Figure 5 shows the time spectrum of NaI(Tl) scintillators using a photon energy window of , where the sharp peak from prompt annihilations is followed by exponential decay of o-Ps and the flat spectrum of accidental events. Due to using a weak positron source (), the o-Ps decay curve covers a wide region of about 1.2 , being about eight times as long as the o-Ps lifetime.
Using the least square method the time spectrum is fitted with
| (5) |
where is in Eq. (2), and and are respectively the probabilities that the photons emitted from the pick-off annihilation and -decay of o-Ps deposit energy of in the NaI(Tl) scintillators. Results of Monte Carlo simulation estimated to be , while is the measured stop rate of the NaI(Tl) scintillators.

Open squares in Fig. 6 show fitted values of the decay rate of o-Ps, , plotted as a function of fitting start time using a simple exponential function, i.e.,
| (6) |
Since observed contains the pick-off rate fraction, the intrinsic decay rate is obtained by correcting by a factor of . Closed circles in Fig. 6 show fitting results obtained using the proposed method, where the obtained values are stable against the fitting start time. Figure 6 shows the effect due to thermalization has been completely taken into account in our new method. The horizontal error-bars indicate statistical errors solely due to fitting the NaI(Tl) time spectrum, while the vertically extending bars represent propagated errors due to the fitting of . Due to the tail effect of prompt events, fitting is rapidly increasing before 120 , instead one can obtain stable values after 140 . Note the stable fitting values after 140 , where the fitting is 621.308 for (573-3) degrees of freedom; hence this time is used as the fitting start time. The resultant value is , which includes the statistical error in determining .
When systematic errors were estimated for various effects, the predominate contribution was found to be due the Monte Carlo simulation. That is, the contribution in the o-Ps spectrum is estimated by normalizing the Monte Carlo distribution with measured data from . In this measurement, we used the same Monte Carlo code adopted previously [29]. Equivalent systematic errors originating from the simulation are accordingly expected and estimated to be and . Other errors arise due to in-uniformity of powder (), fluctuations in relative efficiencies of Ge detectors dependent on the position of o-Ps formation (), and the position of o-Ps decay (). The remaining sources of error are due to hardware considerations: the absolute accuracy of the time calibration (), uncertainties in the relative efficiencies of the Ge detectors (), dependence on the base-line condition of NaI scintillators (), and relative efficiency of the NaI scintillators () (). Since these systematic errors are independent of each other, the total systematic error is their quadratic sum.

The result is . Total error is obtained by the quadratic sum of them, i.e., . Although the obtained precision is relatively lower compared to previous experiments, the results are essentially consistent as shown in Fig. 7 which indicates the history of o-Ps decay rate measurements. In addition, substantial improvement in the timing system is demonstrated.
4 Conclusions
The o-Ps decay rate was measured in powder using a modified method in which the effect of thermalization of o-Ps is accounted for by high energy-resolution Ge detectors. By combining obtained and our previous result [29] that assume systematic errors mainly stem from the same origins, we obtained . This is consistent with the corrected QED prediction of 7.039934(10)[9] within an error of 360 ppm, while varying from other recent measurements [19, 20, 21]. Realizing that this experiment represents dynamic development, further improvement in Ge timing response is expected soon; an innovation that should enable us to investigate the fast component preceeding a 140- start time such that the contribution in QED can be ultimately be confirmed at a level of just 200 .
Sincere gratitude is extended to Professor Toshio Hyodo and Dr. Yasuyuki Nagashima, University of Tokyo, for their insightful suggestions and valuable discussions concerning o-Ps thermalization.
References
- [1] G. S. Adkins, Ann. Phys. (NY) 146, 78 (1983).
- [2] G. S. Adkins, Phys. Rev. Lett. 76, 4903 (1996).
- [3] W. E. Caswell and G. P. Lepage, Phys. Rev. A 20, 36 (1979).
- [4] S. G. Karshenboim, JTEP 76, 541 (1993).
- [5] A. P. Burichenko, Phys. At. Nucl. 56, 640 (1993).
- [6] A. I. Milstein and I. B. Khriplovich, JTEP 79, 379 (1994).
- [7] P. Labelle, G. P. Lepage, and U. Magnea, Phys. Rev. Lett. 72, 2006 (1994).
- [8] R. N. Faustov, A. P. Martynenko, and V. A. Saleev, Phys. Rev. A 51, 4520 (1995).
- [9] G. S. Adkins, R. N. Fell, and J. Sapirstein, Phys. Rev. Lett. 84, 5086 (2000).
- [10] B. A. Kniehl and A. A. Penin, hep-ph/0004267, 2000.
- [11] K. Melnikov and A. Yelkhovsky, hep-ph/0008099, 2000.
- [12] G. L. Castro, J. Petieau, and C. Smith, hep-ph/0004209, 2000.
- [13] D. W. Gidley, A. Rich, P. W. Zitzewitz, and D. A. L. Paul, Phys. Rev. Lett. 40, 737 (1978).
- [14] D. W. Gidley and P. W. Zitzewitz, Phys. Lett. A 69, 97 (1978).
- [15] K. F. Canter et al., Phys. Lett. A 65, 301 (1978).
- [16] T. C. Griffith, G. R. Heyland, K. S. Lines, and T. R. Twomey, J. Phys. B 11, 743 (1978).
- [17] D. W. Gidley, A. Rich, E. Sweetman, and D. West, Phys. Rev. Lett. 49, 525 (1982).
- [18] P. Hashbach, G. Hilkert, E. Klempt, and G. Werth, Nuovo Cimento 97A, 419 (1987).
- [19] C. I. Westbrook, D. W. Gidley, R. S. Conti, and A. Rich, Phys. Rev. Lett. 58, 1328 (1987).
- [20] C. I. Westbrook, D. W. Gidley, R. S. Conti, and A. Rich, Phys. Rev. A40, 5489 (1989).
- [21] J. S. Nico, D. W. Gidley, A. Rich, and P. W. Zitzewitz, Phys. Rev. Lett. 65, 1344 (1990).
- [22] S. Asai, S. Orito, K. Yoshimura, and T. Haga, Phys. Rev. Lett. 66, 2440 (1991).
- [23] S. Orito, K. Yoshimura, T. Haga, M. Minowa, and M. Tsuchiaki, Phys. Rev. Lett. 63, 597 (1989).
- [24] S. Asai, K. Shigekuni, T. Sanuki, and S. Orito, Phys. Lett. B 323, 90 (1994).
- [25] M. Tsuchiaki, S. Orito, T. Yoshida, and M. Minowa, Phys. Lett. B 236, 81 (1990).
- [26] T. Mitsui, K. Maki, N. Muramoto, T. Sato, and S. Asai, Europhys. Lett. 33, 111 (1996).
- [27] T. Mitsui, R. Fujimoto, Y. Ishisaki, Y. Ueda, Y. Yamazaki, S. Asai, and S. Orito, Phys. Rev. Lett. 70, 2265 (1993).
- [28] S. Asai, S. Orito, T. Sanuki, M. Yasuda, and T. Yokoi, Phys. Rev. Lett. 66, 1298 (1991).
- [29] S. Asai, S. Orito, and N. Shinohara, Phys. Lett. B357, 475 (1995).
- [30] S. Asai, New Measurement of Orthopositronium Lifetime, Ph. D. thesis, 1994, University of Tokyo.
- [31] M. Skalsey, J. J. Engbrecht, R. K. Bithell, R. S. Vallery, and D. W. Gidley, Phys. Rev. Lett. 80, 3727 (1998).
- [32] Y. Nagashima, T. Hyodo, K. Fujiwara, and A. Ichimura, J. Phys. B 31, 329 (1998).
- [33] Y. Nagashima, M. Kakimoto, T. Hyodo, K. Fujiwara, A. Ichimura, T. Chang, J. Deng, T. Akahane, T. Chiba, K. Suzuki, B. T. A. McKee, and A. T. Stewart, Phys. Rev. A 52, 258 (1995).