Observation of the Askaryan Effect:
Coherent Microwave Cherenkov Emission
from Charge Asymmetry in High Energy Particle Cascades
Abstract
We present the first direct experimental evidence for the charge excess in high energy particle showers predicted nearly 40 years ago by Askaryan. We directed bremsstrahlung photons from picosecond pulses of 28.5 GeV electrons at the SLAC Final Focus Test Beam facility into a 3.5 ton silica sand target, producing electromagnetic showers several meters long. A series of antennas spanning 0.3 to 6 GHz were used to detect strong, sub-nanosecond radio frequency pulses produced whenever a shower was present. The measured electric field strengths are consistent with a completely coherent radiation process. The pulses show 100% linear polarization, consistent with the expectations of Cherenkov radiation. The field strength versus depth closely follows the expected particle number density profile of the cascade, consistent with emission from excess charge distributed along the shower. These measurements therefore provide strong support for experiments designed to detect high energy cosmic rays and neutrinos via coherent radio emission from their cascades.
pacs:
29.40.Ka, 41.60.Bq, 95.55.Vj, 98.70.SaI Introduction
During the development of a high-energy electromagnetic cascade in normal matter, photon and electron scattering processes pull electrons from the surrounding material into the shower. In addition, positrons in the shower annihilate in flight. The combination of these processes should lead to a net 20-30% negative charge excess for the comoving compact body of particles that carry most of the shower energy. G. A. Askaryan[1] first described this effect, and noted that it should lead to strong coherent radio and microwave Cherenkov emission for showers that propagate within a dielectric. The range of wavelengths over which coherence obtains depends on the form factor of the shower bunch—wavelengths shorter than the bunch length suffer from destructive interference and coherence is lost. However, in the fully coherent regime the radiated energy scales quadratically with the net charge of the particle bunch, and at ultra high energies the resulting coherent radio emission may carry off a significant fraction of the total energy in the cascade.
The plausibility of Askaryan’s arguments combined with more recent modeling and analysis[2, 3, 4, 5, 6] has led to a number of experimental searches for high energy neutrinos by exploiting the effect at energies from eV in Antarctic ice[7, 8] up to eV or more in the lunar regolith, using large ground-based radio telescopes[9, 10, 11, 12]. Radio frequency pulses have been observed for many years from extensive air showers[13, 14]. However, it has been shown[15, 16] that the most likely source of this emission is a form of Lorentz-boosted dipole radiation from geomagnetic charge separation in the air shower, rather than the Askaryan effect. Thus neither the charge asymmetry nor the resulting coherent Cherenkov radiation has ever been observed.
In a previous paper[17] we have described initial efforts to measure the coherent radio-frequency (RF) emission from electron bunches interacting in a solid dielectric target consisting of 360 kg of silica sand. That study, done with relatively low-energy electrons (15 MeV), demonstrated the presence of coherent radiation in the form of extremely short and intense microwave pulses detectable over a wide frequency range. These results, while useful for understanding the coherent RF emission processes from relativistic charged particles, could not directly test the development of a shower charge excess, as Askaryan predicted. Also, because the particles were charged, passage of the beam through any interface induced strong RF transition radiation (TR), which obscured the presence of Cherenkov radiation (CR).
We report here on measurements made at the Stanford Linear Accelerator Center (SLAC) in which the use of high-energy photons, rather than low-energy electrons, has enabled us to clearly observe microwave Cherenkov radiation from the Askaryan effect. The electromagnetic showers thus produced in our target yielded strong, coherent, sub-ns RF pulses, consistent in every way observed with the predictions. As we will show here, our results conclusively support the reported sensitivity of the experiments noted above.
II Experimental setup
A silica sand target and associated antennas were placed in a gamma-ray beamline in the Final Focus Test Beam facility at SLAC in August 2000. The apparatus was placed 30 m downstream of bremsstrahlung radiators that produced a high-energy photon beam from 28.5 GeV electrons. Just downstream of the bremsstrahlung targets, the electron beam was bent down, passed 0.5 m below our sand target within a vacuum pipe, and was dumped 15 m beyond the end of our target. Typical beam currents during the experiment were electrons per bunch. The two radiators could be used either separately or in tandem, thereby providing 0%, 1%, 2.7% or 3.7% of a radiation length. Thus the effective shower energy induced by the photons could be varied by a factor of , from eV per bunch. The size of the photon bunch at the entrance of the silica sand target was less than several mm in all dimensions.
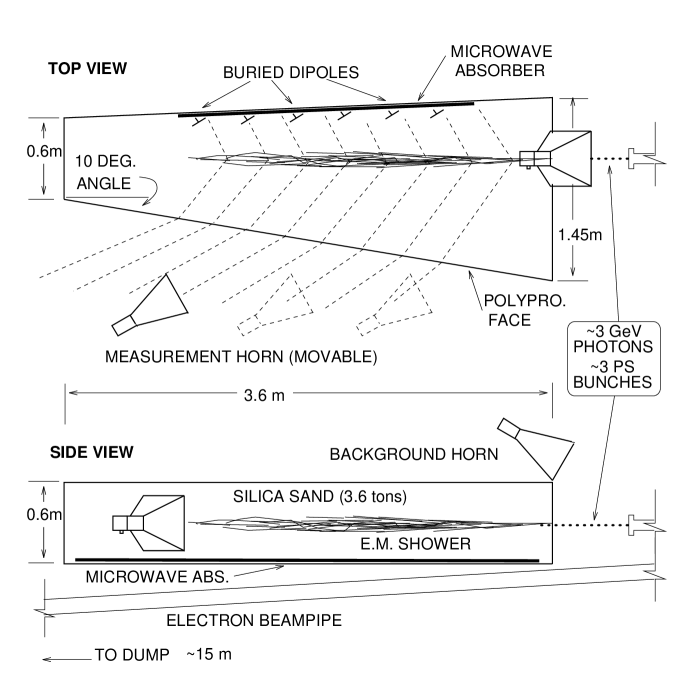
The target was a large container built largely from non-conductive materials such as wood and plastic which we filled with 3200 kg of dry silica sand. As shown in Fig. 1, the sand target was rectangular in cross section perpendicular to the beam axis, but the vertical faces on both sides were angled slightly to facilitate transmission of radiation arriving at the Cherenkov angle (about in silica sand at microwave frequencies). We avoided making sides parallel to the beam since the CR would then suffer total internal reflection at the interface. Both internal (buried) half-wave dipoles and external antennas were used for the pulse measurements. The external antennas were pyramidal “standard gain” microwave horns (1.7–2.6 GHz or 4.4–5.6 GHz). A low-microwave-loss plastic (0.5 inch thick polypropylene) was used for the face viewed by the external antennas.
Details of the trigger system, data acquisition, and polarization and power measurements were similar to those used in our previous experiment[17]. Briefly, time-domain sampling of the antenna voltages using high-bandwidth oscilloscopes allowed us to make direct measurements of the electric field of the pulses as a function of time, with time resolutions of 100 ps (0.2–3 GHz) and 10 ps (4–6 GHz). Because of the strength of the signals no amplification was required. Microwave absorber material was placed wherever possible to minimize reflections, and the geometry was chosen so that, where reflections could not be eliminated, they would arrive well after the expected main pulse envelope. The incident electron beam current was measured using a beam current transformer.
Because the accelerator itself uses S-band (2.9 GHz) RF for the beam generation, we took particular care to measure the background levels of RF with the electron beam on, but no photon radiators in place. We found a weak background RF pulse of about 20 ns duration, in coincidence with the beam, at the level of a few mV r.m.s. However, this background proved to be completely negligible compared to the signal pulses detected with the photon beam directed into the target, typically 10-100 V r.m.s. In addition, during most of the data runs, we used a second S-band horn to monitor any incoming radiation just upstream of the target (see fig. 1). These and numerous other tests eliminated the possibility that stray linac RF or other RF associated with the electron beam contributed to our measurements.
We checked the static magnetic field strength in the vicinity of our sand target and found it to be comparable to ambient geomagnetic levels, of order 0.5 Gauss. This is important since stray static fields present in the accelerator vault could have induced significant charge separation in showers within our target and lead to other possible radiation mechanisms. In a field of strength 0.5 Gauss, the electron gyroradius for the bulk of the shower is km, implying charge separations of cm over the length of a shower, well below the cm Molière radius.
III Results
As noted above, we observed strong RF pulses correlated in time to the presence of a shower at all of our observed radio frequencies. Having first eliminated the possibility that these were simply due to a background process, the problem of establishing and characterizing their origin remains. We report here on several measurements, each of which provides independent information in determining the source of the observed RF radiation. These are: the pulse properties in the time domain, the correlation of measured pulse field strengths to the expected shower profile, the polarization properties of the pulses, and the spectral and beam current dependence of the pulse field strengths.
A Time & shower profiles
The inset to fig. 2 shows a typical pulse profile measured with one of the S-band horns aimed near shower maximum. Given that the bandwidth of the horn is 900 MHz, the ns pulse width indicates a bandwidth-limited signal. This behavior is seen at all frequencies observed, with the best upper limit to the intrinsic pulse width, based on the 4.4–5.6 GHz data, being less than 500 ps.
Fig. 2 also shows a set of measured peak field strengths for pulses taken at different points along the shower. In this case the horn was translated parallel to the shower axis, maintaining the same angle (matched to the refracted Cherenkov angle) at each point. The values are plotted at a shower position corresponding to the center of the antenna beam pattern, refracted onto the shower. The half-power beamwidth of the horn is about ; thus the antenna would respond to any isotropic shower radiation over a range of cm around the plotted positions. For CR, the radiation pattern is expected to have a total beamwidth of several degrees or less[3, 18], much smaller than the antenna beam pattern.
The plotted curve shows the expected profile of the total number of particles in the shower, based on the Kamata-Nishimura-Greisen (KNG)[19] approximation. Here the field strengths have been scaled in the plot to provide an approximate overlay to the relative shower profile. Clearly the pulse strengths are highly correlated to the particle number profile. Since the excess charge is also expected to closely follow the shower profile, this result is consistent with Askaryan’s hypothesis.

Since CR propagates as a conical bow shock from the shower core, the pulse wavefront traverses any line parallel to the shower axis at the speed of the shower () rather than the local group velocity . Using our buried dipole array we have confirmed such behavior in the pulses we observed: the arrival times of the pulse at each dipole imply a radiative bow shock at , and are inconsistent with the measured group velocity () in sand.
Additional observations with an external S-band horn at the top interface of the sand show evidence for total internal reflection, via the dB attenuation of the pulse transmitted through the surface, which is approximately parallel to the shower axis. This latter behavior is characteristic of CR, since the Cherenkov angle is the complement of the angle of total internal reflection, and the radiation cannot propagate through a plane surface parallel to the charged particle trajectory.

B Polarization measurements
Pulse polarization was measured with an S-band horn at a single shower position, corresponding to a shower position of 0.5 m past the expected shower maximum. Field intensities were measured with the horn rotated at angles 0, 45, 90 and 135 degrees from horizontal. Fig. 3(a) shows the pulse profile for both the and (cross-polarized) orientations of the horn. Fig. 3(b) and 3(c) show the derived degree of linear polarization and the angle of the plane of polarization, respectively. In both respects the results are completely consistent with Cherenkov radiation from a source along the shower axis. Since the position was somewhat downstream of shower maximum, reflections from the upper surface of the sand also enter the pulse profile at later times; these are clearly evident in the time series and as a resulting loss of polarization beyond ns.
C Coherence & radio frequency dependence of field strength
In Fig. 4 we plot the measured dependence of the field strengths as a function of the total energy of the showers and the radio frequency band for different antennas. Fig. 4(a) shows a typical sequence of pulse field strengths, in this case for the external S-band horn, versus the total shower energy, which was varied both by changing the beam current and the thickness of the bremsstrahlung radiators. The dot-dash curve is a least-squares power-law fit to the data, of the form where is the electric field strength and is the total shower energy. The fit yields , consistent with complete coherence of the radiation, implying the characteristic quadratic rise in the corresponding pulse power with shower energy.
Fig. 4(b) shows the spectral dependence of the radiation, which is consistent with the linear rise with frequency that is also characteristic of Cherenkov radiation. Fig. 4(b) also plots a curve based on a semi-empirical parameterization [3, 21]. This parameterization is based in part on analytic methods which explicitly treat the distribution of the shower charge excess, and have been verified to yield the proper Frank-Tamm[22] results in limiting cases. This analysis is combined with simulations of radio emission for TeV showers in ice to determine the empirical parameters. Here we adapt these results from ice to silica sand, which has similar RF properties. The resulting field strength can be written in the form [3, 21]:
| (1) |
where is the distance to the source, is the radio frequency, and the decoherence frequency MHz for silica sand ( scales mainly by radiation length). The leading coefficient is , and (both are determined empirically)[21]. Here gives the shower energy as the product of the total number of electrons , the thickness of the radiator in radiation lengths, and the electron energy . The factor takes into account the difference in radiation lengths and density between ice and silica sand, which reduces the overall tracklength. Finally, accounts for the fact that the limited antenna apertures are only sensitive to of the total field strength. There is also additional uncertainty due to near-field effects, which we discuss further below. The uncertainties are estimates of the combined systematic and statistical uncertainty. Note that Fig. 4(b) compares absolute field strength measurements to the predictions and the agreement is very good.

IV Discussion
We have demonstrated that the radiation we have observed is coherent, and 100% linearly polarized. The plane of polarization coincides with the plane containing the antenna and shower axis. The radiation is pulsed with time durations much shorter than the inverse bandwidth of our antennas. The strength of the pulse is strongly correlated to the size (in particle number) of the shower region that appears to produce it. All of these observed characteristics are consistent with the hypothesis that what we have observed is coherent Cherenkov radiation. Because of the strong correlation with the shower profile, and the physical constraint that a shower with no net excess charge cannot radiate, we conclude that excess charge production along the shower is the source of the propagating charge in the silica dielectric which leads to the CR observed. These conclusions are strengthened by the fact that the pulse strength is consistent with Monte Carlo predictions for such showers.
Our observations are inconsistent with radiation from geomagnetic charge separation as observed in extensive air showers. The most striking evidence for this is the fact that the plane of polarization is clearly aligned with the shower axis rather than the local geomagnetic dip angle (). Given the approximate east-west orientation of the shower axis, boosted dipole radiation from geomagnetic charge separation should produce an electric field polarization with significant components orthogonal to what we have observed.
We note that in all cases our measurements are likely to be made in near-field conditions, and we have not attempted to correct for these effects. Recent studies[20, 21] have begun to treat these issues, but are not straightforward to apply in our case. In any case, near field effects should generally decrease the measured field strengths relative to far field measurements.
The total energy of our cascades is as high as eV, but these showers consist of the superposition of many lower-energy showers. Higher-energy effects[6, 23] that elongate the shower during its development are not present. These effects all tend to increase the total tracklength of the shower, at the expense of a lower instantaneous particle number density. The net effect is that the total radiated power is expected to be approximately conserved, but the angular spectrum can change significantly, with a predicted sharpening of the Cherenkov angular distribution for high energy showers. We have not measured the angular spectrum of the radio pulses, and thus any scaling of our results to high energy showers should consider corrections for these effects, which are likely to increase the peak field strength in far-field measurements.
Since the field strength scales linearly in shower energy and inversely with distance from the source, extrapolations to determine the energy threshold of existing experiments is straightforward, after correcting for the differences in material properties. For Antarctic ice experiments, the use of the existing simulations [3, 6, 7, 21] appears completely justified. For experiments observing the lunar regolith[9, 10, 11, 12], silica sand shares many similarities with the lunar surface material, and the expected cascade energy threshold, by direct scaling of our results, is eV, and may be somewhat lower depending on the angular intensity effects discussed above.
We conclude that, in combination with our previous measurements of coherent RF transition radiation [17], these results have established a firm experimental basis for radio-frequency detection of high energy cascades in solid media, either through interaction within a dielectric (for CR), or via passage through dielectric interfaces (for TR). Above cascade energies of eV, these secondary emission processes become dominant over others (for example, optical Cherenkov or fluorescence emission) in the number of quanta produced[2]. Thus experiments designed to exploit this effect in the detection of ultra-high energy particles can now be pursued with even greater confidence.
Acknowledgments
We thank D. Besson, R. Rose, L. Skjerve, and M. Spencer for the loan or construction of various antennas used in the experiment. We thank the members of the SLAC accelerator and EF departments for invaluable assistance before, during and after the run. This research was supported in part by by DOE contract DE-FG03-91ER40662 at UCLA and by the A. P. Sloan Foundation. It has been performed in part at the Jet Propulsion Laboratory, California Institute of Technology, under contract with the National Aeronautics and Space Administration. The Stanford Linear Accelerator Center is supported by the U.S. Department of Energy, with work performed under contract DE-AC03-76SF00515. Argonne support came from the U. S. Department of Energy, Division of High Energy Physics contract W-31-109-ENG-38.
REFERENCES
- [1] G. A. Askaryan, Zh. Eksp. Teor. Fiz. 41, 616 (1961) [Soviet Physics JETP 14, 441 (1962)]; G. A. Askaryan, Zh. Eksp. Teor. Fiz. 48, 988 (1965) [Soviet Physics JETP 21, 658 (1965)].
- [2] Markov, M. A., and Zheleznykh, I. M., Nucl. Instr. Meth. A248, 242, (1986).
- [3] E. Zas, F. Halzen, and T. Stanev, Phys. Rev. D 45, 362 (1992).
- [4] J. Alvarez–Muñiz and E. Zas Proc. 25th Intl. Conf. on Cosmic Rays, ed. M.S. Potgeiter et al. vol. 7, 309 (1996).
- [5] J. Alvarez–Muñiz and E. Zas, Phys. Lett. B, 411, 218 (1997).
- [6] J. Alvarez–Muñiz and E. Zas, Phys.Lett. B, 434, 396, (1998).
- [7] G. M. Frichter, J. P. Ralston, and D. W. McKay, Phys. Rev. D. 53, 1684 (1996).
- [8] D. Besson et al., Proc. 26th. Intl. Cosmic Ray Conf., v. 2, 467 (1999).
- [9] I. M. Zheleznykh, Proc. 13th Intl. Conf. on Neutrino Physics and Astrophysics (“Neutrino 88”), World Scientific, Boston, ed. J. Schreps, p. 528 (1988).
- [10] R. D. Dagkesamanskii, and I. M. Zheleznykh, Zh. Eksp. Teor. Fiz. 50 233 (1989) [JETP Lett., 50 259 (1989)].
- [11] T. H. Hankins, R. D. Ekers, and J. D. O’Sullivan, MNRAS 283, 1027 (1996).
- [12] P. W. Gorham, K. M. Liewer, and C. J. Naudet, Proc. 26th Intl. Cosmic Ray Conf., v 2, 479, (1999); also astro-ph/9906504.
- [13] J. V. Jelley, et al., Nuovo Cimento 46, 649, (1966).
- [14] D. Fegan and N. A. Porter, Nature 217, 440, (1968).
- [15] F. D. Kahn, and I. Lerche, Proc. Roy. Soc. A 289, 206 (1966).
- [16] H. R. Allan, in Prog. in Elem. Part. & Cosmic Ray Phys. 10, ed. J. G. Wilson & S. G. Wouthuysen (North-Holland: Amsterdam), 171, (1971).
- [17] P. W. Gorham, D. P. Saltzberg, P. Schoessow, et al. Phys. Rev. E, in press (2000), hep-ex/0004007.
- [18] T. Takahashi, T. Kanai, Y. Shibata, et al., Phys. Rev. E 50, 4041 (1994).
- [19] K. Kamata, & J. Nishimura, 1958, Suppl. Progr. Theoret. Phys. 6, 93; K. Greisen., 1965, in Prog. Cosmic Ray Physics vol. III, J.G. Wilson ed., (North Holland: Amsterdam) 1.
- [20] R. V. Buniy and J. P. Ralston, astro-ph/003408 (2000).
- [21] J. Alvarez–Muñiz, R.A. Vázquez, & E. Zas, Phys. Rev. D62 (2000), 063001, astro-ph/0003315.
- [22] I. E. Tamm, J. Phys. (Moscow) 1, 439, 1939.
- [23] J. Alvarez–Muñiz, R.A. Vázquez, & E. Zas, Phys.Rev. D61 (2000), 023001, astro-ph/9901278