Power correction analyses in annihilation
Abstract
The current status of theoretical work and experimental analyses on power corrections in QCD for annihilation will be reviewed. Measurements of the number of active quark flavours and the QCD colour factors and derived from QCD fits to event shape distributions at lower energies and LEP energies will be presented. The fits are based on +NLLA QCD predictions with power corrections to model hadronisation.
1 INTRODUCTION
QCD studies always have to consider how the observed final states consisting of hadrons, e.g. from the process hadrons, map on QCD predictions in terms of partons, the quarks and gluons. The transition from the partons of the hard process to the observed hadrons, commonly referred to as hadronisation, is a fundamental property of QCD.
However, there is no fundamental QCD based theory of the transition from partons to hadrons. The most successful description of the hadronisation process in annhilation has been achieved with Monte Carlo simulations based on a parton shower followed by formation of hadrons. Recently, analytic models of the hadronisation have become available which predict how hadronisation effects of QCD observables, e.g. event shapes, scale as a power of the energy scale of the hard process. These models are often referred to as power corrections.
In this report we will briefly review some of the analytic models and present comparisons with annihilation data. We will also show a more general test of the consistency of power corrections with the gauge structure of QCD.
2 PREDICTIONS
We summarise three related approaches to predict the power correction of event shape observables. In all cases the form of the dependence on the scale of the hard process is extracted from an analysis of infrared renormalon singularities. The differences between the approaches come from the regularisation of the infrared singularities in order to obtain meaningful predictions.
2.1 DMW Model
The model of Dokshitzer, Marchesini and Webber (DMW) [1, 2] makes the assumption that evolution of to energies below the Landau pole is possible but the form of is a priori unknown. A non-perturbative parameter is introduced as the 0th moment over :
| (1) |
The quantity is the infrared matching scale where the non-perturbative and perturbative evolution of are merged, usually GeV.
For some event shape observables the power corrections have been calculated up to two loops [3, 4]. The result is that hadronisation is described by a shift of the perturbative prediction inversely proportional to the hard scale :
| (2) |
The factor is universal [3] and includes two loop corrections in the quantity [5]. The factor contains all dependencies on the specific event shape observable in question. The prediction for the 1st moment from equation (2) is . We note that the DMW model predicts that does not depend on the observable. This property of universality can be tested experimentally.
2.2 Single dressed gluon approximation
A theoretical analysis of power corrections of the 1st and higher moments of the thrust distribution was presented in [6, 7]. A different approach compared to the DMW model is taken by adding a resummation based on the so-called single dressed gluon approximation (SDG) to the standard perturbative QCD predictions in . The SDG regularises the infrared renormalon singularities.
For the first moment of thrust a power correction proportional to is found, in agreement with the DMW model. The additional resummation leads to a substantial reduction in the relative magnitude of the power correction. It should be noted that power corrections calculated in this approach cannot be directly compared to the DMW model [5].
For the 2nd and 3rd moment of thrust the power corrections are predicted to be of the form . However, other terms of the form and are also predicted to exist but cannot be quantified.
2.3 Shape functions
This approach is based on factorisation of soft and hard processes in event shape distributions [8, 9]. The Ansatz is a convolution of the resummed perturbative QCD calculation (+NLLA) for the hard process with a so-called shape function for the non-pertubative or soft processes. A factorisation scale separates contributions from gluons with taken account of by from those with included in . For a cumulative event shape distribution at cms energy one has:
| (3) |
It is shown that the shape function resums all power corrections of the form and that it is related to the energy flow in the event.
The description of non-perturbative effects by a shift of the perturbative QCD prediction in the DMW model is reproduced as the special case where is a delta function. For the 2nd moments of thrust, heavy jet mass and C-parameter a prediction for the power correction of the form is given, consistent with section 2.2. Comparison of the predictions with distributions, 1st and 2nd moments of thrust, heavy jet mass and C-parameter from 35 GeV to 189 GeV shows reasonable agreement with the data.
3 STANDARD ANALYSES
All experimental analyses study power corrections in the DMW model. For moments the perturbative QCD prediction is while for distributions the power correction terms are combined with +NLLA calculations.
3.1 First and second moments
Studies of power corrections using the 1st moments of the event shape observables thrust, heavy jet mass, total and wide jet broadening and C-parameter have been performed by several collaborations. The LEP experiments ALEPH [10], DELPHI [11, 12] and L3 [13, 14] used data recorded at cms energies up to 205 GeV while the reanalysis of data from the PETRA experiment JADE covers in addition the range 35 GeV to 44 GeV [15, 16].
Figure 1 presents the DELPHI high energy data together with data from other experiments at . The fit of the perturbative QCD prediction combined with a power correction describes the data well.
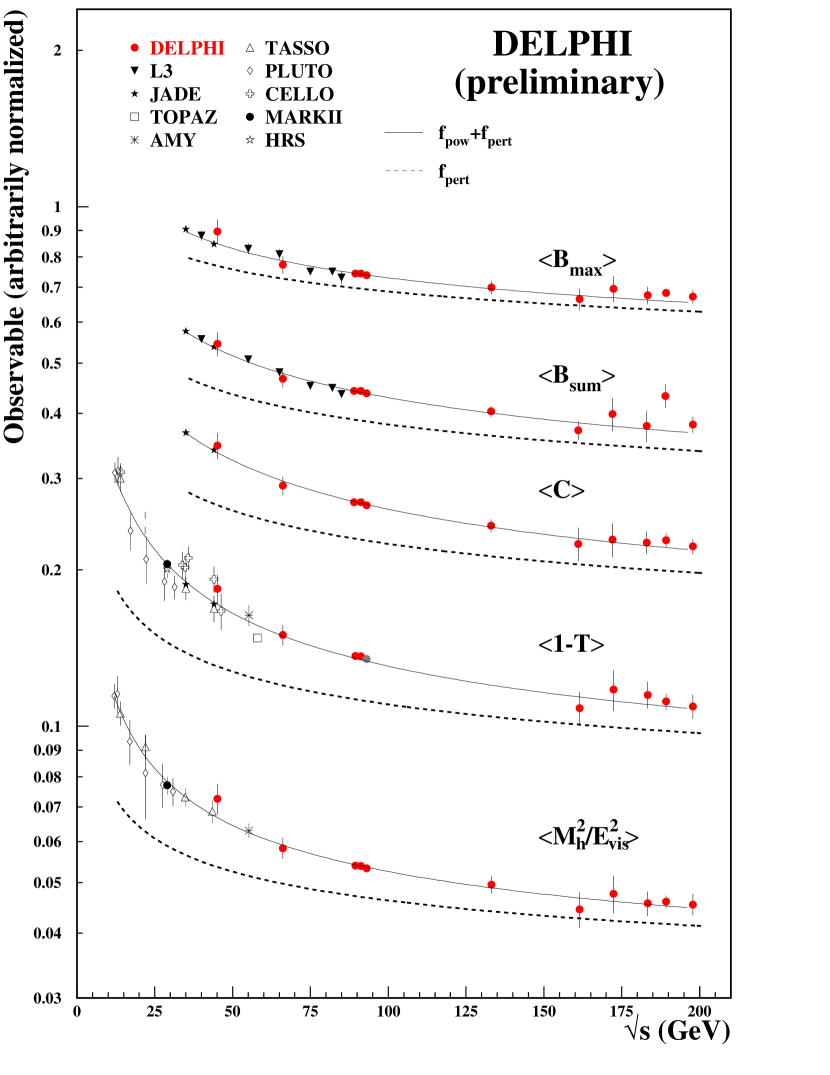
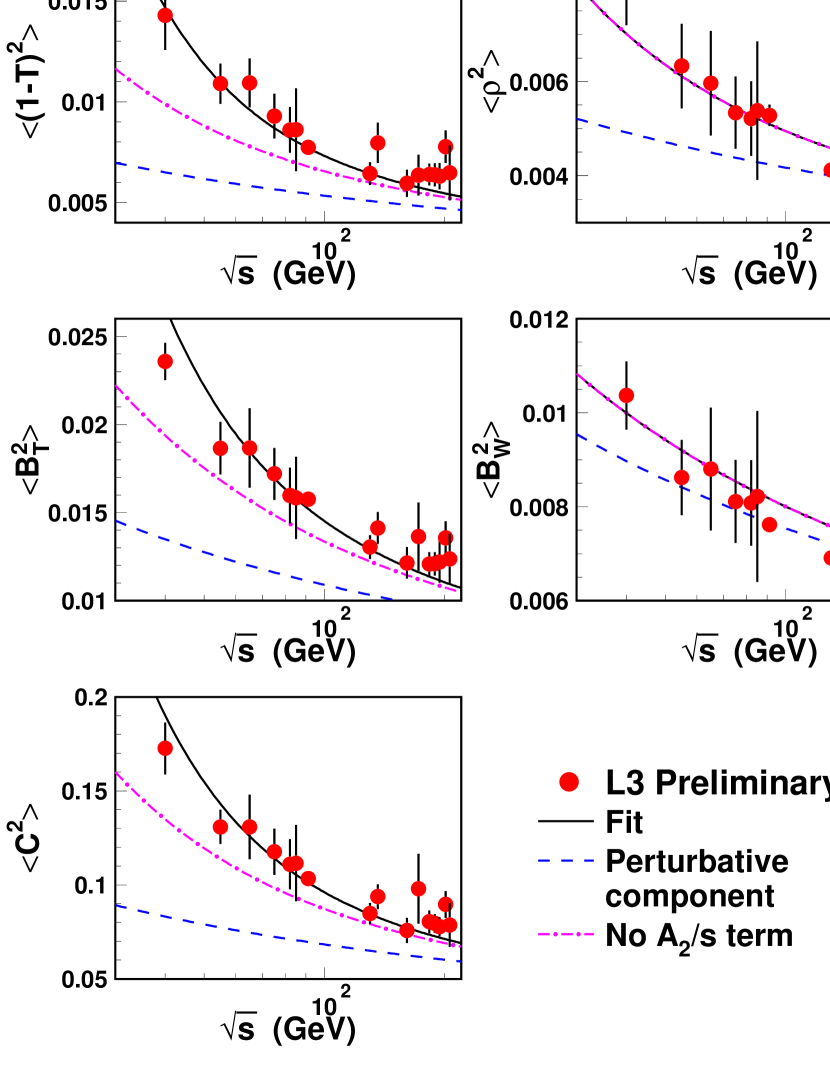
Figure 2 shows the results by L3 for 2nd moments from analyses of the LEP 2 high energy data as well as from low energy data obtained by selecting events at with hard initial or final state photon radiation. The fits of the energy evolution of the 2nd moments are based on a simple extension of the DMW model with . The quantity is fitted with and fixed to the results from fits to 1st moments and it is found to be consistent with zero only for heavy jet mass and the wide jet broadening.
3.2 Differential distributions
In the DMW model power corrections to differential event shape distributions are described by a shift of the perturbative prediction. This prediction has been tested with reanalysed JADE data together with data from SLD and the LEP experiments [17] and also with LEP data by ALEPH [10]. Figure 3 presents distributions of the C-parameter from GeV to 183 GeV with a fit of the DMW prediction [17]. The fitted prediction within the fit ranges indicated by solid lines describes the data well within the errors.

4 STUDY OF QCD COLOUR FACTORS
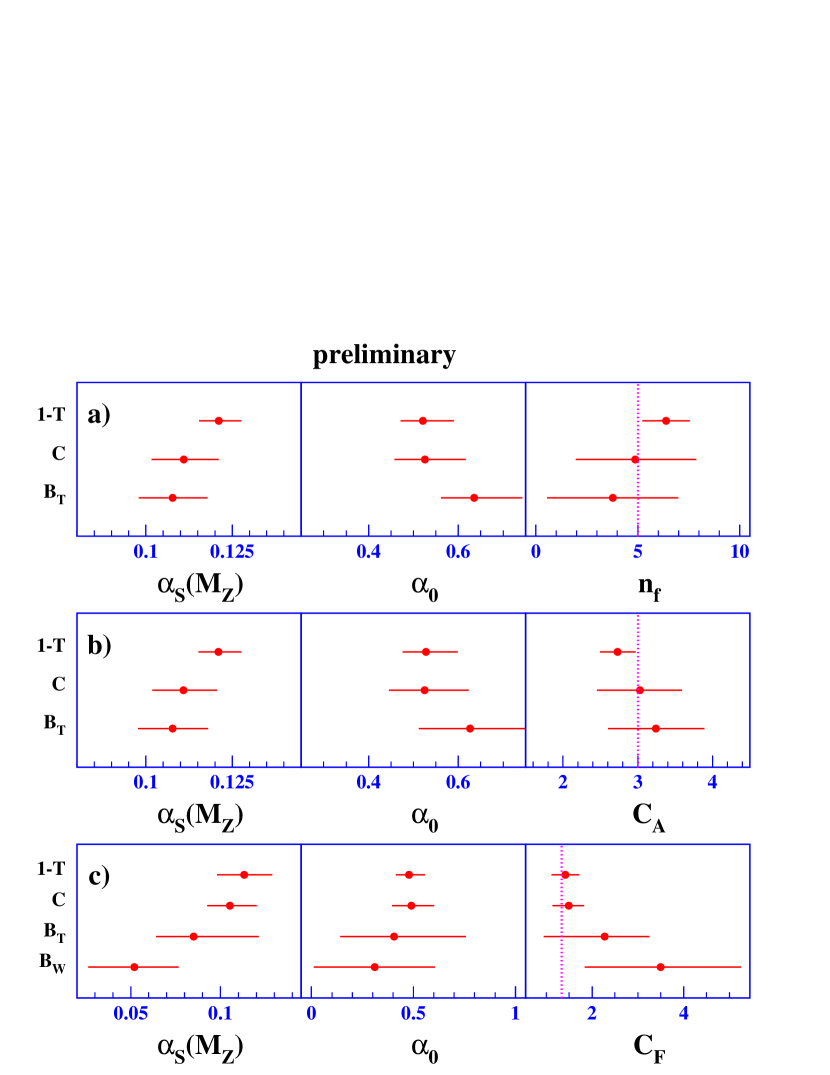
In this analysis fits of the DMW model to event shape distributions as shown in section 3.2 are generalised to vary one of the QCD colour factors , or along with and [18]. Sensitivity to the colour factors comes mainly from the running of in the perturbative prediction. Potential biases from assuming standard QCD in the hadronisation corrections should not be present. It is observed that fits to thrust and C-parameter are stable while fits to total and wide jet broadening don’t converge well in all cases. Results of the fits to individual colour factors, and are shown in figure 4 and are consistent with standard QCD based on the SU(3) symmetry group. The total uncertainties on the measurements of the colour factors are competitive with traditional analyses using 4-jet final states at .
5 SUMMARY
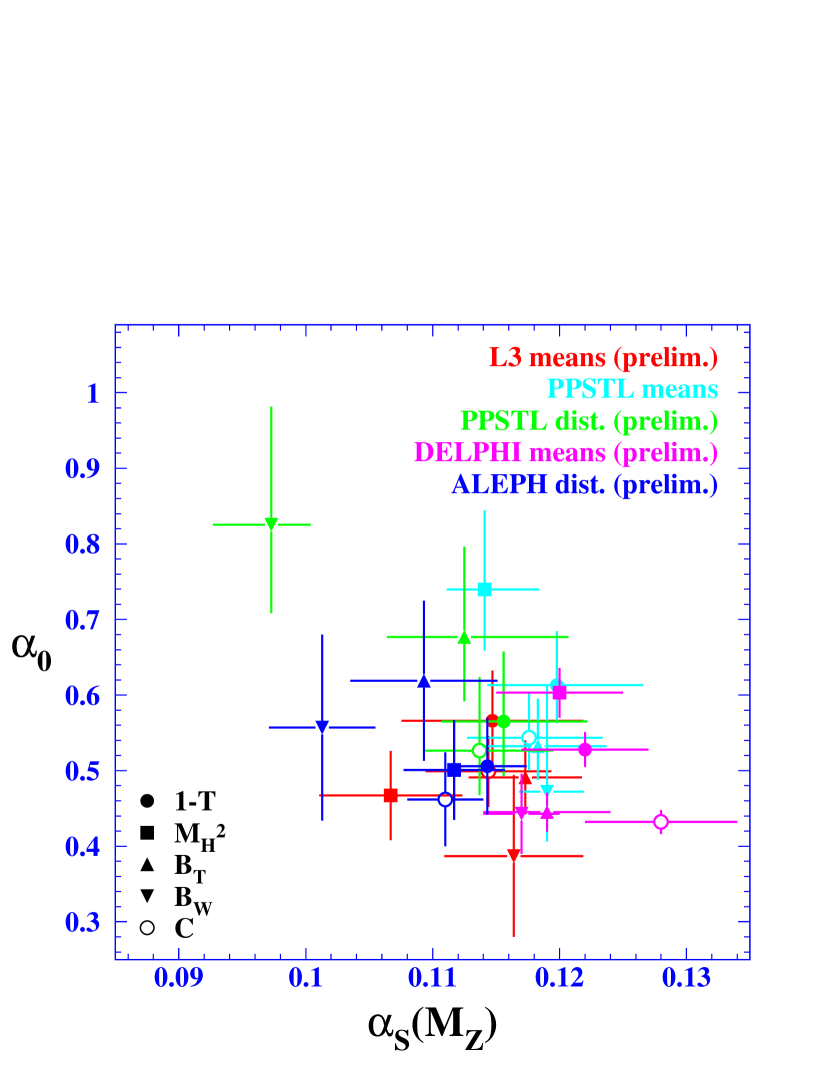
A summary of all results for and of analyses based on the DMW model is shown in figure 5. The label PPSTL refers to the analyses of data from PEP, PETRA, SLC, TRISTAN and LEP performed together with reanalysed JADE data [15, 16, 17]. The results for are consistent with the current world average [19] while the results for mostly cluster within . The results for support the prediction of universality within 25%.
The other power corrections models are promising new approaches and need experimental testing. From an experimental point of view it would also be desirable to quantify the relations between the different models.
The study of QCD colour factors within the DMW model yields results consistent with standard SU(3) QCD with thrust and C-parameter. The total uncertainties on the colour factors are competitive with other measurements of the colour factors.
The field of power corrections in annihilation is rapidly developing and it gives one the opportunity to learn more about soft QCD and the physics of hadronisation.
References
- [1] Y. Dokshitzer, G. Marchesini, B. Webber, Nucl. Phys. B 469 (1996) 93–142.
- [2] M. Beneke, V. M. Braun, Nucl. Phys. B 454 (1995) 253–290.
- [3] Y. L. Dokshitzer, A. Lucenti, G. Marchesini, G. P. Salam, JHEP 5 (1998) 3.
- [4] Y. L. Dokshitzer, G. Marchesini, G. P. Salam, Eur. Phys. J. direct C 3 (1999) 1–45.
- [5] Y. L. Dokshitzer, hep-ph/9911299, invited talk at 11th Rencontres de Blois: Frontiers of Matter, Chateau de Blois, France, 28 Jun - 3 Jul 1999 (1999).
- [6] E. Gardi, G. Grunberg, JHEP 11 (1999) 16.
- [7] E. Gardi, JHEP 4 (2000) 30.
- [8] G. P. Korchemsky, G. Sterman, Nucl. Phys. B 555 (1999) 335.
- [9] G. P. Korchemsky, S. Tafat, LPT-ORSAY-00-63 (2000).
- [10] D. Abbaneo, et al., ALEPH 2000-044, submitted to XXXth International Conference on High Energy Physics, July 27 - August 2, Osaka, Japan (2000).
- [11] P. Abreu, et al., Phys. Lett. B 456 (1999) 322–340.
- [12] P. Abreu, et al., DELPHI 2000-022 CONF 343, submitted to XXXVth Rencontres de Moriond, March 18 - March 25, Les Arcs, France (2000).
- [13] M. Acciarri, et al., CERN-EP/2000-064, sub. to Phys. Lett. B (2000).
- [14] M. Acciarri, et al., L3 note 2555, submitted to XXXth International Conference on High Energy Physics, July 27 - August 2, Osaka, Japan (2000).
- [15] P. A. M. Fernandez, O. Biebel, S. Bethke, S. Kluth, P. Pfeifenschneider, et al., Eur. Phys. J. C 1 (1998) 461–478.
- [16] O. Biebel, P. A. M. Fernandez, S. Bethke, et al., Phys. Lett. B 459 (1999) 326.
- [17] P. A. M. Fernandez, O. Biebel, S. Bethke, PITHA 99/21 (1999).
- [18] S. Kluth, MPI-PhE/2000-19 (2000).
- [19] S. Bethke, MPI-PhE/2000-07 (2000).
QUESTIONS
- M. Boutemeur, LMU Munich
-
Is it normal that your analysis [of the QCD colour factors] works for both 1-T and C because they are almost 100% correlated? Do you know any other event shape variable for which it works?
- Answer
-
It is consistent that the analysis works for and , because they are correlated. However, the observables and are also highly correlated with and but the fits are not always stable. This may indicate that the DMW model is not as good an approximation for and as for and . Other event shapes for which the analysis would be possible are heavy jet mass and energy-energy-correlation.
- Hasko Stenzel, MPI Munich
-
What are the indications of an insufficient perturbative description of the wide jet broadening [in the colour factor analysis]?
- Answer
-
The analysis of the colour factors used the latest corrected calculations for the jet broadening observables. It is not known if the perturbative or the power correction part of the prediction for is insufficient.