Measurements of and from CCFR -Fe and -Fe data in a physics model independent way
Abstract
We report on the extraction of the structure functions and from CCFR -Fe and -Fe differential cross sections. The extraction is performed in a physics model independent (PMI) way. This first measurement of , which is useful in testing models of heavy charm production, is higher than current theoretical predictions. The ratio of the (PMI) values measured in and scattering is in agreement (within 5%) with the predictions of Next-to-Leading-Order parton distribution functions (NLO PDFS) using massive charm production schemes, thus resolving the long-standing discrepancy between the two sets of data.
pacs:
PACS numbers:12.38.Qk, 13.15.+g, 24.85.+p, 25.30.Pt UR-1586, submitted to Phys. Rev. Lett.Deep inelastic lepton-nucleon scattering experiments have been used to determine the quark distributions in the nucleon. However, the quark distributions determined from muon [1] and neutrino [2] experiments were found to be different at small values of Bjorken , because of a disagreement in the extracted structure functions. In this Letter, we report on a measurement of differential cross sections and structure functions from CCFR -Fe and -Fe data. The neutrino-muon difference is resolved by extracting the structure functions in a physics model independent (PMI) way. We also report on the first measurement of = , which is used to test models of heavy charm production.
The sum of and differential cross sections for charged current interactions on an isoscalar target is related to the structure functions as follows:
| . (1) |
Here is the Fermi weak coupling constant, is the nucleon mass, is the incident neutrino energy, the scaling variable is the fractional energy transferred to the hadronic vertex, is the final state hadronic energy, and is the polarization of the virtual boson. The structure function is expressed in terms of by , where is the square of the four-momentum transfer to the nucleon, (the Bjorken scaling variable) is the fractional momentum carried by the struck quark, and is the ratio of the cross-sections of longitudinally- to transversely-polarized bosons.
A similar equation for the case of muon scattering relates the cross sections to the structure functions. However, there are significant differences originating from the scattering on strange () and charm () quarks. The term, which in leading order , is not present in the scattering case. In addition, in a charged current interaction involving (or ) quarks, there is a threshold suppression originating from the production of heavy quarks in the final state. For scattering, while there is no suppression for scattering from quarks, there is larger suppression when scattering from quarks since there are two heavy quarks ( and ) in the final state.
In previous analyses [2] of data, light flavor universal physics model dependent (PMD) structure functions were extracted by applying a slow rescaling correction to correct for the charm mass suppression in the final state. In addition, the term (used as input in the extraction) was calculated from a leading order charm production model. Recent calculations [3, 4, 5] indicate that there are large theoretical uncertainties in the charm production modeling for both and the slow rescaling corrections. Therefore, in the new analysis reported here, slow rescaling corrections are not applied, and and are extracted from two-parameter fits to the data. We compare the values of to various charm production models. The extracted physics model independent (PMI) values for are then compared with within the framework of NLO models for charm production.
The CCFR experiment collected data using the Fermilab Tevatron Quad-Triplet wide-band and beam. The CCFR detector [6] consists of a steel-scintillator target calorimeter instrumented with drift chambers, followed by a toroidally magnetized muon spectrometer. The hadron energy resolution is (GeV), and the muon momentum resolution is . By measuring the hadronic energy (), muon momentum (), and muon angle (), we construct three independent kinematic variables , , and . The relative flux at different energies, obtained from the events with low hadron energy ( GeV), is normalized so that the neutrino total cross section equals the world average cm2/GeV and [2]. After fiducial and kinematic cuts ( GeV, , GeV, and 30 GeV 360 GeV), the data sample consists of 1,030,000 and 179,000 events. Dimuon events are removed because of the ambiguous identification of the leading muon for high- events.
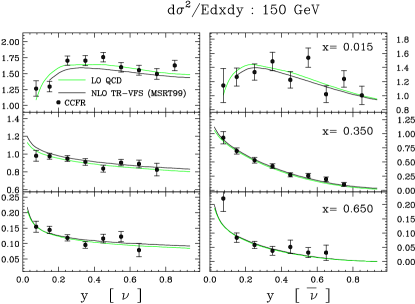
The raw differential cross sections per nucleon on iron are determined in bins of , , and (, , and GeV). Figure 1 shows typical differential cross sections at GeV (complete tables are available [7]). For all energies, the cross sections are in good agreement with NLO PDFs (with massive charm production schemes e.g., MRST99 [8] or CTEQ4HQ [9]). The dashed lines shows the predictions from the Thorne and Roberts Variable Flavor Scheme (TR-VFS) [4] QCD calculation using MRST99 extended [10] PDFs. This calculation includes an improved treatment of massive charm production. The QCD predictions, which are on free neutrons and protons, are corrected for nuclear [2], higher twist [11, 12], and radiative effects [13]. Also shown are the predictions from a CCFR leading order (LO) QCD inspired fit used for calculation of acceptance and resolution smearing corrections. As expected from QCD, the CCFR cross section data exhibit a quadratic dependence at small for and , and a flat distribution at high for .
Next, the raw cross sections are corrected for electroweak radiative effects [13], the boson propagator, and for the 5.67% non-isoscalar excess of neutrons over protons in iron (only important at high ). Values of and are extracted from the sums of the corrected -Fe and -Fe differential cross sections according to Eq. (1). However, it is challenging to fit , , and using the distribution at a given and because of the strong correlation between the and terms, unless the full range of is covered by the data. Covering this range (especially the high region) is difficult because of the low acceptance. Therefore, we restrict the analysis to two-parameter fits.
Our strategy is to fit and (or equivalently ) for where the contribution is relatively large, while constraining using the [14] QCD-inspired empirical fit to all available electron and muon scattering data. The fit is also in good agreement with NMC data [1] at low , and with the most recent theoretical prediction [12] for (a NNLO QCD calculation including target mass effects). For , in neutrino scattering is expected to be somewhat larger than for muon scattering because of the production of massive charm quarks in the final state. A correction for this difference is applied to using a leading order slow rescaling model to obtain an effective for neutrino scattering, . The difference between and is used as a systematic error. Because of the positive correlation between and , the extracted values of are rather insensitive to the input . In contrast, the extracted values of are sensitive to the assumed value of , which is reflected in a larger systematic error. The values of are sensitive to the energy dependence of the neutrino flux ( dependence), but are insensitive to the absolute normalization. The uncertainty on the flux shape is estimated by using the constraint that and should be flat over (or ) for each and bin.


Because of the limited statistics, we use large bins in in the extraction of with bin centering corrections applied using the NLO TR-VFS calculation [4] with the MRST99 PDFs. Figure 2 (left) shows the extracted values of as a function of , including both statistical and systematic errors, compared to various theoretical methods for modeling heavy charm production within a QCD framework. The three-flavor Fixed Flavor Scheme (FFS) [15] assumes that there is no intrinsic charm in the nucleon, and that all scattering from quarks occurs via the gluon-fusion diagram. The concept behind the Variable Flavor Scheme (VFS) proposed by ACOT [5, 16] is that at low scale, , one uses the three-flavor FFS scheme, while above some scale, an intrinsic charm sea (which is evolved from zero) is introduced. The concept of the TR-VFS scheme [4] is similar, except that at intermediate scale it interpolates smoothly between the two regions. Both the FFS and VFS schemes have been implemented by KLS [3], ACOT, and Kretzer [17]. The last two implementations agree with each other, but not with KLS (there was a mistake in the KLS calculation) [18].
Shown are the predictions from the TR-VFS scheme (implemented with MRST99 PDFs and the suggested scale ) and along with the predictions from two other other NLO calculations, ACOT-VFS (implemented with CTEQ4HQ PDFs and their recent suggested scale for , and for with [5]), and the FFS (implemented with the GRV94 [19] PDFs and their recommended scale ). Also shown are the predictions from the leading order QCD fit to the CCFR dimuon [20] data.
Figure 2 (right) shows the sensitivity to the choice of scale. For example, the data do not favor the choice of scale, in the ACOT-VFS calculation with CTEQ4HQ PDFs. This high scale (originally suggested by ACOT and used in the CCFR dimuon analysis [20]) implies that the calculation is in the four-flavor region even at and GeV2 (and yields large negative result). With reasonable choices of scale, all the theoretical models yield similar results. However, at low , our data is higher than all of the theoretical models. The difference between data and theory may be due to an underestimate of the strange sea at low , or from missing NNLO terms. The question of the strange sea would be addresed by a global NLO analysis which combines the neutrino data for dimuons, and , with .
As discussed above, values of for are extracted from two-parameter fits to the distributions. In the region, the contribution from is small and the extracted values of are insensitive to . Therefore, we extract values of with an input value of and with constrained to the TR-VFS (MRST99) predictions. Fig. 3 shows the ratio of our (PMI) measurements divided by (NMC [1] or BCDMS [21]) or (SLAC [22]) measurements [23]. The overall normalization errors of 2% (CCFR), and 2.5% (NMC) are not shown. Within 5%, the ratio is in agreement with the predictions of the TR-VFS (MRST99), ACOT-VFS (CTEQ4HQ), and FFS (GRV94) calculations [24].
In the calculation of the theoretical predictions, we have also included corrections for nuclear effects [2]. As mentioned earlier, the extracted values of from the two-parameter fits are insensitive to . For example, if we perform simultaneous two-parameter fits to and (while keeping fixed to the TR-VFS (MRST99) values), the extracted values at are smaller than , but changes by only .
In the previous analysis [2] of the CCFR data, the ratio of extracted values of (PMD) data divided by (NMC) at the lowest and bin were higher than the predictions of the light-flavor PDFs such as MRSR2 [25] or CTEQ4M [9] (see Fig. 4 ). About of the difference originates from having used a leading order model for versus using our new measurement. Another originates from having used the leading order slow rescaling corrections, instead of using NLO massive charm production models. The remaining 3% originates from improved modeling of the low PDFs (which changes the radiative corrections and the overall absolute normalization to the total neutrino cross sections). For higher at , and for the next two bins ( and ), the smaller difference between the PMI and PMD results is due to equal contributions from the and the difference in the slow rescaling corrections. For the higher bins (), the contribution of is small, and the slow rescaling corrections in the leading order model are the same as those with the NLO theories. Therefore, the NMC and CCFR data are in agreement at large whether PMI or PMD structure functions are used in the comparison.

In conclusion, the ratio of (PMI) values measured in neutrino-iron and muon-deuterium scattering are in agreement with the predictions of Next-to-Leading-Order PDFs (using massive charm production schemes), thus resolving the long-standing discrepancy between the two sets of data. The first measurement of is higher than current theoretical predictions.
REFERENCES
- [1] M. Arneodo et al., Nucl. Phys. B483, 3 (1997).
- [2] W. G. Seligman et al., Phys. Rev. Lett. 79, 1213 (1997).
- [3] G. Kramer, B. Lampe, and H. Spiesberger, Z. Phys. C72, 99 (1996).
- [4] R. S. Thorne and R .G. Roberts, Phys. Lett. B421, 303 (1998); RAL-TR-2000-048 (2000).
- [5] M. Aivazis, J. Collins, F. Olness, and W. K. Tung, Phys. Rev. D50, 3102 (1994).
- [6] W. K. Sakumoto et al., Nucl. Instr. Meth. A294, 179 (1991); B. King et al., ibid A302, 254 (1991).
- [7] http://www-e815.fnal.gov/ukyang/; U. K. Yang, Ph.D. Thesis, University of Rochester (UR-1583, 2000).
- [8] A. D. Martin et al., Eur. Phys. J. C14, 133 (2000).
- [9] H. L. Lai et al., Z. Phys. C74, 463 (1997).
- [10] For GeV2, the MRST PDFs are extended according to the dependence of GRV94 PDFs.
- [11] U. K. Yang and A. Bodek, Phys. Rev. Lett. 82, 2467 (1999).
- [12] U. K. Yang and A. Bodek, Eur. Phys, J. C13, 241 (2000).
- [13] D. Yu. Bardin and V. A. Dokuchaeva, JINR-E2-86-260 (1986).
- [14] L. W. Whitlow et al., Phys. Lett. B250, 193 (1990).
- [15] E. Laenen et al., Nucl. Phys. B392, 162 (1993).
- [16] M. Aivazis, F. Olness, and W. K. Tung, Phys. Rev. Lett. 65, 2339 (1990).
- [17] S. Kretzer and I. Schienbein, Phys. Rev. D58, 094035 (1998).
- [18] F. Olness and S. Kretzer, Private communication.
- [19] M. Gluck et al., Z. Phys. C67, 433 (1995).
- [20] A. Bazarko et al., Z. Phys. C65, 189 (1995).
- [21] A. C. Benvenuti et al., Phys. Lett. B237, 592 (1990).
- [22] L. W. Whitlow et al., Phys. Lett. B 282, 475 (1992).
- [23] An empirical fit [1] to the SLAC, BCDMS, NMC data is used for bin-center correction to these data.
- [24] Correction for the difference between -Fe and -Fe nuclear effects would make the agreement better (ref: C. Boros et al., Phys. Lett. B468, 161, (1999)). Also, the predictions would increase by 5% at , if a strange sea which describes the data is used.
- [25] A. D. Martin et al., Phys. Lett. B 387, 419 (1996).