Improved Measurement of the Positive Muon Anomalous Magnetic Moment†
Abstract
A new measurement of the positive muon’s anomalous magnetic moment has been made at the Brookhaven Alternating Gradient Synchrotron using the direct injection of polarized muons into the superferric storage ring. The angular frequency difference between the angular spin precession frequency and the angular orbital frequency is measured as well as the free proton NMR frequency . These determine = = 3.707 201(19) . With = 3.183 345 39(10) this gives = 11 659 191(59) ( ppm), in good agreement with the previous CERN and BNL measurements for and , and with the standard model prediction.
pacs 14.60.Ef
In this brief note we present a new measurement of the anomalous -value of the positive muon from the Brookhaven Alternating Gradient Synchrotron (AGS) experiment E821. We previously reported a result based on data collected during 1997.[1] In that work, as in the CERN measurements,[2, 3] pions were injected into the storage ring, and approximately 25 parts per million (ppm) of the daughter muons from pion decay were stored. In August 1998 a fast muon kicker was commissioned, which permitted the direct injection of muons into the storage ring.
Except for the use of muon injection, many of the experimental aspects are the same as described in reference[1]. However, important improvements were implemented. These included better stability and homogeneity of the storage ring magnetic field, improved stability of the positron detection system, and extended capacity of the data acquisition system. For the 1998 run, the AGS contained six proton bunches, each with a maximum intensity of about , with one bunch extracted every 33 ms. The 3.1 GeV/c positive muon beam was formed from decays of a secondary pion beam which was 1.7% higher in momentum, thus providing a muon polarization of about 95%. The pion decay channel consists of a 72 m long straight section of the secondary beamline. The muons were selected at a momentum slit, where the (higher energy) pions were directed into a beam dump. The beam composition entering the storage ring was measured with a threshold Cerenkov counter filled with isobutane. By stepping the pressure from zero to 1.2 atm, the threshold for Cerenkov light from , then and finally was crossed. The beam was found to consist of equal parts of positrons, muons and pions, consistent with Monte Carlo predictions. While this measurement was not sensitive to the proton content of the beam, calculations predict it to be approximately one third of the pion flux. The flux incident on the storage ring was typically for each proton bunch.
The 10 mrad kick needed to put the muon beam onto a stable orbit was achieved with a peak current of 4100 A and a half period of 400 ns. Three pulse-forming networks powered three identical 1.7 m long one-loop kicker sections consisting of 95 mm high parallel plates on either side of the beam. The current pulse was formed by an under-damped LCR circuit. The kicker plate geometry and composition were chosen to minimize eddy currents. The residual eddy current effect on the total field seen by the muons was less than 0.1 ppm 20 s after injection. The time-varying magnetic field from the eddy currents was calculated with the program OPERA[4] and was measured in a full-size straight prototype vacuum chamber with the use of the Faraday effect.[5] Since the muons circulate in 149 ns, they were kicked several times before the kicker pulse died out.
About muons were stored in the ring per proton bunch. With muon injection, the number of detected positrons per hour was increased by an order of magnitude over the pion-injection method employed previously. Furthermore, the injection related background (flash) in the positron detectors was reduced by a factor of about 50, since most of the pions were removed from the beam before entering the storage ring.
For polarized muons moving in a uniform magnetic field perpendicular to the muon spin direction and to the plane of the orbit and with an electric quadrupole field , which is used for vertical focusing[2, 6], the angular frequency difference, , between the spin precession frequency and the cyclotron frequency , is given by
| (1) |
The dependence of on the electric field is eliminated by storing muons with the “magic” =29.3, which corresponds to a muon momentum = 3.09 GeV/. Hence measurements of and of determine . At the magic gamma, the muon lifetime is s and the precession period is 4.37 s. With a field of 1.45 T in our storage ring,[7] the central orbit radius is 7.11 m.
The magnetic field in Eq. 1 is the average over the muon distribution. We obtained the equilibrium radius distribution by determining the distribution of rotation frequencies in the ring from the time spectra of decay positrons.[1] The distribution, reproduced with a tracking code, was found to be 3 mm toward the outside of the central storage region. This offset was caused by the mode of operating the kicker. The calculated and measured radial distributions are shown in Fig. 1.
The magnetic field seen by the muon distribution was calculated by tracking a sample of muons in software through the field map measured by NMR, and by averaging the field values. The resulting average corresponds within 0.02 ppm to the field value taken at the beam center and averaged over azimuth. We used the latter to account for variations with time, and to obtain the present result.
Positrons from the in-flight decay were detected with 24 Pb-scintillating fiber calorimeters[8] placed symmetrically around the inside of the storage ring. Twenty-one of these detectors were used in the present analysis. The observed positron time spectrum shown in Fig. 2 was adequately represented by[2, 3]
| (2) |
The normalization constant depends on the energy threshold, , placed upon the positrons. The (integral) asymmetry depends on and on the beam polarization. The fractional statistical error on is proportional to , where is the number of decay positrons detected above threshold. For an energy threshold of 1.8 GeV where is maximum, was found to be 0.34 on average.
As in Ref. [1], the photomultiplier tubes were gated off before injection. With the reduced flash associated with muon injection, it was possible to begin counting as soon as 5 s after injection in the region of the ring 270∘ around from the injection point, and 35 s in the injection region. Data from the detectors gated on at 5 s were used in the rotation frequency analysis mentioned above. The fit to Eq. 2 was begun after scraping[1] was completed and when the photomultiplier outputs from the 21 detectors used in this analysis were stable, 25-40 s after injection. Time histograms were formed for each detector. These data were analyzed separately and the resulting values for were in good agreement ( = 17.2/20).
Values for and , the free proton NMR angular frequency in the storage-ring magnetic field, were determined separately and independently. Thereafter the frequency ratio was determined. A correction of ppm was added to to account for the effects[3] of the electric field and the muon vertical betatron oscillations on . We obtain , where the 5 ppm error includes a 1 ppm systematic error discussed below.
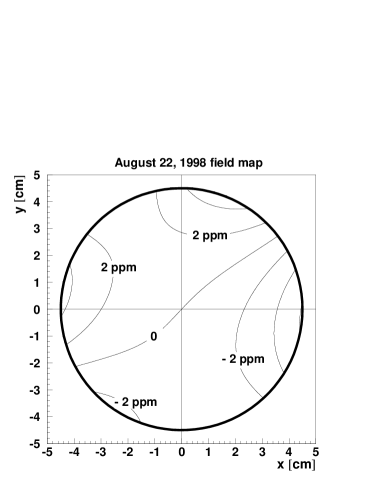
Since the 1997 run, a substantial reduction in the overall systematic error has been achieved. As regards , the stability of the magnetic field has been improved by thermal insulation of the magnet and by NMR feedback control to the main magnet power supply. The field homogeneity has been improved by additional shimming with iron shims near the intersections of pole pieces, and the surface coils around the ring on the pole faces have been used to compensate on average for the higher multipoles in the magnet. Additional shimming was also done using the iron wedges placed in the air gap separating the high quality low carbon pole piece steel from the yoke steel. This shimming produced a field which, when averaged over the azimuth, was uniform to within 4 ppm, as is shown in Fig. 3. The knowledge of the muon distribution in the ring obtained as indicated above allows us to determine the average field seen by the muons. The uncertainty in is ppm.
The other systematic errors are associated with the determination of from the positron data. These arise principally from pile-up, and from AGS “flashlets”. A pile-up error occurs when two pulses overlap within the time resolution of about 5 ns and are incorrectly identified as one, which then gives incorrect times and energies for the positrons. Pile-up is estimated to produce an effect on of less than 0.6 ppm, which we conservatively take as an error estimate. Occasionally under unstable conditions, the AGS was observed to extract beam during our data collection period of 600 s which caused a background in our calorimeters (“flashlets”). We conservatively estimate that this effect on in the 1998 data sample is less than 0.5 ppm. Smaller errors arise from the details of the fitting procedure, rate dependent timing shifts, gain changes in the photomultipliers, uncertainties about the radial electric field and the vertical betatron motion, and from muon losses.
Altogether, the systematic errors on and added in quadrature are less than 1 ppm.
The anomalous magnetic moment is obtained from the frequency ratio by
| (3) |
in which [9, 10]. This new result is in good agreement with the mean of the CERN measurements for and [3, 9], and our previous measurement of [1]. Assuming CPT symmetry, the weighted mean of the four measurements gives a new world average of
| (4) |
().
The theoretical value of in the standard model has its dominant contribution from quantum electrodynamics but the strong and weak interactions contribute as well. The standard model value is ( ppm), where the error is dominated by the uncertainty in the lowest order hadronic vacuum polarization.[11]
In Fig. 4 the four precise measurements of and their average are shown, along with the standard model prediction. The weighted mean of the experimental results agrees with the standard model, with
| (5) |
or equivalently ppm. This agreement of theory and experiment further constrains new physics beyond the standard model.[12, 13]
Data collected in early 1999 should give a statistical error of about 1 ppm, with a systematic error below 1 ppm. There is substantial activity at the colliders of Novosibirsk[14] and Beijing,[15] to measure , and these new data will further improve our knowledge of the hadronic contribution and thereby the standard model value of .
We thank T.B.W. Kirk, D.I. Lowenstein, P. Pile and the staff of the BNL AGS for the strong support they have given this experiment. We also thank C. Coulsey, G. De Santi and J. Sinacore, for their contributions to the preparation and running of the experiment. This work was supported in part by the U.S. Department of Energy, the U.S. National Science Foundation, the German Bundesminister für Bildung und Forschung, The Russian Ministry of Science and the US-Japan Agreement in High Energy Physics. A. Steinmetz acknowledges support by the Alexander von Humboldt Foundation.
REFERENCES
- [1] R.M. Carey et al., Collaboration, Phys. Rev. Lett. 82, 1632 (1999).
- [2] J. Bailey et al., Nucl. Phys. B 150, 1 (1979).
- [3] F.J.M. Farley and E. Picasso in Quantum Electrodynamics, ed. T. Kinoshita, (World Scientific, Singapore, 1990), p. 479.
- [4] Vector Fields Limited, 24 Bankside, Kidlington, Oxford OX5 1JE, England.
- [5] Muon note #286 The Muon Kicker: Design and Status, E. Efstathiadis et al., (1997) and E. Efstathiadis et al., “ The Muon Muon Kicker”, to be submitted to Nucl. Instrum. Methods.
- [6] Y.K. Semertzidis, et al. “The Brookhaven Muon g-2 Storage Ring High Voltage Quadruples”, to be submitted to Nucl. Inst. and Methods.
- [7] G.D. Danby, et al., Nucl. Instrum. Methods in press (2000).
- [8] S. Sedykh, et al., Nucl. Instrum. Methods, in press (2000).
- [9] Particle Data Group, Eur. Phys. J. C 3, 1 (1998).
- [10] W. Liu, et al., Phys. Rev. Lett. 82, 711 (1999).
- [11] V.W. Hughes and T. Kinoshita, Rev. Mod. Phys. 71, S133 (1999).
- [12] T. Kinoshita and W.J. Marciano in Quantum Electrodynamics (Directions in High Energy Physics, Vol. 7), ed. T. Kinoshita, (World Scientific, Singapore, 1990), p. 419.
- [13] A. Czarnecki and W. Marciano, Nucl. Phys. B (Proc. Suppl.) 76, 245 (1999), and references therein.
- [14] R.R. Akhmetshin et al., (CMD2 Collaboration), Phys. Lett. B 475, 190 (2000) and references therein.
- [15] Zhengguo Zhao, (arXiv:hep-ex/0002025 v2) Proceedings for Lepton-Photon 99 to be published and J.Z. Bai, et al., (BES Collaboration), Phys. Rev. Lett. 84, 594 (2000).