Observation of Anomalous Dimuon Events in the NuTeV Decay
Detector
(Preliminary)
Abstract
A search for long-lived neutral particles () which decay into at least one muon has been performed using an instrumented decay channel at the E815 (NuTeV) experiment at Fermilab. The decay channel was composed of helium bags interspersed with drift chambers, and was used in conjunction with the NuTeV neutrino detector to search for decays. The data were examined for particles decaying into the muonic final states , , and . Three events were observed over an expected background of events; no events were observed in the other modes. Although the observed events share some characteristics with neutrino interactions, the observed rate is a factor of 75 greater than expected. No Standard Model process appears to be consistent with this observation.
.
I INTRODUCTION
In various extensions to the Standard Model, new particles exist which have reduced couplings to normal quarks and leptons. These new particles may have zero electric charge, long lifetimes, and small interaction rates with normal matter. We shall refer to these as particles in the following text. Examples of such particles include neutral heavy leptons (NHLs) or heavy sterile neutrinos [1, 2, 3] and neutral supersymmetric particles [4] such as neutralinos and sneutrinos. The particles can be produced either by pair production in hadronic interactions or via weak decays of mesons through mixing with standard neutrinos. The decays of the to normal hadrons and/or leptons can proceed through weak decays with mixing, or via -parity violating supersymmetric processes.
High energy neutrino beamlines are ideal places to produce particles, since very large numbers of protons interact in these beamlines. ’s may be produced via a number of mechanisms, including primary interactions of the protons either in the target or the beam dump, through prompt decays of charmed or bottom mesons, by decays of pions or kaons in the decay region, or in
neutrino interactions in the shielding downstream of the decay region. A particle detector placed downstream of this sort of beamline (i.e., in the neutrino beam itself) can be used to search for decays.
We report here the results of a search using Fermilab’s E815 (NuTeV) detector for particles in the mass region above 2.2 GeV/ which decay into final states with at least one muon and one other charged particle. For the search described here, the NuTeV neutrino beamline was used in conjunction with a low mass decay detector called the decay channel.
NuTeV has previously reported results of searches for ’s in the mass region between 0.3 to 3.0 GeV/ with at least one final state muon [5], and in the mass region below 0.3 GeV/ for decays to electrons [6]. The 0.3 to 3.0 GeV/ study addressed NHLs that could be produced in the decay of K and D mesons, whose hadronic production rate is known [7]. This mass region also has low background from deep inelastic neutrino events in the decay channel. The low mass ( GeV/) study was pursued mainly to address the KARMEN timing anomaly [8], which has been interpreted as a particle with a mass equal to 33.9 MeV/.
The search for events with masses above 2.2 GeV/ (which we shall refer to as “the high mass region”) is different from the previous searches in two respects. First,
the backgrounds from neutrino interactions are much higher in the high mass range. Reducing this potential background source required tighter selection criteria than the ones used in the previous analyses. Second, the production mechanisms are quite different from those for lower mass NHLs. NHLs with masses above 1.8 GeV/ arise either from decays of B mesons or from neutrino interactions in the neutrino beam shielding (“berm”) upstream of the detector [9]. The B meson production cross-section at 800 GeV/c is much smaller and less well known than that for the lighter mesons, and this partially motivated separating the high mass search from the previous ones. Recently, though, new data from Fermilab E771 have indicated a larger B production cross-section, making a search for NHLs from this source feasible [10].
II THE BEAMLINE AND DETECTOR
During the 1997 fixed-target run at Fermilab, NuTeV received 800 GeV/c protons with the detector configured for this search. The proton beam was incident on a one-interaction-length beryllium oxide target at a targeting angle of 7.8 mr with respect to the detector. A sign-selected quadrupole train (SSQT) [11] focused either positive (for protons) or negative (for protons) secondary and mesons into a 440 m evacuated decay region pointed towards the NuTeV decay channel and neutrino detector hall. Surviving neutrinos (and possibly also ’s) traversed 850 meters of earth-berm shielding before reaching the NuTeV decay channel.
The decay channel region (Figure 1), located 1.4 km downstream of the production target, was designed to contain minimal material (in order to suppress neutrino interactions) and to have tracking sufficient to isolate two-track decays of neutral particles. A 4.6 m 4.6 m double array of plastic scintillation counters vetoed charged particles entering from upstream of the decay channel. If two counters in a back-front coincidence fired, the event was vetoed. Timing resolution for the veto system was 3.8 ns. A NuTeV testbeam chamber was positioned immediately downstream of the veto wall and offset from the center of the decay channel; this chamber was not used in this analysis. The channel itself measured 34 m in length and was interspersed with 3 m 3 m argon-ethane drift chambers positioned at 14.5 m, 24 m, and 34 m downstream of the veto array in stations of 1, 1, and 4 chambers, respectively. From upstream to downstream, the chambers were labeled DK5 through DK1, followed by TG43 at the front face of the neutrino detector. Chambers DK5 through DK2 and TG43 had a single sense wire per cell (“single-wire” chambers), resulting in a left-right ambiguity in the hit position. This ambiguity was reduced in tracking by making use of the fact that the positions of the single-wire chambers were staggered in and . Chamber DK1 was of a “three-wire” (two sense wires and one field-shaping wire per cell) design, which helped resolve any remaining tracking ambiguities. DK1 was also rotated by 47.7 mr about the beam axis, allowing tracks in the view to be matched with those in the view. The regions between the drift chamber stations were occupied by helium-filled cylindrical plastic bags 4.6 m in diameter.
In the offline analysis, tracks were reconstructed from drift chamber hits and grouped together to form vertices. The tracking algorithm took into account multiple Coulomb scattering, using a full error matrix for the fit. Sets of tracks were grouped as candidates for a vertex if their distance of closest approach was less than 12.7 cm. The vertex position was then determined using a constrained fit. Typically, a vertex from a of mass 5 GeV/ would be reconstructed with a resolution of 0.13 cm in the transverse direction and 7.4 cm longitudinally.
The Lab E neutrino detector [12, 13], located immediately downstream of the decay channel, provided final state particle energy measurement and identification. This detector consisted of a 690 ton iron-scintillator target calorimeter followed by a toroidal muon spectrometer. Three-wire argon-ethane drift chambers were positioned every 20 cm along the length of the calorimeter, and 84 2.5 cm-thick liquid scintillator counters were interleaved with the steel plates at 10 cm intervals throughout the its length. The spectrometer had a 15 kG toroidal magnetic field with drift chambers interspersed throughout the toroid magnets to provide tracking for the muons.
Sets of hits in the calorimeter drift chambers were linked to tracks found within the decay channel to determine the particle identification for each track. By analyzing the distribution of hits in the calorimeter as either single, long tracks (consistent with a muon), as a compact cluster of hits (consistent with an electron shower), or as an elongated cluster of hits (consistent with a pion shower), the particle type was determined. All charged hadrons were reconstructed as pions; “” samples referred to below are understood to include any or final states as well. The NuTeV calibration beam provided electrons, pions, and muons to the Lab E detector;
| Generated | Reconstruction mode probability | ||
|---|---|---|---|
| Decay Mode | |||
these were used to tune the particle identification algorithm. Misidentification rates for decays were determined using the GEANT-based Monte Carlo (MC) [14] described in Section V; these rates are listed in Table I.
In the case of electrons and pions, pulse height information from the counters was used to determine particle energy deposition. The hadronic energy resolution of the calorimeter was ; the electromagnetic energy resolution, [13]. If two or more pion- or electron-clusters were present, the energy determined from the pulse heights was divided according to the number of drift chamber hits in each cluster.
Muon energy determination depended on the topology of the track. If the muon track extended into the toroid, the spectrometer measurement was used (resolution of 11%). If the muon stopped in the calorimeter steel, the momentum was determined by range (resolution of 310 MeV). The energy of muons which exited through the side of the calorimeter was determined from the track’s multiple scattering in the steel. For a 50 GeV/ muon, the resolution for this method is 42%.
III PHILOSOPHY OF THIS ANALYSIS
In analyses such as this, there is a real concern that events may be eliminated or isolated through an unintentional bias of the people involved in the analysis. The solution adopted by many collaborations is that of a “closed box” analysis, in which there is no direct access to the signal region until the end of the analysis. This procedure was a philosophical goal of this search. However, before this analysis, during the early development of the reconstruction software for the decay channel, one candidate decay channel event with two muon tracks was observed. This event was studied in detail and ascertained to have a mass greater than 2.2 GeV/c2.
Because of the observation of this event, the NuTeV collaboration went to considerable effort to minimize bias. Investigations of data events with high mass were stopped until the MC background studies (described below) were completed to establish the cuts and requirements. In most cases, cuts set prior to the observation were used. In those cases where new cuts were introduced, demonstration of a strong MC-based motivation was required. New members who had not seen the event joined the analysis group. Finally, an important aspect of the analysis included setting up orthogonal analysis regions and comparing Monte Carlo prediction to the result. Each of the two previously-published analyses was motivated by its own physics goals, but they also represent tests in regions complementary to this analysis.
As part of the analysis philosophy, once the analysis region was selected based on the Monte Carlo criteria, the collaboration agreed to show any events which were observed. However, the interpretation of the events might change after the analysis region was examined, upon further investigation.
IV EVENT SELECTION
Event selection criteria were developed to minimize known backgrounds while maintaining efficiency for a possible signal.
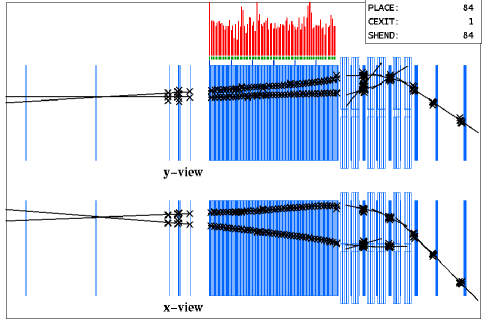
As an example of what might be observed in the decay channel, Figure 2 shows a Monte Carlo simulated event of a 5 GeV/ on the NuTeV event display. The beam enters the decay channel from the left of the figure. The decay channel chambers (DK5 through TG43) appear sequentially from left to right. The vertex of the simulated decay is immediately downstream of DK4. Hits in chambers are indicated by crosses; two hits per track are shown in each chamber because of the left-right ambiguity in the single-wire chambers. The muons can be seen to penetrate the calorimeter steel and then bend in the toroidal magnetic field at the far right. Pulse height information from the counters is shown by the histogram above the calorimeter region.
| Event conditions | No veto, physics trigger, protons in the spill, run period |
|---|---|
| Cut cosmic ray tracks | slope radians |
| 3-D track reconstruction | and views linked for each track |
| Track & vertex reconstruction | Track pseudo-/dof |
| Vertex pseudo-/dof | |
| Require two-track vertex | Only two tracks connected to upstream vertex |
| only one particle downstream. | |
| Good particle ID | Track is within calorimeter acceptance |
| Cluster associated with track | |
| Energy GeV, and energies GeV | |
| Cut punch-through | GeV |
| Isolate fiducial volume | vertex within cm |
| vertex 101.6 cm away from chambers | |
| or 3 times vertex error (whichever is larger). | |
| Isolate mass region | GeV |
In decays with a neutral particle in the final state, it is not possible to reconstruct the invariant mass of the . Instead, one must use the “transverse mass,” , where is the component of the total reconstructed momentum perpendicular to the beam direction, and is the invariant mass of the visible particles. In the case of perfect resolution, the transverse mass of the event is always lower than the mass. When there is no final state neutrino, and hence no missing , this expression reduces to the invariant mass.
The main sources of conventional events in the decay channel are: 1) deep-inelastic scattering (DIS) of neutrinos or anti-neutrinos in the drift chamber material; 2) DIS in the helium; and 3) DIS in the material surrounding the decay channel with a misreconstructed vertex in the fiducial volume. The DIS event rate rises with , and represents the dominant background for the high mass analysis.
Other sources of background are small compared to DIS. Neutral kaons produced in surrounding material may enter the channel and decay in the fiducial volume. These will appear to have high transverse mass if the kaon enters with a large angle. Diffractive , , , and charm production from neutrino interactions may occur in either the chambers or the helium. Another interaction which can occur in either chambers or helium is low multiplicity neutrino-induced resonance production, characterized by a high-energy forward muon accompanied by a low-energy pion track. A number of other possible background sources have been found to be negligible because they very rarely produce reconstructed vertices in the
decay channel. These include cosmic ray showers, conversions of photons produced in surrounding material, interactions from muons scattered from surrounding material, “leakage” of charged particles from the adjacent testbeam line (which occurred only during specific data collection periods), an out-of-time neutrino interaction overlaid on an in-time interaction, and two coincident in-time interactions in the decay channel. These background sources were constrained by data as well as investigated through Monte Carlo.
The goal of this stage of the analysis was to create a set of cuts which reduced the number of events expected from conventional sources to well below one event. Most of these cuts were originally developed for the 0.3 to 3.0 GeV/ search. The cuts used to isolate decays fell into two broad categories: reconstruction and “clean” cuts.
Reconstruction cuts isolated events with exactly two tracks forming a vertex within the decay channel fiducial volume and having no charged particle identified in the upstream veto system. A summary of these cuts appears in Table II. Both tracks were required to be well-reconstructed. A “pseudo-” (degrees of freedom) was used***“Pseudo” means that Gaussian errors on hit positions were assumed. to measure track reconstruction quality. Tracks were required to have an associated calorimeter cluster, with at least one of the tracks identified as a muon. Cuts were also applied on vertex quality (pseudo-, which corresponds to a 95% acceptance probability) and transverse position within the detector fiducial volume cm, cm). In order to remove events which might be due to interactions in the chambers, events were cut where the longitudinal () distance from the vertex position to any drift chamber was less than either 101.6 cm or three times the vertex error. Events were allowed to have a second vertex downstream of the first to allow for the possibility of events with -rays. Cosmic ray tracks, which generally have large angles with respect to the beam direction, were removed by requiring the slope of each track to be less than 100 mr. To ensure accurate particle identification and energy measurement, muons, hadrons, and electrons were required to have an energy greater than 2.2 GeV, 10 GeV, and 10 GeV, respectively. This latter cut also eliminated low-energy pions associated with neutrino-induced resonance production. An additional total energy cut of 12 GeV was applied to events to remove background from decays with a subsequent decay of the pion. In order to isolate high mass events, a cut of GeV/ was applied.
“Clean event” cuts were applied to reduce the deep-inelastic neutrino scattering backgrounds. These cuts, specific to this analysis, were motivated by the observation that DIS events typically have large track multiplicities with many drift chamber hits and extra, unassociated clusters in the calorimeter. A summary of the characteristics associated with DIS events which pass the reconstruction cuts is given in Table III. The “clean” cuts included the following requirements: 1) three or fewer tracks in any one view, 2) three or fewer drift chamber hits in any view of the first chamber downstream of the vertex, 3) at least one view ( or ) with fewer than eight drift chamber hits total in the first two chambers downstream of the vertex, 4) no energy clusters in the calorimeter not associated with tracks, and 5) no tracks identified as electrons with missing hits in either view of the first two chambers downstream of the vertex. Requirements 1-3 remove events with high multiplicities; requirement 4 removes events where a neutral particle deposits energy in the calorimeter; and requirement 5
| Extra tracks | 3 tracks in either view |
|---|---|
| Exiting tracks | 1 extra hit in either view in the chamber just downstream of vertex |
| or 7 hits in each view in the first 2 chambers downstream of the vertex. | |
| Neutral particles | 1 cluster(s) in calorimeter without associated track. |
| Photon conversion | Electron PID with no hits in chamber immediately downstream of vertex. |
was used to reduce events with photon conversions in the downstream chambers which could be misidentified as electrons.
V BACKGROUND ESTIMATION USING MONTE CARLO
Detailed Monte Carlo simulations of both physics processes and detector effects were used to quantify the background from neutrino interactions after cuts. Input to the simulation was provided from several event generators. The LEPTO/Jetset Monte Carlo program was used to simulate DIS events [15]. This simulation used CCFR parton distributions [16], included the correct A-dependence [17], and generated DIS events from GeV2 and GeV. Resonance and continuum production, simulated using the calculations of Belusevic and Rein [18], allowed us to extend the Monte Carlo into the low- region. Diffractive production was calculated using Vector Meson Dominance (VMD) and Partially-Conserved Axial Current (PCAC) models normalized to a previous measurement with the NuTeV calorimeter data [19].
The event generators fed a GEANT-based [14] detector simulation that produced hit-level simulations of raw data. Cell-by-cell inefficiencies and dead regions due to internal chamber supports were included. To simulate noise and accidental activity in the detector, decay channel hits taken from in-time downstream calorimeter neutrino events were overlaid on the GEANT events. Monte Carlo events were processed using the same analysis routines used for the data.
Background calculations were normalized to the data using charged-current DIS interactions in the chambers. Events in this sample were required to pass the following five “normalization cuts”: a vertex within the transverse fiducial volume ( cm, cm); a vertex within 76.2 cm of a drift chamber; no coincidences within ns of the trigger in the upstream veto system; 1 GeV energy deposit in the front of the calorimeter; and one toroid-analyzed muon matched to a decay channel track. The Monte Carlo was normalized to match

the total number of data events with two or more tracks. Figure 3 shows a comparison of the data and MC distributions for this sample. The preliminary error on this normalization is . Two alternate normalizations were used as checks. The first normalized to protons on target using the decay channel mass distribution and (anti-)neutrino cross-sections. The second normalized to charged-current interactions in the calorimeter, and scaled by the decay-channel-to-calorimeter mass ratio. These cross-checks had uncertainties of 16 and 12 respectively, and were in agreement with the primary normalization.
Monte Carlo events were compared to data as a check on the quality of the simulation. In such a comparison, the challenge is to isolate events of sufficiently similar topology to verify the Monte Carlo calculation of the background and at the same time maintain high statistics in the data sample. We used two methods to achieve high statistics comparison samples of events with two or more tracks.
For the first sample, the vertex was required to be within the decay channel fiducial volume, with cm, cm, allowing the position to be either in the chambers or the helium. Tight track angle cuts were imposed to remove cosmic rays, and a strict requirement on veto system activity was used to remove upstream interactions. Other cuts on reconstruction, particle identification, and vertex fit quality were removed.

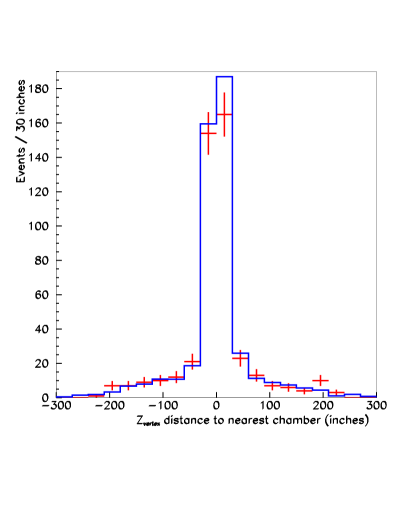

The majority of these events were from interactions in the chamber material or from interactions in the laboratory floor. In the data, from 502 events, 169 events had vertices reconstructed in the helium, defined as cm for the nearest drift chamber. This can be compared to Monte Carlo, which predicted events with events reconstructed in the helium. Comparisons of data to Monte Carlo vertex distributions are shown in Figures 4, 5, and 6.
The second sample was comprised of Monte Carlo events passing the five normalization cuts. Figure 7 shows a comparison of some event variables for this sample. There is good, qualitative agreement between the data and MC in these and additional distributions. For events with a vertex more than 101.6 cm from the chambers (helium events) the Monte Carlo predicts 28 events; 40 data events are observed.
| Source | events |
|---|---|
| DIS events | (3.9 0.9) 10-2 |
| Diffractive charm | (1.1 0.1) 10-3 |
| Diffractive | (1.7 0.1) 10-4 |
| Diffractive | (3.3 0.3) 10-7 |
| K decays from berm | (3.9 3.9) 10-4 |
| Other sources | 2.5 10-4 |
| Total Background | (4.0 0.9) 10-2 |

After all cuts, the preliminary expected background is 0.040 0.009 events in mode, 0.14 0.02 events in mode and 0.13 0.02 events in mode. As an example of the relative sizes of the contributions discussed above, the background sources for the mode are broken down in Table IV.
VI CROSS-CHECKS USING DATA
Before looking at the data in the signal region, we performed a series of analyses on other fiducial and kinematic ranges which gave us confidence in our Monte Carlo predictions. We point out that the two previous published analyses in the 0.3 to 3.0 GeV/ and low mass region were examinations of other such kinematic regimes. Extra studies performed for this analysis included using 1) identical analysis cuts applied to events within 15.2 cm of a chamber (the chamber region); 2) the chamber region with loosened cuts to increase acceptance; 3) the “intermediate region” between 15.2 and 101.6 cm from the chambers, with otherwise standard analysis cuts; and 4) events with well-reconstructed two-track vertices where the tracks were both identified as pions. The results were within 1.5 of prediction in the above cases.
| Decay Mode | Predicted Events | Observed Events |
|---|---|---|
| (chamber) | 1.6 | 0 |
| (chamber) | 1.8 | 1 |
| (chamber) | 2.7 | 2 |
We use the chamber region events as an example of these studies. This is a very powerful data sample because if any observed events in the decay region were due to neutrino-He interactions, then there should be a factor of 28 more events in the chambers, after scaling for acceptance and mass. The numbers of observed events for the , and modes are listed in Table V along with the prediction for neutrino deep-inelastic scattering in the chambers. The observed events are consistent with the prediction, giving no indication of unexpected “clean”, two-track neutrino interactions in the chambers.
VII RESULTS OF THE SEARCH
Using the signal event selection criteria given above, the Monte Carlo background predictions are given in Table VI. The number of observed events is also shown. Three events were observed, which is considerably above the predicted background. No or events are observed, consistent with expectation.
| Decay Mode | Predicted Events | Observed Events |
|---|---|---|
| 3 | ||
| 0 | ||
| 0 |
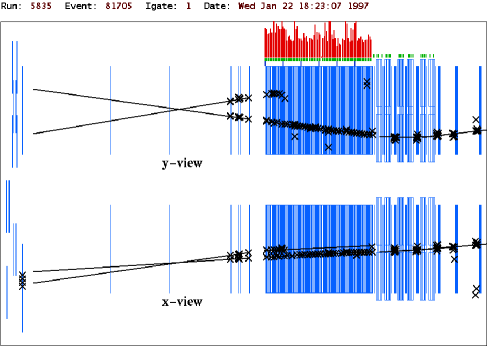
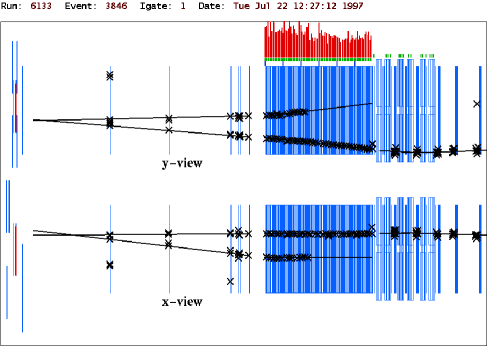
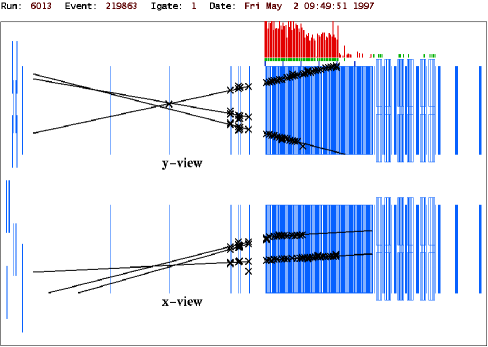
The events are shown in Figs. 8-10. A summary of the event reconstruction characteristics is shown in Tables VII and VIII. Because of the large multi-hit TDC ring-buffer used for the veto wall, it is typical for events to have an average of 1.7 counters firing per neutrino interaction. For event 5835/81705, the TDC times with respect to the trigger are 404, 536 ns, where the positive sign indicates the hits occurred after the trigger; for event 06133/03846, the hit occurred at ns; and for event 6013/219863, hits occurred at 256, , , and ns. Given the 3.8 ns timing resolution of the veto counters, these hits are well out of time.
| Run/Event | Mode | Eμ1 | Eμ2 | |||
|---|---|---|---|---|---|---|
| (GeV) | (GeV) | (GeV/) | (GeV/) | (GeV/) | ||
| 5835/81705 | –77.7 | 2.42 | 1.10 | 5.08 | ||
| 6133/3846 | –92.0 | 1.41 | 0.88 | 3.08 | ||
| 6013/219863 | 48.0 | 2.07 | 3.57 | 4.66 |
| Run/Event | pseudo- | |||
|---|---|---|---|---|
| () | ||||
| 5835/81705 | –46.7 | 3.6 | 196 | 6.3/9 (62%) |
| 6133/3846 | 46.5 | –38.6 | 792 | 166/17 (5%) |
| 6013/219863 | –59.2 | 14.7 | 186 | 22.6/10 (21%) |
VIII CROSS-CHECKS BY RELEASING CUTS
The observation of the three data events prompted further tests comparing data to Monte Carlo predictions with reduced cuts. These studies provide cross-checks on whether the signal was manufactured by the cuts, whether the Monte Carlo accurately models the data just outside the cuts, and whether there is any indication of excess background with less restrictive requirements.
The first study examined how data and Monte Carlo rates varied as the cuts were loosened gradually. The expected background and number of observed events at each step of the process is shown in Table IX. The first step was to remove the “clean cuts.” At this point, one additional event was observed. The total is written as , explicitly separating off the three candidates. The topology of this additional event was in agreement with the topology for a DIS event (extra track segments, excess of neutral energy, and extra hits), and with the Monte Carlo estimate of 0.25 events. No or events were observed which is consistent with expectation. Thus, except for the excess three events, at this step there is agreement between data and Monte Carlo. Continuing to remove the cuts sequentially, the fiducial region was increased to include the chambers; finally, all energy and PID cuts were removed. In both of these steps, the data continued to be in agreement with the Monte Carlo, except for the three candidate events.
A second study considered the effect of loosening the cuts on the expectation for a Monte Carlo which combined decays in mode with the standard background Monte Carlo. This study normalized the decay Monte Carlo to 3 events for standard cuts and then observed the expectation with the cuts sequentially released as shown in Table X. There is agreement of the data with the combined model but the low statistics are not definitive.
A third cross-check involved alternately releasing and then returning individual cuts and cut-pairs. For most cuts, no extra events entered the sample. When the requirement of “no extra track segments” was removed, one event entered the sample. When the “no extra clusters” cut was removed, one event identified as entered the sample. This is consistent with the Monte Carlo expectation, where the extra cluster is due to photons from a and these cause the event to look electromagnetic. When both of these cuts are removed, two more events enter the sample. Their topology is consistent with DIS. In summary, this cross-check did not reveal events which are similar to the candidates.
| Sequential Change to Cuts | Event Type | Number of Data Events | Monte Carlo Prediction |
|---|---|---|---|
| All cuts | 0.04 | ||
| 0 | 0.14 | ||
| 0 | 0.13 | ||
| Remove the “Clean Cuts” | 0.25 | ||
| 0 | 0.23 | ||
| 0 | 0.70 | ||
| Include the chamber region | 1.3 | ||
| 7 | 7.8 | ||
| 5 | 4.7 | ||
| Release energy & PID requirements | 2.3 | ||
| 10 | 16.0 | ||
| 10 | 10.8 |
| Event Type | Predicted Background | -decay | -decay + Background | Data |
|---|---|---|---|---|
| with “standard cuts” | 0.04 | 3.00 | 3.04 | 3 |
| releasing the “clean cuts” | 0.25 | 5.30 | 5.55 | 4 |
| Including chamber regions | 1.3 | 6.1 | 7.5 | 5 |
| removing & PID requirements | 2.3 | 6.1 | 8.6 | 6 |
IX CONSIDERATIONS UNDER AN HYPOTHESIS
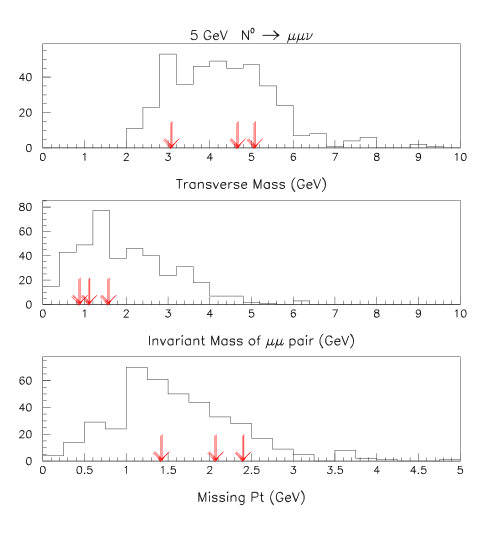
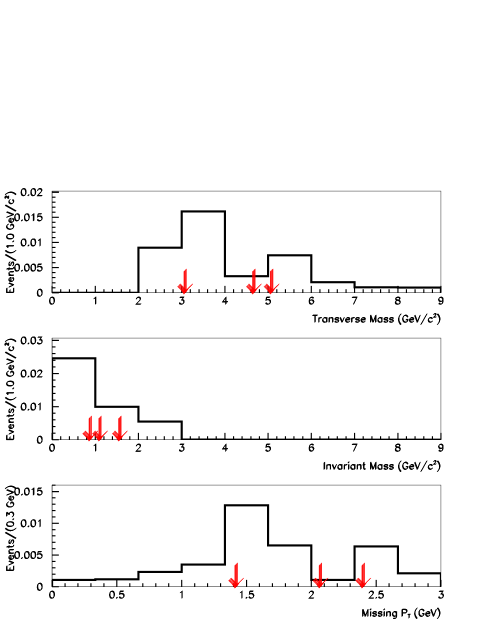
In many ways, the three events are consistent with a decay hypothesis. The events pass the analysis cuts, where the background is estimated to be 0.04 events. As expected for a decay relative to an interaction hypothesis, all three events occur well within the fiducial volume away from the chambers and are evenly distributed throughout the decay channel. The transverse mass, invariant mass, and missing are all consistent with a 5 GeV/c2 decay (Fig. 11).
Unlike the background, in both the NHL and neutralino models, one would expect the rate to be highly suppressed relative to leptonic decays. However, for a 5 GeV/c2 NHL model, one would expect 1.4 times more events [3]. This is not inconsistent with the observation of no candidates, but neither does it provide direct support. A neutralino model, on the other hand, can accommodate the observation of either only or a combination of and candidates by selecting appropriate couplings.
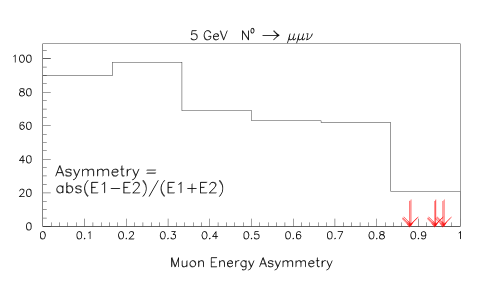
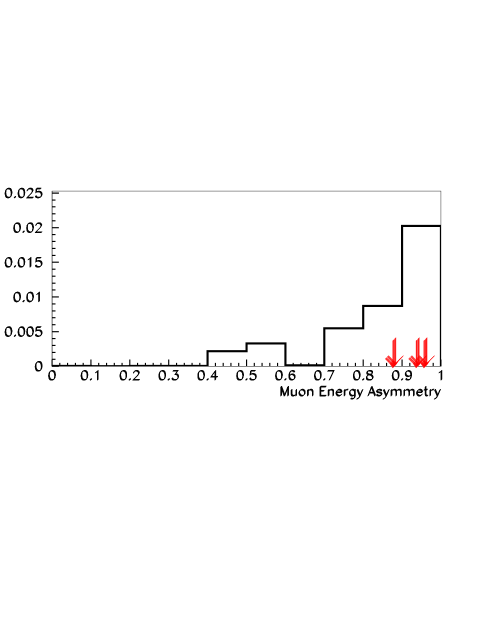
Globally, the events have one feature which is improbable for an decay hypothesis. Figure 12 shows the muon energy asymmetry ()/() for the 5 GeV/c2 simulation compared to the three data events. All three events have a muon energy asymmetry which is greater than 0.85. The probability that this occurs in a weak decay hypothesis [20] is less than (including acceptance).
Individually, there are also particular characteristics to note in two of the events. Event 06133/03846 has relatively poor vertex pseudo-/dof; the probability of an event having a pseudo-/dof greater than or equal to this is 5%. In event 6013/219863, three of the four hits in chamber DK4 immediately downstream of the vertex are missing. The probability of this occurring in a random event is less than . DK4 had persistent high voltage problems throughout the run and the absence of hits in this chamber may be due to this. However, we have examined the drift chamber readout string and found no indication that the chamber was misbehaving for this event and we have observed good tracks through this chamber for events proximate in time. Finally, we have discovered some evidence for a “coherent” inefficiency, a linked inefficiency between the and views. Such an inefficiency may occur at a level of () probability, again making the missing of the three hits on the tracks highly unlikely. This event also has a third track attached to a downstream vertex. To interpret this event as an decay, the added track must be interpreted as a delta ray. Such an interpretation is consistent with the calorimeter data. Event 5835/81705 does not suffer from reconstruction issues.
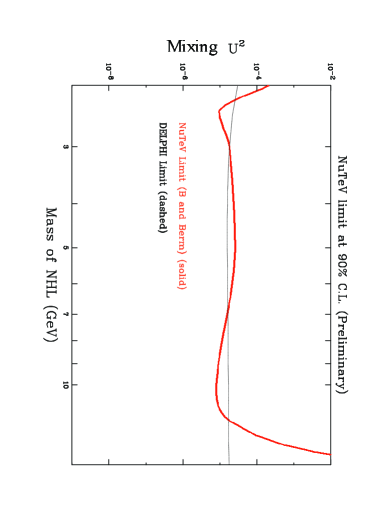
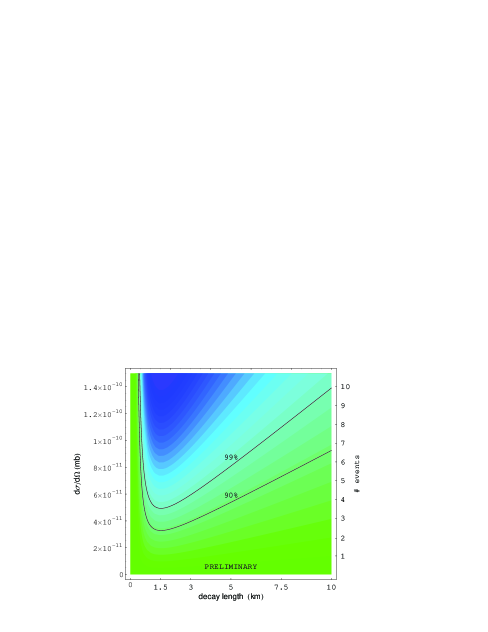
Interesting limits on the production of NHLs and neutralinos can be set that indicate the sensitivity of the decay channel search; these limits are set by calculating one-sided limits using a frequentist approach without background subtraction. Because the source of the events is unclear, the unified approach of Feldman and Cousins [21] has deliberately not been used. The limit on NHLs reaches mixing parameter values below and is consistent with the results from the Delphi experiment at LEP [22], as shown on Figure 13. NuTeV is the first experiment to set limits on the production of long-lived neutralinos in this mass range which decay by -parity violation. The result is shown in Figure 14. This limit, although motivated by a neutralino hypothesis, is a generic limit applicable for any model of neutral particle production at the target [4].
X CONSIDERATIONS UNDER VARIOUS NULL HYPOTHESES
Several aspects of the candidate events are similar to those from neutrino interaction backgrounds, and might be indicative of unaccounted-for sources. First, all three events occurred during the high rate -mode as opposed to -mode running periods; the to event ratio is expected to be 4:1 for all events and 1.5:1 for low-multiplicity events. Second, if the events were produced by neutrino interactions, then one would expect a high energy leading for -mode running. In the two cases where the charge of the leading muon can be measured, the charge is negative. The event kinematics (, , ) are consistent with the background simulation (Fig. 15) and, for DIS background, the probability for three events with the observed energy asymmetry is 25 to (Fig. 16). If these are interpreted as DIS events, then the visible (measured) squared four-momentum transfer, , for each is 6.4, 2.5, and 5.6 GeV2, respectively.
On the other hand, it is difficult to explain these events as neutrino interactions. If all of these events are due to charged-current neutrino interactions in the helium which give a prompt second muon (charm production, trident production, etc.), then the rate is two orders of magnitude greater than predicted by the Monte Carlo. If such a source was not included in our simulations, then we would also expect between 10 and 300 additional events at 99% confidence level [21] in the chambers and between 30,000 and 220,000 events at 99% confidence level in the calorimeter itself. We actually see only 2 chamber events in agreement with our Monte Carlo (see Table IX) and 54 events with similar kinematics were found in the calorimeter [19]. In order to show the difficulty of developing reasonable “null” (background) hypotheses, we consider three examples below.
The first null hypothesis is that the events were actually prompt events produced in the chambers and misreconstructed in the helium. If we try to force vertex reconstruction for the two muons in 6013/219863 at the nearest downstream chamber (DK4), the pseudo- goes from 22.9/10 for the standard fit up to 290.2/11 for the forced fit. If the third track is also forced to be on the vertex, the pseudo- rises to 323.6/17. If one does not require the track to be in the chambers, but requires all three tracks to come from the same vertex, then one obtains 217.1/16. Likewise, event 6133/3846 produces a poor fit to the chambers. For the chamber downstream of the vertex (DK5), the pseudo- is 94,720/18 and for the testbeam chamber upstream it is 543/18. These are well above the original fit of 166/17. Finally, for 5835/81705, the standard fit gives 6.3/9 which increases to 51.5/10 if forced to be reconstructed in the chamber upstream (DK4). Aside from the problems of forcing a fit to the chambers, this hypothesis leaves unanswered the questions: 1) why are only events misreconstructed, and not or ? and 2) what is the source of these excess ’s?
A second null hypothesis rejects the idea that the events are prompt, and instead attributes them to unsimulated interactions, where the pion decays to produce the second muon and the other particles in the reaction (signified by ) are not seen. This has the advantage of being more plausible than an unexpected source of prompt events, but it suffers from several problems. First, if these are events which occur in the chambers, then one must explain why the events are misreconstructed in the helium. The transverse momentum associated with pion decay is very small, so the muon track would generally point back to the original chamber vertex. For those events which do show an offset, there will be a much higher probability of occurring in the 15.2 to 101.6 cm range than well beyond 101.6 cm, where these events are found. Also, only 7% of the pions will decay within the decay channel so many undecayed events should be observed.
Quantitatively, the data in these other channels can be compared to different scalings of the observed three events. The DIS Monte Carlo predicts a ratio of to events of 3.25 for the sample with all the standard cuts. With this ratio, the probability of seeing 3 events and, as observed, 0 is 0.31%. Furthermore, one can scale these events in the helium by the ratio of masses and acceptance for the chambers versus helium and compare to the observed and events seen in chambers with the loosest cuts. Given that ratio, the 10 (2 ) events observed in the chambers are consistent at a confidence level of only () with the hypothesis that the three events in the helium are due to an unaccounted-for source. It is therefore extremely unlikely that an unsimulated source is responsible for the three events in the helium.
A third null hypothesis is that the candidates are neutrino interactions in the chambers producing a final state followed by a decay that causes the event vertex to be misreconstructed downstream in the helium region. This process has the advantage that the decay angle is sufficiently large for an event produced in the chambers to reconstruct in the helium. Fits to the three candidate events under this hypothesis show that that the fits are kinematically possible. Taking the kaon momenta calculated from the fit, the probabilities are 17.6%, 11.6% and 8.2% for the kaon to decay. Because the decay channel tracking is largely located downstream of the decay region, most two-track vertices, including most simulated events, can also be reconstructed as displaced-vertex kaon decays with high quality.
However, the kaon hypothesis does not explain these events for several reasons. First, direct production is Cabibbo-suppressed, so most production is through fragmentation. Direct production is also most likely in running, whereas the events are only seen in running periods. Approximately 20% of events produce kaons through fragmentation, but this occurs mainly in high multiplicity events which would be cut by the “clean cuts.” This process is included in the 0.040 event background estimate, to which it contributes 0.0025 events. Clean events could be produced by diffractive production; the large angle of the high energy muons in these events, however, is uncharacteristic of diffractive production and the excess is far above expectation (see Table IV).
Finally, as with the pion decay hypothesis only a small fraction, 22%, of the kaons from neutrino interactions will decay. In addition, because kaon decays have large , only 45% of the producing two muons in the calorimeter will have a vertex formed by the two muons. In the other cases, the decay plane is aligned such that the two muons fail to verticize in the decay channel. (Such unaligned dimuon events consistent with all but the vertex cut are not observed in the data.) As in the case of the pions, we can use scaling arguments to compare the observed data to the predictions of this hypothesis. In the data, there are one and two chamber events with all the standard cuts but with the track energy requirements removed. The scaling factor is 8.24 between events in the drift chambers and events in the helium. Under this hypothesis, the probability to see, as observed, three or fewer -hadron events in the chambers given the three events in the helium is 0.37%. Therefore, the paucity of -hadron events in the chambers excludes at 99.6% confidence level the possibility of an unsimulated source large enough to explain the three observed events in the helium.
XI SUMMARY AND CONCLUSIONS
In summary, NuTeV has observed 3 events, 0 and 0 events with transverse mass above 2.2 GeV/. The expected backgrounds were , , and events (preliminary), respectively.
NuTeV has set new limits on NHL and neutralino decays based on this analysis. The NHL limits are consistent with the Delphi result. The neutralino results are the first in this kinematic region for the long-lived which decays with -parity violation.
In conclusion, the rate corresponding to the observed three events is not consistent with Standard Model processes we have identified and the source of the events is not clear.
This research was supported by the U.S. Department of Energy and the National Science Foundation. We thank the staff of FNAL for their contributions to the construction and support of this experiment during the 1996-97 fixed target run.
REFERENCES
REFERENCES
- [1] M. Gronau, C. N. Leung, and J. L. Rosner, Phys. Rev. D 29, 2539 (1984).
- [2] R. E. Shrock, Phys. Rev. D 24, 1232 (1981).
- [3] L. M. Johnson, D. W. McKay, and T. Bolton, Phys. Rev. D 56, 2970 (1997).
- [4] L. Borissov et al., hep-ph0007195.
- [5] A. Vaitaitis et al., Phys. Rev. Lett. 83, 4943 (1999).
- [6] J. A. Formaggio et al., Phys. Rev. Lett. 84, 4043 (2000).
- [7] R. Ammar et al., Phys. Rev. Lett. 61, 2185 (1988); K. Kodoma et al., Phys. Lett. B 263, 573 (1991). (Also, see S. Frixione et al., Nucl. Phys. B 431, 453 (1994)).
- [8] B. Armbruster et al., Phys. Lett. 348B, 19 (1995).
- [9] C. Albright, Phys. Rev. D 12, 1319 (1975).
- [10] T. Alexopoulos et al., Phys. Rev. Lett. 82, 41 (1999).
- [11] J. Yu, et al., “Technical Memorandum: NuTeV SSQT performance,” Report No. FERMILAB-TM-2040, 1998.
- [12] W. Sakumoto et al., Nucl. Instrum. Methods A 294, 179 (1990); B. King et al., Nucl. Instrum. Methods A 302, 254 (1991).
- [13] D. Harris, J. Yu, et al., Nucl. Instrum. Methods A 447, 377 (2000).
- [14] Applications and Software Group, CERN, “GEANT: Detector Description and Simulation Tool,” CERN Program Library Report Q123.
- [15] G. Ingelman et al., Proc. ‘Physics at HERA’, (1992).
- [16] W. G. Seligman et al., Phys. Rev. Lett. 79, 1213 (1997).
- [17] K. J. Eskola et al., Eur. Phys. Jour. C 9 61 (1999).
- [18] R. Belusevic and D Rein, Phys. Rev. D 38, 2753 (1988).
- [19] T. Adams et al., Phys. Rev. D 61, 092001 (2000).
- [20] J. A. Formaggio et al., Phys. Rev. D 57, 7037 (1998).
- [21] G. Feldman and R. Cousins, Phys. Rev. D 57, 3873 (1998).
- [22] P. Abreu et al., Z. Phys. C 74, 57 (1997).