The Ratio of Jet Cross Sections at GeV and 1800 GeV
Abstract
The DØ Collaboration has measured the inclusive jet cross section in collisions at GeV. The results for pseudorapidities are combined with our previous results at GeV to form a ratio of cross sections with smaller uncertainties than either individual measurement. Next-to-leading-order QCD predictions show excellent agreement with the measurement at 630 GeV; agreement is also satisfactory for the ratio. Specifically, despite a 10% to 15% difference in the absolute magnitude, the dependence of the ratio on jet transverse momentum is very similar for data and theory.
For reactions with large momentum transfers, quantum chromodynamics (QCD) treats complex proton-antiproton interactions in terms of simpler scattering processes involving only one constituent from each particle. Identifying these “parton” constituents with quarks and gluons, perturbative QCD calculates production cross sections for scattered partons (observed as showers or “jets” of collimated particles) that also depend on empirically-determined parton distribution functions (PDF) of the proton.
This measurement compares the production rate of jets as a function of their transverse energy, , at two center-of-mass energies: GeV and 1800 GeV. This comparison reduces the systematic uncertainties and minimizes the prediction’s sensitivity to choice of PDF.
In the simple parton model, inclusive jet cross sections scale with in the sense that the dimensionless quantity , as a function of jet , does not depend on [1]. In this model, the ratio of scaled cross sections for different energies is unity for all . Although previous data [2, 3] exhibited significant deviation from this naive scaling, the dimensionless framework provides a useful context for comparison with QCD. The DØ collaboration at the Fermilab Tevatron recently published the inclusive jet cross section at GeV using nb-1 of data [4]. This Letter presents our complementary measurement at GeV, using a sample of nb-1 of data [5]. Because the data at both values of were collected with the same detector [6], many uncertainties in the results are highly correlated, and the ratio of the cross sections has greater precision than either of the absolute measurements.
The differential jet cross section, , is measured in bins of and pseudorapidity, , where is the polar angle of the jet relative to the proton beam. (In this formulation, the dimensionless cross section, averaged over azimuth, is .) The DØ reconstruction algorithm defines a jet by the total observed in calorimeter cells contained within a cone of radius , where is the azimuthal angle. When two such clusters of cells overlap, they are merged into a single jet if they share more than 50% of the of the lower- cluster; otherwise, they are split into two separate jets, each defined by its own - centroid and value [7].
The online trigger requires at least one jet above a set threshold. The offline data selection procedure, which suppresses backgrounds from electrons, photons, noise, and cosmic rays, follows the methods used in the 1800 GeV analysis [8, 9]. The efficiency of jet selection is approximately and is nearly independent of jet . To maintain precision in jet , a vertex requirement removes jets resulting from interactions more than 50 cm from the center of the detector, thereby reducing the total efficiency to . The uncertainty on the cross section associated with all efficiencies is [9].
Jet energies are corrected [10] for the energy response of the DØ calorimeter to hadrons, the broadening of the hadronic shower, and energy from multiple interactions, calorimeter noise, and the underlying event (fragmentation of the spectator partons). The response correction increases the of jets by for measured calorimeter of , and by for jet above 100 GeV. The 1% showering correction recovers the net energy lost when hadrons from inside the R=0.7 cone deposit energy outside it as they interact within the calorimeter. Calorimeter noise, from electronics and from uranium activity, contributes on average of to each jet. The underlying event contributes of to each jet at , compared to at . The corrections offset one another, so that a jet’s measured typically increases by 12% to 14% after implementing all energy scale corrections. Uncertainties in the corrections for noise and response dominate the systematic uncertainty of the final result.
Both detector imperfections and random fluctuations in shower development of individual jets within the calorimeter result in the smearing of a jet’s about its true value. The finite resolution shifts the observed cross section to higher , especially in the most steeply falling regions of the distribution. The measurement of jet resolution as a function of and the unsmearing procedure follow the steps described in Ref. [4]. The unsmearing correction is larger at 630 GeV than at 1800 GeV because the cross section is significantly steeper at the values of interest.
Figure 1 depicts the inclusive jet cross section at in the pseudorapidity bin . Each data point indicates the at which the cross section within that bin has its average value. The bin widths are chosen to match the bins in from the analysis. Table I reports the bin ranges, point positions, and uncertainties. The solid line in Fig. 1 indicates the result of a calculation using the jetrad next-to-leading-order (NLO) partonic event generator [11] and the CTEQ3M PDFs [12]. The renormalization and factorization scales are set to , where corresponds to the of the leading jet in an event.
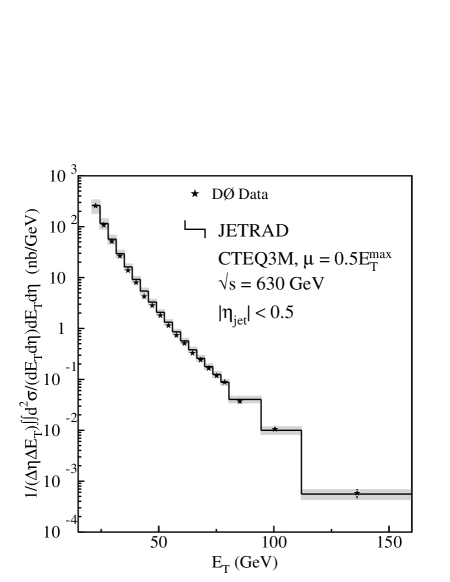
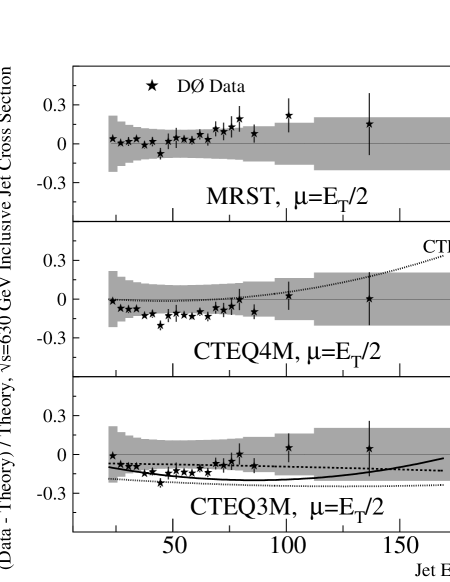
Figure 2 compares the cross section to the NLO QCD prediction in greater detail. The “baseline” renormalization and factorization scales are set to ; additional lines in Fig. 2 indicate the predictions that result from changes in either PDF or relative to the baseline prediction specified for that pane. The shaded regions in Fig. 2 indicate the one standard deviation systematic uncertainty of the measurement, and the vertical bars indicate the statistical uncertainty. The first prediction, generated with the MRST [13] PDF, is shown to best reproduce the absolute magnitude of the data, but the CTEQ4HJ [14] curve in the second pane appears to provide the closest match in shape. Changing modifies both the normalization and the shape of the predictions, as seen in the third pane. We quantify the agreement between the data and the various predictions with a comparison, as described below.
| Bin | Plotted | Plotted | Cross Sec. (nb/GeV) | Cross Sec. | Ratio | Ratio | |
|---|---|---|---|---|---|---|---|
| (GeV) | (GeV) | Stat. Error | Sys. Error () | Stat. | Sys. () | ||
| – | |||||||
| – | |||||||
| – | |||||||
| – | |||||||
| – | |||||||
| – | |||||||
| – | |||||||
| – | |||||||
| – | |||||||
| – | |||||||
| – | |||||||
| – | |||||||
| – | |||||||
| – | |||||||
| – | |||||||
| – | |||||||
| – | |||||||
| – | |||||||
| – | |||||||
| – | |||||||
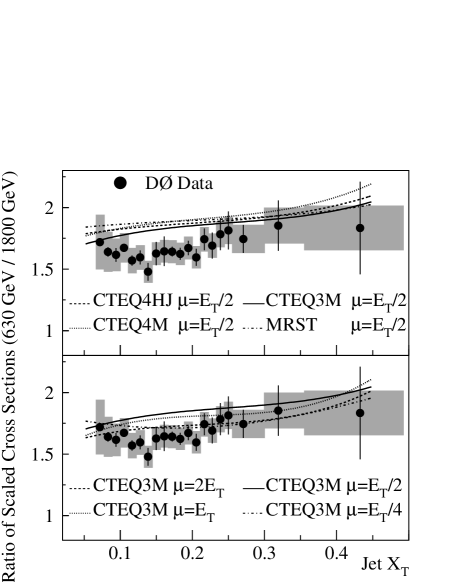
Combining the results from this Letter with those of Ref. [4], Fig. 3 displays the ratio of dimensionless jet cross sections as a function of . The observed ratio ranges from 1.48 to 1.85, depending on the value of . The largest uncertainties arise from the corrections for response and noise, and the rest primarily from resolution and luminosity. Although the systematic errors on the individual measurements range from 10% to as much as 30%, strong correlations reduce the uncertainty on the ratio to values as small as . The two final columns of Table I provide the numerical results for the ratio.
As shown in Fig. 3, NLO QCD predictions for the ratio lie systematically above the data throughout most of the measured range, in particular between of 0.1 and 0.2, where the ratio has the smallest statistical uncertainty. Choice of PDF has little effect on the prediction — only the renormalization/factorization scales change the prediction appreciably.
A covariance matrix comparing data and theory provides a measure of the probability that the theory describes the observed results. To verify that our covariance matrix, built mostly from correlated systematic uncertainties, produces results that are consistent with a standard distribution with 20 degrees of freedom, we generated an ensemble of 20 million experiments using a Monte Carlo program. Each statistical and systematic error was simulated and varied randomly using appropriate correlations in and . Systematic errors were not necessarily assumed to be Gaussian distributed; some numbers were drawn from uniform probability distributions, as appropriate. The comparisons (between the original input and each of the final, randomly-varied distributions) is in excellent agreement with the shape of the function for 20 degrees of freedom. We find that the standard probability obtained from an integral of the distribution provides an appropriate vehicle for comparing data with predictions.
Table II reports both the values and the probabilities for the comparison of the data with different NLO QCD predictions. The inclusive jet cross section at GeV is consistent with all the tested PDFs and scales, with but two exceptions. For the ratio of cross sections, there is no significant difference in shape between data and theory, and essentially all predictions lie within an acceptable range. The overall results in Table II indicate reasonable agreement between the ratio and NLO QCD.
We performed a second test to quantify the observed difference in the absolute magnitudes of the predicted and observed ratios, without particular regard to the shapes of the distributions. Using the covariance matrix and assuming that the value of the ratio is a constant with respect to , we found the best-fit horizontal line for the data. The value that results from a comparison of this single point to the equivalently-calculated theory point yields the probabilities listed in the final column of Table II. In every case, discarding the information on shape in favor of a comparison of absolute magnitude results in poorer agreement between data and theory, particularly for the often-favored scale of .
In conclusion, we have measured the inclusive jet cross section at two center-of-mass energies, 630 GeV and 1800 GeV. Both the published data at 1800 GeV [4] and the data presented here at 630 GeV are generally well-described by NLO QCD, with the exception of predictions using CTEQ3M() and MRSTGD PDFs. In the ratio of dimensionless cross sections at the two energies, experimental uncertainties are much smaller and differences in the predictions from choice of PDF are less important. NLO predictions for the ratio exhibit satisfactory agreement with the shape of the observed ratio. In terms of only the magnitude however, the absolute values of the predictions lie significantly higher than the data, especially for the standard scale .
| 630 GeV C. Sec. | Ratio | Norm. | |||||
| Prob. | Prob. | Prob. | |||||
| 2 | 40.5 | 0.43% | 17.9 | 59.4% | 3.33 | 6.81% | |
| 25.9 | 16.8% | 21.6 | 36.2% | 7.13 | 0.76% | ||
| CTEQ3M | 30.4 | 6.37% | 20.5 | 42.5% | 9.56 | 0.20% | |
| 27.5 | 12.2% | 15.1 | 77.4% | 1.45 | 22.93% | ||
| CTEQ4M | 24.1 | 23.8% | 22.4 | 31.9% | 10.67 | 0.11% | |
| CTEQ4HJ | 18.9 | 52.5% | 21.0 | 40.0% | 13.21 | 0.03% | |
| MRST | 22.6 | 30.7% | 22.2 | 33.0% | 12.60 | 0.04% | |
| MRSTGU | 14.9 | 78.2% | 19.5 | 48.7% | 11.07 | 0.09% | |
| MRSTGD | 51.8 | 24.1 | 23.9% | 12.92 | 0.03% | ||
We thank the staffs at Fermilab and at collaborating institutions for contributions to this work, and acknowledge support from the Department of Energy and National Science Foundation (USA), Commissariat à L’Energie Atomique and CNRS/Institut National de Physique Nucléaire et de Physique des Particules (France), Ministry for Science and Technology and Ministry for Atomic Energy (Russia), CAPES and CNPq (Brazil), Departments of Atomic Energy and Science and Education (India), Colciencias (Colombia), CONACyT (Mexico), Ministry of Education and KOSEF (Korea), CONICET and UBACyT (Argentina), A.P. Sloan Foundation, and the A. von Humboldt Foundation.
REFERENCES
- [1] R.P. Feynman, R.D. Field, and G.C. Fox, Phys. Rev. D 18 3320, 1978.
- [2] UA2 Collaboration, J.A. Appel et al., Phys. Lett. B160, 349 (1985).
- [3] CDF Collaboration, F. Abe et al., Phys Rev. Lett. 70, 1376 (1993).
- [4] DØ Collaboration, B. Abbott et al., Phys. Rev. Lett. 82, 2451 (1999).
- [5] J. Krane, J. Bantly, and D. Owen, Fermilab-TM-2000, 1997, (unpublished).
- [6] DØ Collaboration, S. Abachi et al., Nucl. Instrum. Methods Phys. Res. A 338, 185 (1994).
- [7] B. Abbott et al., Fermilab-Pub-97-242-E, 1997, (unpublished).
-
[8]
V.D. Elvira, Ph. D. Thesis, Universidad de
Buenos Aires, 1995 (unpublished),
http://www-d0.fnal.gov/results/
publications_talks/thesis/thesis.html . -
[9]
J. Krane, Ph. D. Thesis, University of
Nebraska–Lincoln, 1998 (unpublished),
http://fnalpubs.fnal.gov/techpubs/theses.html . - [10] DØ Collaboration, B. Abbott et al., Nucl. Instrum. Methods Phys. Res. A 424, 352 (1999).
- [11] W.T. Giele, E.W.N. Glover, and D.A. Kosower, Phys. Rev. Lett. 73, 2019 (1994).
- [12] H.L. Lai et al., Phys. Rev. D 51, 4763 (1995).
- [13] A.D. Martin et al., Eur. Phys. J. C 4, 463 (1998).
- [14] H.L. Lai et al., Phys. Rev. D 55, 1280 (1997).