BABAR-CONF-00/07
SLAC-PUB-8529
A measurement of the charged and neutral meson lifetimes using fully reconstructed decays
The BABAR Collaboration
Abstract
Data collected with the BABAR detector at the PEP-II asymmetric Factory at SLAC are used to study the lifetimes of the and mesons. The data sample consists of 7.4 collected near the resonance. and mesons are fully reconstructed in several exclusive hadronic decay modes to charm and charmonium final states. The lifetimes are determined from the flight length difference between the two mesons which are pair-produced in the decay. The preliminary measurements of the lifetimes are
and of their ratio is
Submitted to the XXXth International Conference on High Energy Physics, Osaka, Japan.
The BABAR Collaboration
B. Aubert, A. Boucham, D. Boutigny, I. De Bonis, J. Favier, J.-M. Gaillard, F. Galeazzi, A. Jeremie, Y. Karyotakis, J. P. Lees, P. Robbe, V. Tisserand, K. Zachariadou
Lab de Phys. des Particules, F-74941 Annecy-le-Vieux, CEDEX, France
A. Palano
Università di Bari, Dipartimento di Fisica and INFN, I-70126 Bari, Italy
G. P. Chen, J. C. Chen, N. D. Qi, G. Rong, P. Wang, Y. S. Zhu
Institute of High Energy Physics, Beijing 100039, China
G. Eigen, P. L. Reinertsen, B. Stugu
University of Bergen, Inst. of Physics, N-5007 Bergen, Norway
B. Abbott, G. S. Abrams, A. W. Borgland, A. B. Breon, D. N. Brown, J. Button-Shafer, R. N. Cahn, A. R. Clark, Q. Fan, M. S. Gill, S. J. Gowdy, Y. Groysman, R. G. Jacobsen, R. W. Kadel, J. Kadyk, L. T. Kerth, S. Kluth, J. F. Kral, C. Leclerc, M. E. Levi, T. Liu, G. Lynch, A. B. Meyer, M. Momayezi, P. J. Oddone, A. Perazzo, M. Pripstein, N. A. Roe, A. Romosan, M. T. Ronan, V. G. Shelkov, P. Strother, A. V. Telnov, W. A. Wenzel
Lawrence Berkeley National Lab, Berkeley, CA 94720, USA
P. G. Bright-Thomas, T. J. Champion, C. M. Hawkes, A. Kirk, S. W. O’Neale, A. T. Watson, N. K. Watson
University of Birmingham, Birmingham, B15 2TT, UK
T. Deppermann, H. Koch, J. Krug, M. Kunze, B. Lewandowski, K. Peters, H. Schmuecker, M. Steinke
Ruhr Universität Bochum, Inst. f. Experimentalphysik 1, D-44780 Bochum, Germany
J. C. Andress, N. Chevalier, P. J. Clark, N. Cottingham, N. De Groot, N. Dyce, B. Foster, A. Mass, J. D. McFall, D. Wallom, F. F. Wilson
University of Bristol, Bristol BS8 lTL, UK
K. Abe, C. Hearty, T. S. Mattison, J. A. McKenna, D. Thiessen
University of British Columbia, Vancouver, BC, Canada V6T 1Z1
B. Camanzi, A. K. McKemey, J. Tinslay
Brunel University, Uxbridge, Middlesex UB8 3PH, UK
V. E. Blinov, A. D. Bukin, D. A. Bukin, A. R. Buzykaev, M. S. Dubrovin, V. B. Golubev, V. N. Ivanchenko, A. A. Korol, E. A. Kravchenko, A. P. Onuchin, A. A. Salnikov, S. I. Serednyakov, Yu. I. Skovpen, A. N. Yushkov
Budker Institute of Nuclear Physics, Siberian Branch of Russian Academy of Science, Novosibirsk 630090, Russia
A. J. Lankford, M. Mandelkern, D. P. Stoker
University of California at Irvine, Irvine, CA 92697, USA
A. Ahsan, K. Arisaka, C. Buchanan, S. Chun
University of California at Los Angeles, Los Angeles, CA 90024, USA
J. G. Branson, R. Faccini,111 Jointly appointed with Università di Roma La Sapienza, Dipartimento di Fisica and INFN, I-00185 Roma, Italy D. B. MacFarlane, Sh. Rahatlou, G. Raven, V. Sharma
University of California at San Diego, La Jolla, CA 92093, USA
C. Campagnari, B. Dahmes, P. A. Hart, N. Kuznetsova, S. L. Levy, O. Long, A. Lu, J. D. Richman, W. Verkerke, M. Witherell, S. Yellin
University of California at Santa Barbara, Santa Barbara, CA 93106, USA
J. Beringer, D. E. Dorfan, A. Eisner, A. Frey, A. A. Grillo, M. Grothe, C. A. Heusch, R. P. Johnson, W. Kroeger, W. S. Lockman, T. Pulliam, H. Sadrozinski, T. Schalk, R. E. Schmitz, B. A. Schumm, A. Seiden, M. Turri, D. C. Williams
University of California at Santa Cruz, Institute for Particle Physics, Santa Cruz, CA 95064, USA
E. Chen, G. P. Dubois-Felsmann, A. Dvoretskii, D. G. Hitlin, Yu. G. Kolomensky, S. Metzler, J. Oyang, F. C. Porter, A. Ryd, A. Samuel, M. Weaver, S. Yang, R. Y. Zhu
California Institute of Technology, Pasadena, CA 91125, USA
R. Aleksan, G. De Domenico, A. de Lesquen, S. Emery, A. Gaidot, S. F. Ganzhur, G. Hamel de Monchenault, W. Kozanecki, M. Langer, G. W. London, B. Mayer, B. Serfass, G. Vasseur, C. Yeche, M. Zito
Centre d’Etudes Nucléaires, Saclay, F-91191 Gif-sur-Yvette, France
S. Devmal, T. L. Geld, S. Jayatilleke, S. M. Jayatilleke, G. Mancinelli, B. T. Meadows, M. D. Sokoloff
University of Cincinnati, Cincinnati, OH 45221, USA
J. Blouw, J. L. Harton, M. Krishnamurthy, A. Soffer, W. H. Toki, R. J. Wilson, J. Zhang
Colorado State University, Fort Collins, CO 80523, USA
S. Fahey, W. T. Ford, F. Gaede, D. R. Johnson, A. K. Michael, U. Nauenberg, A. Olivas, H. Park, P. Rankin, J. Roy, S. Sen, J. G. Smith, D. L. Wagner
University of Colorado, Boulder, CO 80309, USA
T. Brandt, J. Brose, G. Dahlinger, M. Dickopp, R. S. Dubitzky, M. L. Kocian, R. Müller-Pfefferkorn, K. R. Schubert, R. Schwierz, B. Spaan, L. Wilden
Technische Universität Dresden, Inst. f. Kern- u. Teilchenphysik, D-01062 Dresden, Germany
L. Behr, D. Bernard, G. R. Bonneaud, F. Brochard, J. Cohen-Tanugi, S. Ferrag, E. Roussot, C. Thiebaux, G. Vasileiadis, M. Verderi
Ecole Polytechnique, Lab de Physique Nucléaire H. E., F-91128 Palaiseau, France
A. Anjomshoaa, R. Bernet, F. Di Lodovico, F. Muheim, S. Playfer, J. E. Swain
University of Edinburgh, Edinburgh EH9 3JZ, UK
C. Bozzi, S. Dittongo, M. Folegani, L. Piemontese
Università di Ferrara, Dipartimento di Fisica and INFN, I-44100 Ferrara, Italy
E. Treadwell
Florida A&M University, Tallahassee, FL 32307, USA
R. Baldini-Ferroli, A. Calcaterra, R. de Sangro, D. Falciai, G. Finocchiaro, P. Patteri, I. M. Peruzzi,222 Jointly appointed with Univ. di Perugia, I-06100 Perugia, Italy M. Piccolo, A. Zallo
Laboratori Nazionali di Frascati dell’INFN, I-00044 Frascati, Italy
S. Bagnasco, A. Buzzo, R. Contri, G. Crosetti, P. Fabbricatore, S. Farinon, M. Lo Vetere, M. Macri, M. R. Monge, R. Musenich, R. Parodi, S. Passaggio, F. C. Pastore, C. Patrignani, M. G. Pia, C. Priano, E. Robutti, A. Santroni
Università di Genova, Dipartimento di Fisica and INFN, I-16146 Genova, Italy
J. Cochran, H. B. Crawley, P.-A. Fischer, J. Lamsa, W. T. Meyer, E. I. Rosenberg
Iowa State University, Ames, IA 50011-3160, USA
R. Bartoldus, T. Dignan, R. Hamilton, U. Mallik
University of Iowa, Iowa City, IA 52242, USA
C. Angelini, G. Batignani, S. Bettarini, M. Bondioli, M. Carpinelli, F. Forti, M. A. Giorgi, A. Lusiani, M. Morganti, E. Paoloni, M. Rama, G. Rizzo, F. Sandrelli, G. Simi, G. Triggiani
Università di Pisa, Scuola Normale Superiore, and INFN, I-56010 Pisa, Italy
M. Benkebil, G. Grosdidier, C. Hast, A. Hoecker, V. LePeltier, A. M. Lutz, S. Plaszczynski, M. H. Schune, S. Trincaz-Duvoid, A. Valassi, G. Wormser
LAL, F-91898 ORSAY Cedex, France
R. M. Bionta, V. Brigljević, O. Fackler, D. Fujino, D. J. Lange, M. Mugge, X. Shi, T. J. Wenaus, D. M. Wright, C. R. Wuest
Lawrence Livermore National Laboratory, Livermore, CA 94550, USA
M. Carroll, J. R. Fry, E. Gabathuler, R. Gamet, M. George, M. Kay, S. McMahon, T. R. McMahon, D. J. Payne, C. Touramanis
University of Liverpool, Liverpool L69 3BX, UK
M. L. Aspinwall, P. D. Dauncey, I. Eschrich, N. J. W. Gunawardane, R. Martin, J. A. Nash, P. Sanders, D. Smith
University of London, Imperial College, London, SW7 2BW, UK
D. E. Azzopardi, J. J. Back, P. Dixon, P. F. Harrison, P. B. Vidal, M. I. Williams
University of London, Queen Mary and Westfield College, London, E1 4NS, UK
G. Cowan, M. G. Green, A. Kurup, P. McGrath, I. Scott
University of London, Royal Holloway and Bedford New College, Egham, Surrey TW20 0EX, UK
D. Brown, C. L. Davis, Y. Li, J. Pavlovich, A. Trunov
University of Louisville, Louisville, KY 40292, USA
J. Allison, R. J. Barlow, J. T. Boyd, J. Fullwood, A. Khan, G. D. Lafferty, N. Savvas, E. T. Simopoulos, R. J. Thompson, J. H. Weatherall
University of Manchester, Manchester M13 9PL, UK
C. Dallapiccola, A. Farbin, A. Jawahery, V. Lillard, J. Olsen, D. A. Roberts
University of Maryland, College Park, MD 20742, USA
B. Brau, R. Cowan, F. Taylor, R. K. Yamamoto
Massachusetts Institute of Technology, Lab for Nuclear Science, Cambridge, MA 02139, USA
G. Blaylock, K. T. Flood, S. S. Hertzbach, R. Kofler, C. S. Lin, S. Willocq, J. Wittlin
University of Massachusetts, Amherst, MA 01003, USA
P. Bloom, D. I. Britton, M. Milek, P. M. Patel, J. Trischuk
McGill University, Montreal, PQ, Canada H3A 2T8
F. Lanni, F. Palombo
Università di Milano, Dipartimento di Fisica and INFN, I-20133 Milano, Italy
J. M. Bauer, M. Booke, L. Cremaldi, R. Kroeger, J. Reidy, D. Sanders, D. J. Summers
University of Mississippi, University, MS 38677, USA
J. F. Arguin, J. P. Martin, J. Y. Nief, R. Seitz, P. Taras, A. Woch, V. Zacek
Université de Montreal, Lab. Rene J. A. Levesque, Montreal, QC, Canada, H3C 3J7
H. Nicholson, C. S. Sutton
Mount Holyoke College, South Hadley, MA 01075, USA
N. Cavallo, G. De Nardo, F. Fabozzi, C. Gatto, L. Lista, D. Piccolo, C. Sciacca
Università di Napoli Federico II, Dipartimento di Scienze Fisiche and INFN, I-80126 Napoli, Italy
M. Falbo
Northern Kentucky University, Highland Heights, KY 41076, USA
J. M. LoSecco
University of Notre Dame, Notre Dame, IN 46556, USA
J. R. G. Alsmiller, T. A. Gabriel, T. Handler
Oak Ridge National Laboratory, Oak Ridge, TN 37831, USA
F. Colecchia, F. Dal Corso, G. Michelon, M. Morandin, M. Posocco, R. Stroili, E. Torassa, C. Voci
Università di Padova, Dipartimento di Fisica and INFN, I-35131 Padova, Italy
M. Benayoun, H. Briand, J. Chauveau, P. David, C. De la Vaissière, L. Del Buono, O. Hamon, F. Le Diberder, Ph. Leruste, J. Lory, F. Martinez-Vidal, L. Roos, J. Stark, S. Versillé
Universités Paris VI et VII, Lab de Physique Nucléaire H. E., F-75252 Paris, Cedex 05, France
P. F. Manfredi, V. Re, V. Speziali
Università di Pavia, Dipartimento di Elettronica and INFN, I-27100 Pavia, Italy
E. D. Frank, L. Gladney, Q. H. Guo, J. H. Panetta
University of Pennsylvania, Philadelphia, PA 19104, USA
M. Haire, D. Judd, K. Paick, L. Turnbull, D. E. Wagoner
Prairie View A&M University, Prairie View, TX 77446, USA
J. Albert, C. Bula, M. H. Kelsey, C. Lu, K. T. McDonald, V. Miftakov, S. F. Schaffner, A. J. S. Smith, A. Tumanov, E. W. Varnes
Princeton University, Princeton, NJ 08544, USA
G. Cavoto, F. Ferrarotto, F. Ferroni, K. Fratini, E. Lamanna, E. Leonardi, M. A. Mazzoni, S. Morganti, G. Piredda, F. Safai Tehrani, M. Serra
Università di Roma La Sapienza, Dipartimento di Fisica and INFN, I-00185 Roma, Italy
R. Waldi
Universität Rostock, D-18051 Rostock, Germany
P. F. Jacques, M. Kalelkar, R. J. Plano
Rutgers University, New Brunswick, NJ 08903, USA
T. Adye, U. Egede, B. Franek, N. I. Geddes, G. P. Gopal
Rutherford Appleton Laboratory, Chilton, Didcot, Oxon., OX11 0QX, UK
N. Copty, M. V. Purohit, F. X. Yumiceva
University of South Carolina, Columbia, SC 29208, USA
I. Adam, P. L. Anthony, F. Anulli, D. Aston, K. Baird, E. Bloom, A. M. Boyarski, F. Bulos, G. Calderini, M. R. Convery, D. P. Coupal, D. H. Coward, J. Dorfan, M. Doser, W. Dunwoodie, T. Glanzman, G. L. Godfrey, P. Grosso, J. L. Hewett, T. Himel, M. E. Huffer, W. R. Innes, C. P. Jessop, P. Kim, U. Langenegger, D. W. G. S. Leith, S. Luitz, V. Luth, H. L. Lynch, G. Manzin, H. Marsiske, S. Menke, R. Messner, K. C. Moffeit, M. Morii, R. Mount, D. R. Muller, C. P. O’Grady, P. Paolucci, S. Petrak, H. Quinn, B. N. Ratcliff, S. H. Robertson, L. S. Rochester, A. Roodman, T. Schietinger, R. H. Schindler, J. Schwiening, G. Sciolla, V. V. Serbo, A. Snyder, A. Soha, S. M. Spanier, A. Stahl, D. Su, M. K. Sullivan, M. Talby, H. A. Tanaka, J. Va’vra, S. R. Wagner, A. J. R. Weinstein, W. J. Wisniewski, C. C. Young
Stanford Linear Accelerator Center, Stanford, CA 94309, USA
P. R. Burchat, C. H. Cheng, D. Kirkby, T. I. Meyer, C. Roat
Stanford University, Stanford, CA 94305-4060, USA
A. De Silva, R. Henderson
TRIUMF, Vancouver, BC, Canada V6T 2A3
W. Bugg, H. Cohn, E. Hart, A. W. Weidemann
University of Tennessee, Knoxville, TN 37996, USA
T. Benninger, J. M. Izen, I. Kitayama, X. C. Lou, M. Turcotte
University of Texas at Dallas, Richardson, TX 75083, USA
F. Bianchi, M. Bona, B. Di Girolamo, D. Gamba, A. Smol, D. Zanin
Università di Torino, Dipartimento di Fisica Sperimentale and INFN, I-10125 Torino, Italy
L. Bosisio, G. Della Ricca, L. Lanceri, A. Pompili, P. Poropat, M. Prest, E. Vallazza, G. Vuagnin
Università di Trieste, Dipartimento di Fisica and INFN, I-34127 Trieste, Italy
R. S. Panvini
Vanderbilt University, Nashville, TN 37235, USA
C. M. Brown, P. D. Jackson, R. Kowalewski, J. M. Roney
University of Victoria, Victoria, BC, Canada V8W 3P6
H. R. Band, E. Charles, S. Dasu, P. Elmer, J. R. Johnson, J. Nielsen, W. Orejudos, Y. Pan, R. Prepost, I. J. Scott, J. Walsh, S. L. Wu, Z. Yu, H. Zobernig
University of Wisconsin, Madison, WI 53706, USA
1 Introduction
Precise measurements of the charged and neutral meson lifetimes are needed for tests of theoretical models of heavy quark decays. An uncertainty of around 1% will be required to distinguish between models [1, 2] predicting different lifetime hierarchies among the hadrons. The lifetimes are also required for other measurements and they provide a check of our understanding of the detector. The current world averages [3] for the lifetimes are and and for their ratio is .
This paper presents preliminary measurements of the and / lifetimes and their ratio performed with data collected by the BABAR detector at the PEP-II asymmetric Factory. At the , mesons are produced in and pairs. In this analysis, one of the mesons is fully reconstructed in a variety of clean hadronic two-body decay modes to charm and charmonium final states. An inclusive technique is used to reconstruct the decay vertex of the second in an event, and the lifetimes are determined from the distance between the decay vertices of the two mesons. This novel method, developed for use at an asymmetric Factory, deals with event topologies similar to those addressed in the analyses of asymmetries where the time dependence is obtained from the distance between the two vertices. The measurement of lifetimes using this technique is therefore a validation of the analyses. The systematic errors are quite different from previous measurements of the lifetimes and we expect substantial increases in the statistical precision in the future.
The paper is organized as follows. The method used to determine the meson lifetimes is outlined in Section 2. The data sample and the detector components most relevant for this measurement are reviewed in Section 3. The event selection criteria and sample composition are described next in Section 4. The determination of the distance between the decay vertices of the two mesons in a selected event is discussed in Section 5 together with the corresponding resolution function. The fitting procedure used to extract the lifetimes from the neutral and charged meson samples is described in Section 6. Systematic uncertainties are discussed in Section 7. The results are given at the end of the paper.
2 The decay length difference technique
The decays exclusively into pairs of charged or neutral mesons. At the PEP-II asymmetric Factory the decay products are Lorentz boosted ()111The average boost of the center of mass frame is measured on a run-by-run basis using two-prong events [4]. and travel far enough for their flight paths () to be comparable to the experimental resolution (). Since no charged stable particles emerge from the decay point, the production point of the mesons is unknown and the lifetimes have to be determined solely from their decay points. The difference between the decay lengths of the two mesons in an event has been used for that purpose in this analysis.
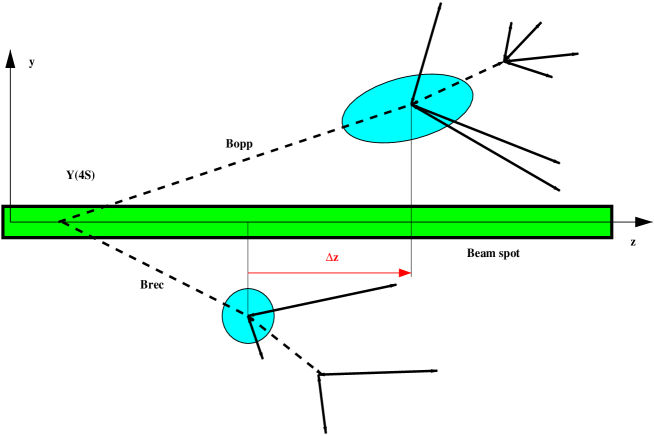
Throughout the paper the signed quantity is used for the projection on the axis (defined below) of the decay length difference between the fully reconstructed meson, thereafter called rec, and the opposed meson, opp. The event topology is sketched in Fig. 1, which is not drawn to scale. In the simplified situation where the mesons are produced exactly at threshold and the moves exactly along the axis, is distributed exponentially with an average of . Complications arise from several effects. The axis of the PEP-II beams is tilted by with respect to the axis, which is defined as parallel to the solenoidal magnetic field, and the energies of the beams fluctuate, giving the momentum a Gaussian distribution with a standard deviation of 6. Furthermore, the energy release in the decay makes the mesons move in the rest frame, resulting in a non-vanishing opening angle (smaller than [5]) between the trajectories of the mesons. The latter effect has the highest impact on the distribution. In practice, all of these effects are small compared to the experimental resolution on .
3 The BABAR detector and data set
The data used in this analysis were collected by the BABAR detector at the PEP-II storage ring in the period from January to June, 2000. The total integrated luminosity of the data set is 7.4 collected near the resonance and 0.9 collected 40 below the resonance. The corresponding number of produced pairs is estimated to be .
The BABAR detector is described elsewhere [4]. For this measurement, the most important subdetectors are the silicon vertex tracker (SVT) and the central drift chamber (DCH), which jointly provide charged particle tracking, and the CsI electromagnetic calorimeter (EMC), from which photons and s are reconstructed. The charged particle transverse momentum () resolution is approximately described by the formula , where is in . The SVT, with a typical single-hit resolution of 10, provides vertex information in both the transverse plane and in . The precision on charged particle momenta, neutral particle energies and spatial coordinates from the tracking and calorimetry leads to resolutions on invariant masses and other kinematical quantities which are adequate for a clean separation of the exclusive hadronic modes as described in Section 4. Impact parameter resolutions in the transverse and longitudinal coordinates are at high momentum, and better than 100 for . The achieved precision on exclusive and inclusive vertices are given in Section 5.
Particle identification is needed for complex decay modes and reconstruction. Leptons and hadrons are identified using a combination of measurements from all BABAR components, including the energy loss using a truncated mean of 40 samples (maximum) in the DCH and 5 samples in the SVT. Electrons and photons are identified in the barrel and forward regions by the EMC. Muons are identified in the instrumented flux return (IFR). In the central polar angle region the Cherenkov ring imaging detector (DIRC) provides a separation better than three standard deviations between pions and kaons over the upper part of the momentum range of decay products (above 700) where the sensitivity vanishes.
4 Event selection
and mesons are reconstructed in the following hadronic modes222Throughout this paper, when a mode is quoted, its charge conjugate is implied.; , , , and , , . All final state particles are reconstructed. The selection criteria are devised to obtain final samples with approximately 90% purity and have been studied using the Monte Carlo simulation. Optimization for background rejection was performed using continuum data and sideband regions that do not contain signal events. The details of the selection of these events are described below.
4.1 Selection criteria
The basic objects used in the selection are charged tracks and neutral electromagnetic clusters. Charged tracks are built out of hits in the SVT and the DCH by a Kalman filter-based tracking algorithm [4]. To be retained, a track must not miss the average beamspot position by more than 1.5 in and 10 in . Most tracks must penetrate halfway radially into the drift chamber (at least 20 hits are required) and have a momentum between 0.1 and 10. The latter restrictions do not apply to soft pions or low momentum tracks from a high multiplicity decay. Electromagnetic clusters in the EMC are photon candidates when they carry more than 30, have a narrow transverse shower profile (the lateral moment defined in Ref. [4]) less than 0.8 and are not matched to a charged track.
The selection procedure begins by enforcing standard criteria [4] on the charged multiplicity, total energy, global event vertex position and event shape which enrich the sample with multihadronic events from decays. A tight requirement on the normalized second Fox-Wolfram moment is applied in all analyses pertaining to this paper to reject jet-like events from the continuum.
The selection then proceeds by building a tree of composite objects (fast decaying particles) from tracks and photon candidates, culminating in a candidate if one exists in the event. Geometrical fits are used to reconstruct decay points and declared successful when the probability is above 0.1%. No goodness of fit requirement is enforced for the kinematic fits used to impose mass constraints.
Neutral pion candidates are formed from pairs of photon candidates with an invariant mass within 20 of the nominal mass and with a minimum energy of 200, except for those used in attempts to reconstruct a . A kinematic fit is performed on the selected candidates imposing the mass constraint.
candidates are reconstructed in the two charged pion decay mode only. Oppositely charged tracks are vertexed using a geometrical fit. The invariant mass, computed at the vertex of the two tracks, has to lie between 462 and 534. The opening angle between the flight direction and the candidate momentum vector must be smaller than 200 . Finally, the transverse flight distance from the event primary vertex is required to be greater than 2.
and meson candidates are combined to search for the following meson decay modes; , , , and , . All kaons and the pions from two body modes are required to have a momentum above 200. This criterion is relaxed to 150 for pions from three or four body final states. Candidates with an invariant mass within three standard deviations of the known mass are retained. The standard deviation computed event by event by the tracking algorithm was used after it was verified that the normalized error distribution (pull) was correctly estimated at the 10-20% level. The reconstruction of is restricted to the dominant resonant mode , . The mass is required to lie within of the known mass and the decay helicity angle in its rest frame, , is required to satisfy . All candidates must have a momentum greater than 1.3 in the frame and have a successful vertex fit. The accepted candidates are mass constrained before they are used in subsequent intermediate state searches. Charged (neutral) mesons are built by combining a with a soft charged (neutral) pion with momentum above 70 (100). Constraining the vertex of the to the beamspot vertical position within 40 improves the resolution on the soft pion direction and hence on , the difference between the and the candidate invariant masses. This procedure has been verified to be bias-free in Monte Carlo events. An acceptable range of 3 standard deviations around the nominal completes the selection. The range limits ( for , for all other modes and for the ) are weighted averages of the standard deviations obtained from two-Gaussian fits to the experimental distributions.
The charmonium meson selection is the same as that described in Ref. [6]. Leptonic decays of charmonium mesons are reconstructed from pairs of oppositely charged tracks considered either as electron or muon pairs. At least one decay product must be positively identified as a lepton. For an electron inside the EMC acceptance, this means a positive electromagnetic shower signature, otherwise that the measured be consistent with the electron hypothesis. For muon pairs, the second track has to be minimum ionizing in the EMC. In the electron case, when both tracks are inside the EMC acceptance and are such that , where is the energy measured in the EMC and is the momentum obtained from the tracking, bremsstrahlung photons found in the EMC are combined with the tracks to reconstruct the electrons prior to radiation. () candidates must have an invariant mass between 2.95 (3.06) and 3.14. The invariant mass of the candidates is required to be within 50 of the known mass, but a less stringent lower limit of 200 is imposed for candidates. decays are also reconstructed by combining oppositely charged pions with mass-constrained candidates and selecting the invariant mass between 3.1 and 4.0 and the mass difference in a window of around the nominal value.
candidates are formed by combining a , , or candidate with a , , , or candidate having a minimum momentum of 500 in the frame. For , the meson from the decay is required to have an energy higher than 300. For , the meson, selected by combining three charged pions, must have an invariant mass between 1.0 and 1.6 and a successful vertex fit.
Kaon identification is used to reject background at the price of some loss in reconstruction efficiency. For most of the modes, a loose kaon selection, or no selection, is enough to reduce the background level to the required level. Tighter kaon identification is mandatory only for modes with high combinatorial background, such as .
Finally, to achieve the required high signal to background ratio, stricter requirements on event shape variables are applied. A selection is performed on the angle, , between two thrust axes, namely the thrust axis computed from the tracks of the meson candidate and the thrust axis of all the other charged tracks and neutral clusters in the event. A flat distribution is expected for meson pairs while continuum events tend to peak at . For the modes, is required to be less than 0.9 for the and channels and less than 0.8 for and . The requirements are 0.8 and 0.7 for the modes and the same two couples of modes. There is no restriction based on thrust for the decays. For the decaying to charged mesons, the requirements are 0.9, 0.8 and 0.7, if the is accompanied by a , a or an . For the decays, is required to be less than 0.9 in the case of the decay and to be less than 0.8 in all other cases. The requirement is 0.9 for the decays to charmonium.
4.2 Sample composition
Signals for each decay mode in the selected sample are isolated by analyzing the two-dimensional distribution of the kinematical variables, and , which have an intuitive meaning in the rest frame. is the difference of the candidate energy and the beam energy. is the mass of a particle with a reconstructed momentum assumed to have the beam energy, as is the case for a true meson. Candidates with and are considered in further analyses. In case an event has several candidates, only the one with the smallest is kept. The and variables are essentially uncorrelated. The resolution on is about 3 and is dominated by the energy spread of the beams, inherent to the collider. The resolution on varies from mode to mode between 12 and 40. For each mode a rectangular signal region is defined by the three standard deviation bands in () and (an interval which depends on the mode).
For each mode, the sample composition was determined by fitting the distribution, for candidates within the signal region in , to the sum of a single Gaussian representing the signal and a background function used by the ARGUS collaboration [7]. The purity of each subsample is computed as the ratio of the area of the Gaussian in the range over the total area in this range. The results are summarized in Table 1. Figure 2 shows the distributions for the summed hadronic and modes with the fits superimposed.
To extract separately the and lifetimes, a thorough understanding of the background shape and composition is necessary. In the signal region, the background receives contributions from continuum, and pairs in various proportions for the different modes. A consistent background shape is found from studies of several samples; namely, on-resonance data events outside the signal region, off-resonance data, and generic and continuum Monte Carlo samples. The contamination of the subsamples by events, and vice versa, is found to be small.
| Decay mode | Number of candidates | Purity (%) |
|---|---|---|
| 55226 | 90 | |
| 37423 | 84 | |
| 20218 | 79 | |
| 53725 | 90 | |
| 27920 | 84 | |
| 19418 | 73 | |
| 16715 | 90 | |
| 152843 | 88 | |
| 44625 | 89 | |
| , | 29417 | 99 |
| Total | 221058 | 86 |
| Total | 226153 | 89 |
(a) (b)
5 Vertex reconstruction and resolution function
To extract the meson lifetimes from the sample, the separate decay vertices have to be identified and the distance between them along the axis, , evaluated. The resolution function for is the most critical ingredient of this analysis as the width of the distribution is due to the combined effect of the lifetime and the detector resolution.
A geometric and kinematic fit of the fully reconstructed is performed and is required to converge. The masses of and resonances are fixed at the nominal values [3]. Furthermore, the vertices of short-living resonances are constrained to be identical to the vertex. Two-Gaussian fits adequately describe the error distributions of the full Monte Carlo simulation used to model the signal events, with standard deviations ranging from 45 to 65 and normalized fluctuations (called pulls in the rest of the paper) around 1.1.
The vertex of the other is determined via an inclusive and iterative procedure applied to all the tracks that are not associated with the . To avoid biases from long-lived particles such as neutral strange particles decaying to two charged prongs (a topology known as a V0 decay), as many V0 decays as possible are reconstructed and subsequently treated as single tracks. A common vertex is then fitted using all tracks including the “pseudotrack” which is obtained from the decay kinematics using the and the beamspot. The procedure is repeated, after removing tracks and V0 decays which result in poor fits, until stability is achieved. The algorithm is highly efficient and successful in minimizing biases due to the secondary charm decays of the . From the weighed means of two-Gaussian fits to Monte Carlo distributions of the residuals, one standard deviation errors of the order of 115 and biases around 25 are obtained. Although still present, the bias due to the charm particle lifetime is kept small.
With both vertices reconstructed, the decay length difference is obtained. The Monte Carlo simulation was used to study the resolution function as a function of two variables, the residual and the pull . Figure 3 presents the distributions for the decay . Two-Gaussian fits successfully describe the Monte Carlo residual and pull distributions. They give a one standard deviation width of and a bias of for the residual. The corresponding values for the pull are and respectively. As expected their widths are dominated by the vertex errors. Tails remain due to charm decays of the . Because it is governed by the vertex, the resolution function shape is the same for all modes and also for neutral and charged mesons. These comparisons are summarized in Table 2.
A common function can be used for all modes. The shape of the resolution function can be fit with several parametrizations. Results for the pull representation (which is used in the likelihood function of the lifetime fit) are summarized in Table 3. It can be seen that a single Gaussian is too simple whereas a two-Gaussian line shape fits adequately. A fair agreement is also obtained with a function of the form , the sum of an unbiased Gaussian and of the convolution of the same Gaussian with a decaying exponential , as can be seen in Fig. 4.
| Parametrization | Parameters | /ndof |
|---|---|---|
| Single Gaussian () | mean 0.273 0.017 | |
| width 1.148 0.015 | 135.3/51 | |
| Gaussian centered at zero plus | 0.643 0.029 | |
| the same Gaussian convoluted with an | 1.012 0.0164 | |
| exponential () | 0.936 0.062 | 62.8/50 |
| Two Gaussians () | 0.808 0.047 | |
| 0.998 0.032 | ||
| 0.204 0.025 | ||
| 1.931 0.143 | ||
| 0.819 0.139 | 40.0/48 |
 |
 |
(a) (b)

In a higher statistics Monte Carlo study, tails become apparent which cannot be reproduced by any of the parametrizations considered above. These “outlier” events in the tail are bound to bias the lifetime measurement if they are not accounted for in the fit. Some are due to long lived strange particles forming a vertex with, e.g., the pseudotrack which is robust enough to survive the iterative vertex finding algorithm. To eliminate outliers, a requirement of a minimum of two real tracks to form the vertex, and is imposed. There remain () signal events in the neutral (charged) lifetime samples after the selection.
The distribution of can be fitted to a Crystal Ball line shape function [8]. The fitted function is denoted . Use of that spectrum with the pull representation of the resolution function provides an elegant way of implementing the lifetime fits as explained in Section 6.
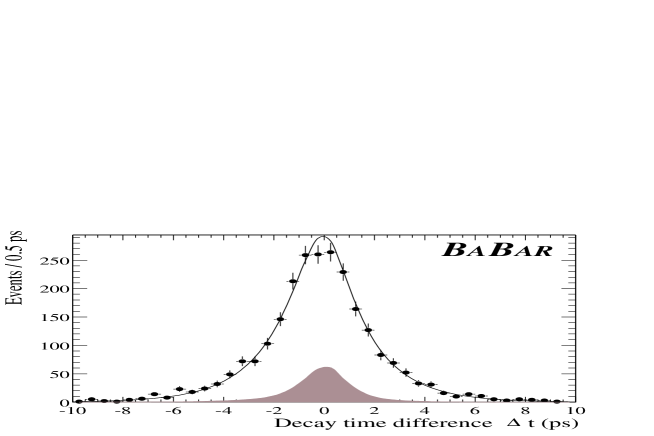
Figure 5 shows the distributions in the data for candidates satisfying . Superimposed are the Monte Carlo simulation predictions using the central values of the lifetimes of the mesons from Ref. [3].
(a) (b)
6 Lifetime fits
The meson lifetimes are extracted from the distributions of the selected events with an unbinned maximum likelihood fit. The measurements performed on each event are represented by three input numbers: , its error, , and . All events which satisfy and have in the signal region are input to the fit. is the probability for an event to come from signal. This probability is obtained from the independent fit of the spectrum using the ARGUS background function and a single Gaussian, as described previously (see Fig. 2). The fit determines the lifetime, , the proportion of outliers, , and the two sets of parameters and which describe the resolution function and the background shape, respectively.
The total probability density function (PDF) for an event , , is the sum of three terms describing the signal, the background and the outliers,
The signal PDF, , is the result of a convolution of the theoretical distribution (two exponential wings) and the pull representation of the resolution function. Three or five resolution parameters, , (depending on which parameterization is chosen for , or ) are used to model the width and non-Gaussian tails. The parameters are free in the lifetime fit, i.e. the values of the parameters of the resolution function are extracted from the data themselves. Reducing the number of parameters modeling , which are unavoidably correlated to , has the effect of improving the statistical precision on the lifetime. The parameterization needs to be flexible enough to reproduce all features of the resolution function, however. The optimal choice depends on the statistics available.
The events in the substituted mass sideband carry most information on the background distribution. A satisfactory description of this distribution is given by a function adding a single Gaussian and two independent exponential tails for the negative and positive ranges. This parameterization uses six free parameters : the width and mean of the Gaussian, the “lifetimes” of the two exponentials and the fraction of events in each of the exponentials. Such a shape is flexible enough to account for the combinatorial background with continuum and contributions.
The outlier PDF, , is a single wide Gaussian with a fixed width of 2500 and a fixed mean of zero.
A full Monte Carlo sample with 5000 events in the channel , was used to compare different parameterizations of the resolution function (see Table 3) which were injected into signal-only lifetime fits. The model of the resolution function gives an unbiased result but the statistical error on the lifetime is increased by more than 50% compared to the case of a fixed . The single Gaussian model is both biased (overestimation of 1.5%) and gives a 30% increase of the statistical error. The is intermediate with a 0.3% overestimation of and the smallest increase of the statistical error (10%). With the present statistics, the model of lead to the smallest overall error. With high statistics, the model will become the optimum method.
To determine the lifetimes, a combined fit to the distributions of the and samples is performed. The two distributions are not combined but are fitted simultaneously, with different sets of parameters (one per charge) to describe the lifetime, the background and the outliers. Since the resolution functions for neutral and charged mesons are compatible, a single set of parameters is used to describe the resolution function for both samples. The result of the fit is
where the errors are statistical only. The lifetime fit results are superimposed upon the and distributions from the reconstruction signal region in Figs. 6 and 7. The lifetime ratio is determined with a similar combined fit, this time to the lifetime and the ratio, which results in a value of
where, again, the error is statistical only. The final results after corrections described in the section on systematic errors are applied, are quoted in section 8.

7 Systematic uncertainties
The systematic errors associated with event selection, measurement and lifetime fitting are discussed in turn.
It has been verified, using the and Monte Carlo samples, that the event selection does not distort the generated distribution so that the lifetime measured from these samples is consistent with the input value. These checks are done with a limited number of simulated events which results in a statistical error on the lifetimes extracted from the fit. This Monte Carlo statistical error of 1.0% for and 0.9% for is taken as a systematic error on the lifetime measurements, labeled as “MC statistics” in Table 4.
The resolution function is a key ingredient of the lifetime measurements. The parameters describing are results of the fit. Since they are correlated with the lifetime, part of the systematic error which comes from their uncertainty is transferred into the statistical error on the lifetime. This effect is estimated to be about 2%. For the systematic error associated with the resolution function modeling, two contributions are quoted. One is the difference between lifetimes obtained with fits using the and parametrizations, a 0.3% effect. The other, at the level of 0.3% as well, is an overestimation of the distortion which may result from the simplifying assumption that a unique resolution function is suitable for all the modes.
The sensitivity of the lifetime measurement to quantities which enter into the determination of the vertex, namely the beam spot position and vertical size, and the momentum vector has been found to be negligible.
The fit accounts for outlier events via a wide Gaussian function with fixed mean and width. Increasing the width from 2500 to 4000 gives a change of 1.1% (1.3%) to the () lifetimes. A change of 1000 in the mean gives an effect smaller by a factor three.
The effects of the detector geometry and alignment have been studied. These are smaller than the effects due to the charm lifetimes, and both parameterizations of the resolution function are flexible enough to accommodate small changes in the detector response. The associated systematic errors are included in those given for the resolution function model.
An overestimation of the uncertainty on the length scale measured along has been obtained in considering the mechanical integrity of the SVT. A systematic error of 1% is assumed. Actual measurements of the length of the beam pipe with tracks are in progress and should considerably reduce this contribution to the error.
Systematic effects due to the boost enter due to the approximation of using the boost for both mesons in an event, as well as measurement error on the boost itself. The effect of the approximation is estimated to be a 0.4% shift and the measurement error from two-prong events is 0.3%. The central values for the lifetimes obtained from the fit are corrected for this shift and a conservative error of 0.4% is assigned. Adding the two contributions in quadrature, the systematic error due to the boost effects is 0.5%.
The systematic error due to the signal probability, , is obtained by propagating the one standard deviation errors on the parameters of the line shape function to the lifetime. A 0.2% uncertainty is obtained.
The uncertainty in modeling the background is estimated by comparing the Monte Carlo distributions for the background in the signal region with the sideband, and also comparing sidebands in data and Monte Carlo simulation. The disagreement is more pronounced for mesons (1.1%) than for mesons (0.4%).
The stability of the results has been checked by splitting the data sample into subsamples of different modes and different times of data taking. A summary of all systematic errors as well as their sum in quadrature is given in Table 4.
| systematic effect | comment | |||
| () | () | |||
| MC statistics | 16 | 14 | 0.014 | |
| Parameterisation of resolution function | 5 | 5 | 0.001 | some included in the |
| statistical error, see text | ||||
| One single resolution function | 5 | 5 | 0.008 | |
| Beamspot, | - | - | - | |
| outliers | 16 | 20 | 0.005 | |
| Geometry and alignment | - | - | - | included in |
| scale | 15 | 16 | - | cancels in ratio |
| Boost | 6 | 6 | - | cancels in ratio |
| Signal probability | 3 | 2 | 0.005 | |
| Background modeling | 5 | 17 | 0.011 | |
| Total in quadrature | 29 | 35 | 0.021 |
8 Summary
The preliminary results for the meson lifetimes are
and for their ratio is
These results are consistent with previous lifetime measurements [3] and competitive with the most precise ones. The statistical errors dominate the uncertainties, while the systematic uncertainty on the lifetime ratio is smaller than the overall error of the world average for this quantity. There are ways to reduce some contributions; however, to reach a 1% total error on the lifetime ratio remains a challenge.
9 Acknowledgments
We are grateful for the contributions of our PEP-II colleagues in achieving the excellent luminosity and machine conditions that have made this work possible. We acknowledge support from the Natural Sciences and Engineering Research Council (Canada), Institute of High Energy Physics (China), Commissariat à l’Energie Atomique and Institut National de Physique Nucléaire et de Physique des Particules (France), Bundesministerium für Bildung und Forschung (Germany), Istituto Nazionale di Fisica Nucleare (Italy), The Research Council of Norway, Ministry of Science and Technology of the Russian Federation, Particle Physics and Astronomy Research Council (United Kingdom), the Department of Energy (US), and the National Science Foundation (US). In addition, individual support has been received from the Swiss National Foundation, the A. P. Sloan Foundation, the Research Corporation, and the Alexander von Humboldt Foundation. The visiting groups wish to thank SLAC for the support and kind hospitality extended to them.
References
- [1] I. I. Bigi, Nuovo Cim. 109 A, 713 (1996).
- [2] M. Neubert and C. T. Sachrajda, Nucl. Phys. B 483, 339 (1997).
- [3] Particle Data Group, D. E. Groom et al., Eur. Phys. Jour. C 15, 1 (2000).
- [4] BABAR Collaboration, B. Aubert et al., “The first year of the BABAR experiment at PEP-II”, BABAR-CONF-00/17, submitted to the XXXth International Conference on High Energy Physics, Osaka, Japan.
- [5] P. F. Harrison and H. R. Quinn, eds., “The BABAR physics book”, SLAC-R-405 (1998), section 11.3.
- [6] BABAR Collaboration, B. Aubert et al., “Exclusive decays to charmonium final states”, BABAR-CONF-00/05, submitted to the XXXth International Conference on High Energy Physics, Osaka, Japan.
- [7] ARGUS collaboration, H. Albrecht et al., Z Phys. C48, 543 (1990).
- [8] T. Skwarnicki, “A Study of the Radiative Cascade Transitions between the Upsilon-Prime and Upsilon Resonances”, DESY F31-86-02 (thesis, unpublished) (1986).