Latest Results of the KARMEN2 Experiment
Abstract
The neutrino experiment KARMEN at the beam stop neutrino source ISIS investigates the oscillation channel in the appearance mode by looking for p ( , e+ ) n reactions. An analysis of data collected from February 1997 through March 2000 with the KARMEN2 experimental setup reveals 11 candidate events in good agreement with the background expectation of events. Hence, there is no indication of an oscillation signal. A maximum likelihood analysis of the data leads to an upper limit (at 90% confidence level) for the mixing angle of at large and eV2/c4 for .
The anomaly in the time spectrum of events induced by and seen in the KARMEN1 data could not be confirmed with the KARMEN2 data.
1 THE EXPERIMENT
The KARMEN experiment is performed at the neutron spallation facility ISIS of the Rutherford Appleton Laboratory. Neutrinos are produced by stopping 800 MeV protons in a massive beam stop target, thereby producing pions. The are absorbed by the target nuclei whereas the decay at rest (DAR). Muon neutrinos therefore emerge from the decay + . The low momentum are also stopped within the massive target and decay via e+ + + . Because of this --decay chain at rest ISIS represents a -source with identical intensities for , and emitted isotropically ( /s per flavor for a proton beam current A).

There is a minor fraction of decaying in flight (DIF) with the following DAR in the target station which again is suppressed by muon capture of the high material of the spallation target. This decay chain leads to a very small contamination of [2], which is further reduced by software cuts.
The energy spectra of the ’s are well defined due to the DAR of both the and (Figure 1a). The ’s from –decay are monoenergetic with E()=29.8 MeV, the continuous energy distributions of and up to MeV can be calculated using the V–A theory. Two parabolic proton pulses of 100 ns base width and a gap of 225 ns are produced with a repetition frequency of 50 Hz. The different lifetimes of pions ( = 26 ns) and muons ( = 2.2 s) allow a clear separation in time of the -burst (Figure 1b) from the following ’s and ’s (Figure 1c). The accelerator’s duty cycle of allows effective suppression of cosmic induced background.
The neutrinos are detected in a rectangular tank filled with 56 t of a liquid scintillator [3]. The central scintillation calorimeter is segmented into 512 optically individual modules. The event position is determined by the hit module and the time difference of the PM signals at each end of this module. Gd2O3 coated paper within the module walls provides efficient detection of thermal neutrons due to the very high capture cross section of the Gd ( n, ) reaction ( barn) in addition to the p ( n, ) d capture. The KARMEN electronics is synchronized to the ISIS proton pulses to an accuracy of better than ns, so that the time structure of the neutrinos can be exploited in full detail.
A massive blockhouse of 7000 t of steel in combination with a system of two layers of active veto counters provides shielding against beam correlated spallation neutron background, suppression of the hadronic component of cosmic radiation as well as reduction of the flux of cosmic muons. In 1996 an additional third veto counter system with a total area of 300 m2 was installed within the 3 m thick roof and the 2–3 m thick walls of the iron shielding [4] (KARMEN2 experimental configuration). By detecting muons which pass through the steel at a distance of less than a meter from the main detector and therefore vetoing the successive energetic neutrons from muon deep inelastic scattering, the main background for the oscillation search could be reduced by a factor of 40 compared to the KARMEN1 setup.
2 THE OSCILLATION SEARCH
The signature for the detection of is a spatially correlated delayed coincidence of positrons from p ( , e+ ) n with energies up to MeV and emission of either of the two neutron capture processes p ( n, ) d with one of MeV or Gd ( n, ) with 3 –quanta on average and a sum energy of MeV. The positrons are expected in a time window of several s after beam–on–target with a 2.2 s exponential decrease due to the decay. The time difference between the e+ and the capture is given by the thermalization, diffusion and capture of neutrons, s.
The raw data investigated for this oscillation search were recorded in the measuring period of February 1997 through March 2000 which corresponds to 7160 C protons on target. A positron candidate is accepted only if there is no previous activity in the central detector nor in the two innermost veto counters up to 24 s. The required cuts in energy and time for the prompt () event are: s, MeV. The cuts on the delayed expected neutron event are as
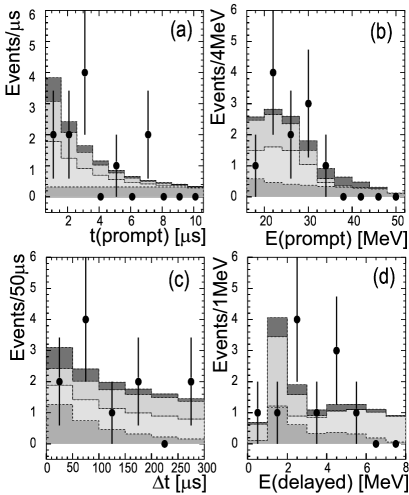
follows: s, MeV and a volume of 1.3 m3 for the spatial coincidence. Applying all cuts, the total background expectation amounts to sequences where the individual background sources are events induced by cosmic muons, 12C ( , e- ) 12Ng.s. sequences, -induced accidental coincidences and (e+,n) sequences from the intrinsic ISIS contamination.
In Table 1 the individual contributions of the above described background sources are summarized.
| background contribution | events |
|---|---|
| (e-,e+) from 12C ( , e- ) 12Ng.s. | 3.90.5 |
| induced random coincidences | 3.50.3 |
| ISIS contamination | 1.70.2 |
| cosmic induced sequences | 3.20.2 |
| total background | 12.30.6 |
| signal for | 2442269 |
The last row shows the expectation of (e+,n) sequences from oscillations assuming maximal mixing and eV2/c4. The background components are determined precisely during the normal measurements: The induced backgrounds are measured with KARMEN in different energy and delayed time windows, the cosmic background is measured with high statistics in the long pre-beam time window. Only the small contribution of the intrinsic source contamination has to be simulated. In addition, the capability of the KARMEN experiment to identify neutrino induced events is constantly monitored by measuring neutrino–nucleus interactions on 12C via neutral and charged current reactions.
Analysing the data results in 11 sequential events which satisfy all conditions (see Figure 2). This number is in good agreement with the total background expectation. Applying a Bayesian renormalisation of the physically allowed region to the experimental result near a boundary (, 11 measured events with background events expected), an upper limit of at 90% CL can be extracted. An identical procedure had been applied to the initial KARMEN2 data, when the evaluation of a potential oscillation signal was based on a pure counting experiment due to the very small statistics of the background [5].
However, with more data and spectral information, a much better evaluation method is a maximum likelihood analysis. Such a likelihood analysis to extract a possible signal from these 11 sequences makes use of the precise spectral knowledge of all background sources and a detailed MC description of the oscillation signature in the detector. The likelihood function defined as
is optimised with respect to the free parameters and . The probability density function is calculated for each of the event sequences from the parameters where and denote the delayed spatial coincidence. The analysis results in a best fit value of oscillation events within the physically allowed range of parameters.
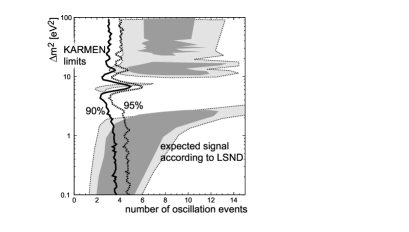
As shown in Figure 3, an upper limit of 3.8 and 3.1 oscillation events for eV2/c4 and eV2/c4, respectively, can be extracted at 90% CL based on a complete frequentist approach as suggested by [6].
The limits at 90% CL and 95% CL can be compared with the number of oscillation events expected from the latest results of the LSND experiment [7]. In Figure 3, the calculated LSND signal strength within the KARMEN detector is shown. For large , even at 95% CL, all of the favored LSND signal range can be excluded by KARMEN2. At lower values of , a small fraction of the signal strength of LSND cannot be ruled out by KARMEN2. Note that at high the band of expected events and the exclusion curve are almost parallel. With decreasing values of the expected signal strength becomes smaller. This may be attributed, in part, to the larger source distance for the LSND experiment ( m compared to m) but may also reflect a smaller signal strength: If the LSND data evaluation yields an oscillation probability which decreases with smaller values of –instead of remaining constant– this would have the same effect.
Assuming maximal mixing (), (,n) sequences from oscillations with large were expected.
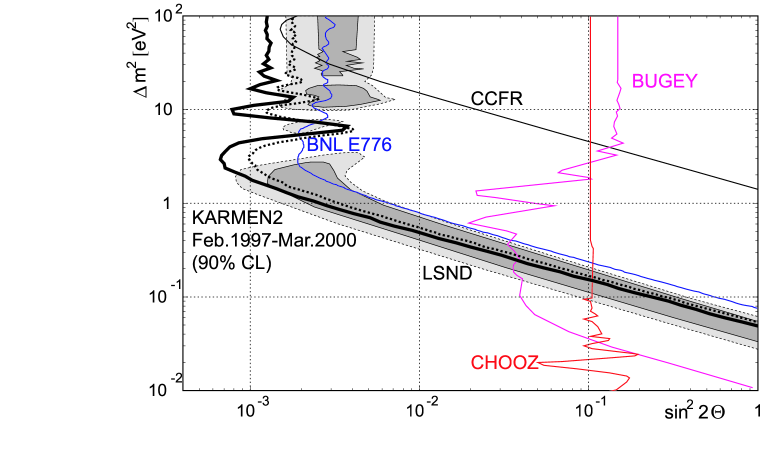
Together with the limit of 3.1 events deduced in the unified frequentist approach, this leads to an upper limit on the mixing amplitude of
for eV2/c4. The corrsponding exclusion curve in (,) is given in Fig. 4. Also shown are limits from other experiments [8, 9, 10, 11] as well as the favored regions from LSND based on a complete re-analysis of the entire 1993-98 data set [7]. Again, at high , KARMEN excludes the region favored by LSND. At low , KARMEN leaves some statistical space, but the reactor experiments at Bugey and Chooz add stringent limits from the disappearance search. Any exclusion curve or favored region is a compactification of a complex statistical information, it reflects only a contour of the twodimensional likelihood functions which have nontrivial properties like multiple side maxima and non-parabolic shapes. Therefore, one needs a quantitative statistical analysis of both LSND and KARMEN based on the detailed event-by-event information as demonstrated in [12] for preliminary data sets to deduce correct statements of compatibility or disagreement in terms of frequentist confidence regions.
Taking the LSND region published first [13] which corresponds to a stronger signal, there is a much stronger disagreement in the experiments’ outcome: The actual 90% CL KARMEN2 limit excludes the complete parameter range favored by the 1993-95 LSND data.
One way of estimating the sensitivity of an experiment is to determine the average limit on the oscillation parameter simulating a large number of experimental outcomes with the actual level of background events, but no oscillation signal. These samples are subsequently analysed with the same maximum likelihood analysis used for the real data set. The actual KARMEN limit is slightly better than its sensitivity of for large and almost identical at lower (see dashed line in Fig. 4). Compared to the earlier results of KARMEN [5], this corresponds to an improvement of the sensitivity by a factor of .
KARMEN will continue to take data for the search until the end of April 2001 with an anticipated sensitivity of for large . Meanwhile, the upcoming BooNE experiment at Fermilab is under construction. Its sensitivity is expected to improve the final KARMEN sensitivity by another factor of 2 [14] in the appearance mode with different systematics than KARMEN and LSND.
3 THE TIME ANOMALY
In the time window of 0.6-10.6 s after beam-on-target, reactions on 12C, 13C and 56Fe induced by and are expected to reflect the 2.2 s life time of the muons decaying in the target superimposed on a flat, cosmic induced background. However, in the KARMEN1 data there was a bump–like distortion of the spectrum at about 3.1–4.1 s after beam-on-target first reported in [15]. Taking the total KARMEN1 data set of so-called ’single prong’ events (unaccompanied energy deposits without delayed coincidences) collected from July 1990 through December 1995, events were observed in excess to the neutrino induced events and the cosmic background. Detailed analyses and special measurements did not lead to the identification of potential background sources(e.g. beam correlated neutrons from the spallation source, electronic effects, detector inefficiencies or after-pulses of the ISIS proton synchrotron) as origin of this excess.
Therefore, a working hypothesis of a particle production was considered to get a consistent description of the origin of these events.
The ansatz consisted of a rare non-SM pion decay mode + where denotes a massive ( MeV), neutral, weakly interacting, unstable particle with decay products detectable via electromagnetic interactions. A possible branching ratio as small as relative to the standard decay + could have explained the observed excess without contradiction from other experiments. In this framework, the X particle would be produced in the ISIS target within the pion decay double pulse structure (see Fig. 1a), then slowly moving ( m/s) towards the KARMEN detector at a mean distance of m. This would result in a specific double pulse structure in time and position within the 3.5 m long scintillation tank. The consistency of this hypothesis was tested by a maximum likelihood analysis of individual event times and locations [16]. The free parameters of the likelihood function were the number of particle signatures and their velocity .
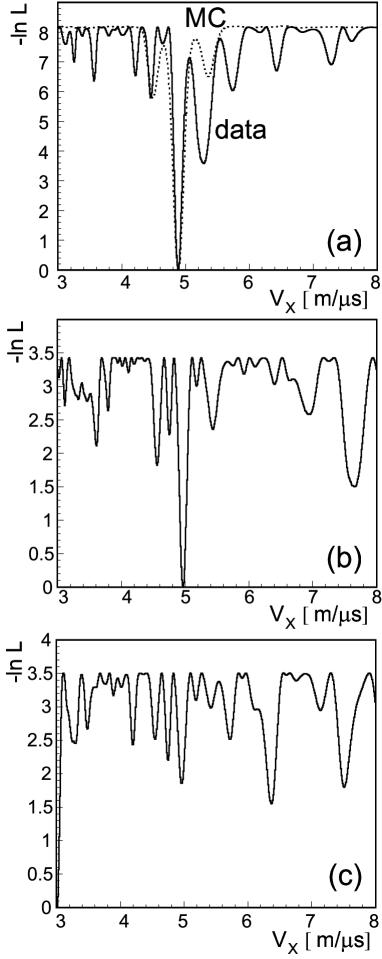
The result of such an analysis of the KARMEN1 data (1990–95), the negative logarithm of the likelihood is shown in Figure 5a) as a function of one of the two free parameters, . A clear minimum at m/s is evident. The characteristic side maxima result from the double pulse structure of pion decays as underlined by Monte Carlo studies with high statistics (MC in Fig. 5a) of particle signals. Hence, the working hypothesis gave a consistent description of the anomaly in the time spectrum with a signal strength of excess events.
One of the major objectives of KARMEN2 has been the investigation of this hypothesis, taking full advantage of the significantly reduced level of cosmic background. An initial KARMEN2 data sample sufficiently large for a detailed maximum likelihood analysis was collected from February 1997 through February 1999. The corresponding maximum likelihood result of these first 2 years is given in Figure 5b) having its minimum at m/s with a signal strength of . Scaling from the KARMEN1 analysis, one would have expected . Though the minimum of the function was not deep enough to form a statistically significant signal by KARMEN2 data alone, the fitted particle velocity and signal strength were in good agreement with the earlier KARMEN1 data, indicating a continuous accumulation of signatures even under modified experimental systematics.
However, an updated analysis of all KARMEN2 data collected so far (February 1997 through March 2000) reveals no distortion of the time spectrum anymore. Despite an increase of pion and consequently neutrino production at the ISIS target by more than 50%, the number of excess events in the time spectrum between 3.1 s and 4.1 s after beam-on-target determined by subtraction of a fitted neutrino signal (exponential decrease with s) and constant background is now . This allows to set an upper limit of at a 90% confidence level. This has to be compared with an expected excess of extrapolated from the KARMEN1 data. In addition to the time spectrum, the twodimensional maximum likelihood analysis shows no significant minimum of the negative logarithmic likelihood function at a velocity near m/s (see Fig. 5c). Fixing the velocity at the above value results in a signal strength of events in contradiction to the value of extrapolated from the KARMEN1 likelihood analysis.
To summarize, the time spectrum of the entire KARMEN2 data after 3 years of data taking is in good agreement with the expectation of neutrino induced events with an exponential shape superimposed on a flat cosmic induced background. There is no distortion in the time spectrum nor any unexplained signal in a detailed maximum likelihood analysis as observed for the KARMEN1 data. As there was no change since 1997 in data taking nor in the reduction and evaluation of the data, the new results of the analysis are due to the increased data amount and statistics only. On the other hand, the clear distortion of the KARMEN1 spectrum remains unchanged and unexplained. While analysing the total KARMEN1+2 data set still yields a significant minimum in at m/s, the working hypothesis of + has to be rejected on the basis of the incompatibility of the ’signal’ strength seen by KARMEN1 and KARMEN2.
KARMEN will continue to take data for another year, mainly to increase the sensitivity of the oscillation search, but also to monitor the time spectrum of single prong events.
References
-
[1]
KARMEN collaboration:
G. Drexlin, K. Eitel, T. Jannakos, M. Kleifges, J. Kleinfeller, C. Oehler, P. Plischke, J. Reichenbacher, M. Steidl, B. Zeitnitz: Institut für Kernphysik, Forschungszentrum Karlsruhe, Institut für experimentelle Kernphysik, Universität Karlsruhe
B.A. Bodmann, E. Finckh, J. Hößl, P. Jünger, W. Kretschmer: Physikalisches Institut, Universität Erlangen-Nürnberg
C. Eichner, R. Maschuw, C. Ruf: Institut für Strahlen- und Kernphysik, Universität Bonn
I.M. Blair, J.A. Edgington: Physics Department, Queen Mary and Westfield College, London
N.E. Booth: Department of Physics, University of Oxford - [2] R.L. Burman et al, Nucl. Instrum. Methods A 368, 416 (1996).
- [3] G. Drexlin et al, Nucl. Instrum. Methods A 289, 490 (1990).
- [4] G. Drexlin et al, Prog. Part. Nucl. Physics 40, 193 (1998).
- [5] K. Eitel and B. Zeitnitz, proceedings of the Neutrino’98 conference, hep-ex/9809007
- [6] G. Feldman and R. Cousins, Phys. Rev. D 57, 3873 (1998)
- [7] G. Mills, these proceedings
- [8] L. Borodovsky et al., Phys. Rev. Lett. 68, 274 (1992).
- [9] A. Romosan et al., Phys. Rev. Lett. 78, 2912 (1997).
- [10] B. Achkar et al, Nucl. Phys. B 434, 503 (1995).
- [11] M. Apollonio et al, Phys. Lett. B 348, 19 (1995).
- [12] K. Eitel, New J. Phys. 2, 1.1 (2000).
- [13] C. Athanassopoulos et al, Phys. Rev. C 54, 2685 (1996).
- [14] A. Bazarko, these proceedings
- [15] B. Armbruster et al, Phys. Lett. B 348, 19 (1995).
- [16] C. Oehler et al, Nucl. Phys. B 85, 101 (2000).