BRIS/HEP/2000–04July 2000
Using 3.9 of data from ep eX interactions recorded using the ZEUS detector in 1997, the proton structure function, F2, has been measured in the range 0.015 GeV2 Q2 0.65 GeV2 and x . The analysis is based on data taken incorporating new detector components. Compared with the previous analysis, these components allow improved background suppression and better control of systematic uncertainties, extending the accessible kinematic region towards lower Q2.
1 Introduction
The measurement of the proton struture function F2 at low Q2 has been used recently by ZEUS [1] to study the transition between photoproduction and deep inelastic scattering. The first measurement by ZEUS [2] using 1995 data has now been followed by a higher precision measurement using dedicated detector components.
A measurement of F2 has been made in the range 0.015 GeV2 Q2 0.65 GeV2 and x , where Q2 is the four-momentum transfer squared and x is the Bjorken scaling variable. The measurement was made using 3.9 pb of data taken using special triggers in 1997 and, compared to the previous result, covers a larger kinematic region with improved accuracy.
2 Analysis
Reconstruction of the scattered positron is performed using dedicated detector compontents: the Beam Pipe Calorimeter (BPC) and the Beam Pipe Tracker (BPT) of the ZEUS detector.
The BPC is a small Tungsten-scintillator sampling calorimeter that detects positrons scattered at angles of 18-32mrad with respect to the positron beam direction. It has an energy resolution of = 0.17.
The BPT consisted of two silicon microstrip detectors. A track is reconstructed as the straight line between a hit on each detector and provides information on the positron scattering angle and impact point on the BPC. This helps eliminate background and reduce the systematic uncertainties.
3 Results
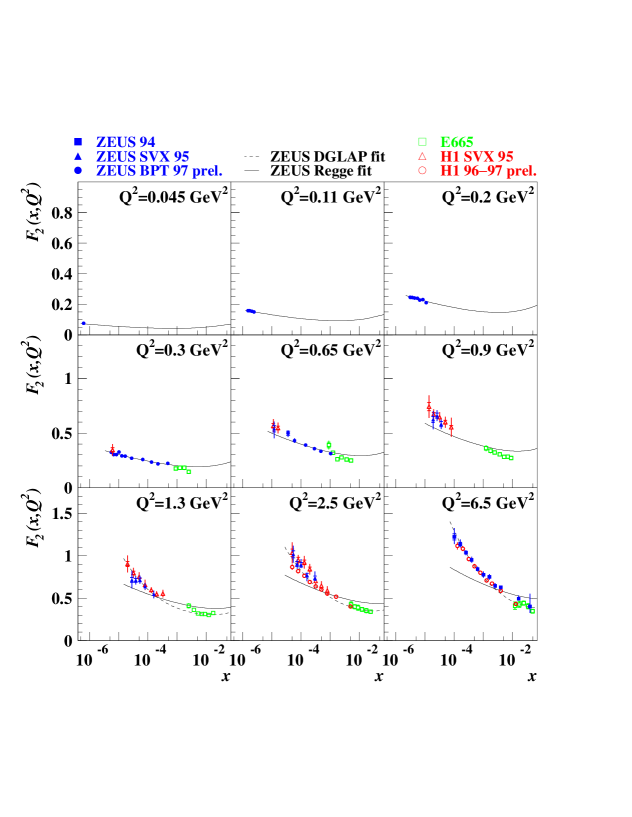
Figure 1 shows F2 as a function of x in bins of Q2. Down to Q21 the data is well described by NLO QCD fits. The steep rise in F2 at low x observed at higher Q2 persists down to the low Q2 region. This rise though, becomes shallower as Q2 decreases into the new region of measuremement. At low values of Q2 the data are well described by Regge theory.
4 Conclusions
The ZEUS collaboration has measured F2 in the region 0.015 GeV2 Q2 0.65 GeV2 and x with high precision. The data can be used to examine the transition between perturbative and non-perturbative QCD.
References
References
- [1] ZEUS Coll., Eur. Phys. C 7, 609 (1999)
- [2] ZEUS Coll., Phys. Lett. B 407, 432 (1997).