Charged particle multiplicity near mid-rapidity in central Au+Au collisions
at 56 and 130 AGeV
Abstract
We present the first measurement of pseudorapidity densities of primary charged particles near mid-rapidity in Au+Au collisions at 56 and 130 AGeV. For the most central collisions, we find the charged particle pseudorapidity density to be at 56 AGeV and at 130 AGeV, values that are higher than any previously observed in nuclear collisions. Compared to proton-antiproton collisions, our data show an increase in the pseudorapidity density per participant by more than 40% at the higher energy.
PACS numbers: 25.75.-q
In June 2000, the Relativistic Heavy-Ion Collider (RHIC) at Brookhaven National Laboratory delivered the first collisions between Au nuclei at the highest center of mass energies achieved in the laboratory to date. In this paper we present data taken with the PHOBOS detector during the first collider run at energies of = 56 and 130 AGeV. The ultimate goal of our work is to understand the behavior of strongly interacting matter at conditions of extreme density and temperature. Quantum chromodynamics (QCD), the fundamental theory of strong interactions, predicts that for sufficiently high energy density a new state of matter will be formed, the so-called quark-gluon plasma (QGP) [1]. The measurements shown here represent the first step toward the development of a full picture of the dynamical evolution of nucleus-nucleus collisions at RHIC energies.
Studying the dependence of charged particle densities on energy and system size provides information on the interplay between hard parton-parton scattering processes, which can be calculated using perturbative QCD, and soft processes, which are treated by phenomenological models that describe the non-perturbative sector of QCD. Predictions for multi-particle production in high-energy heavy-ion collisions, obtained from a variety of models, typically vary by up to a factor of two [2].
In this letter we report data for the most central Au+Au collisions detected in our apparatus. We have determined the energy dependence of the density of primary charged particles emitted near to the beam axis, characterized by the pseudorapidity density , where and is the polar angle from the beam axis. These data provide the first means to constrain models of heavy-ion collisions at RHIC energies. They will allow the extraction of basic information about the initial conditions in these collisions, in particular the energy density, and thus form an essential element for the proper prediction or description of other observables.
The PHOBOS detector employs silicon pad detectors to perform tracking, vertex detection and multiplicity measurements. Details of the setup and the layout of the silicon sensors can be found elsewhere[3, 4]. For the initial running period of the accelerator only a small fraction of the full setup was installed. It included the first 6 layers of the silicon spectrometer (SPEC), part of the two-layer silicon vertex detector (VTX) and one ladder of the large acceptance Octagon multiplicity detector (see Fig. 1). In total, the installed sensors had 20000 readout channels, of which less than 2% were non-functional. The detector setup also included two sets of 16 scintillator counters (“paddle counters”) located at distances of m (PN) and m (PP) from the nominal interaction point along the beam () axis. These counters subtended pseudorapidities between . They served as the primary event trigger and were used for event selection. Two zero-degree calorimeters (ZDCP,ZDCN) at m provided additional information for event selection by measuring the energy deposited by spectator neutrons.
Monte Carlo (MC) simulations of the detector performance were based on the HIJING event generator [5] and the GEANT 3.21 simulation package, folding in the signal response for scintillator counters and silicon sensors.
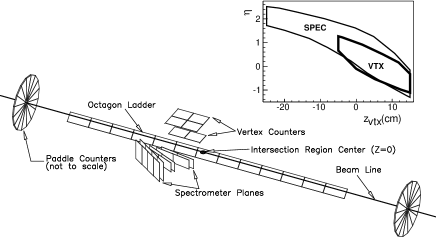
In this analysis, we used the data from the SPEC subdetector to reconstruct tracks and to obtain the position, , of the collision vertex. The SPEC and VTX subdetectors were then used to count the multiplicity of charged particles near . Their acceptance, covering , is shown in the insert in Fig. 1. The strong dependence on allows us to check our understanding of acceptance and backgrounds by testing the stability of our results as a function of .
The readout trigger selected events based on the coincidence of at least one hit in both PP and PN within a time window of 38 ns. This condition selected most collision events as well as various backgrounds. Offline event selection was achieved by requiring the paddle time difference to be less than 8 ns, corresponding to a maximum displacement of roughly cm relative to . Additional rejection of residual background can be achieved by requiring the ZDC time difference to be less than 20 ns. Since the ZDCs only detect spectator neutrons, they are slightly inefficient for the most central events. Thus, we accepted events with good ZDC timing or high multiplicity in the paddles or both. Double beam backgrounds were studied by using experimental runs where the beams did not collide. We found that the overall rate was less than 1% of all events and that there was no background mis-identified as central events, which are characterized by large signals in both paddle counters.
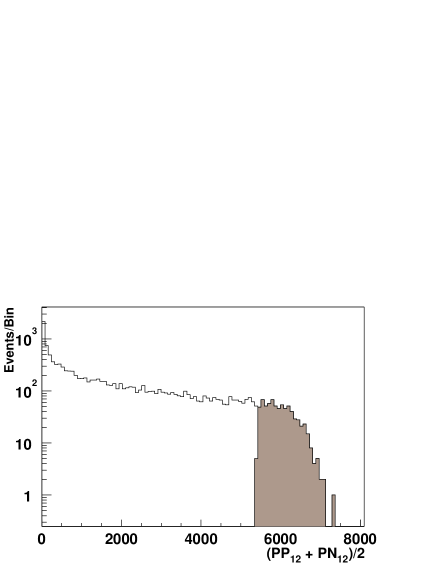
To select the most central events we have used an estimator based on the mean of gain-normalized ADC values in the 16 scintillator counters in PP and PN. Primary charged particles each leave approximately 1.8 MeV in the scintillator. Slow secondary particles that traverse the counters at large angles may deposit larger amounts of energy, and thus mimic a larger multiplicity. To reduce this effect, for each event we discarded the four scintillators in each set of paddle counters with the largest signals. The average of the pulse heights of the remaining 12 scintillators, PP12 and PN12, was then calculated for each set. Finally, we used the paddle mean (PP12 +PN12) as an observable proportional to the number of particles hitting the paddle counters.
Assuming that the number of particles hitting the paddle counters increases monotonically with increasing number of participants, a cut on large paddle mean selects the events with the largest number of participants, in both the data and simulation. This has been confirmed with the ZDCs for our more central events. We observe a good anti-correlation between the paddle mean and the total energy deposited in the ZDCs. For this analysis central events were selected by choosing the 6% of events with the largest paddle mean (see Fig. 2). We obtained a sample of 382 events for AGeV and 724 events for AGeV.
We estimated the average number of participants chosen by the 6% cut using simulations [5]. MC studies showed that up to 10% of the inelastic cross section fails to produce enough particles to satisfy our trigger conditions. We also studied the distribution of after a 6% cut on and vice-versa. This showed the effect of additional fluctuations introduced by slow secondary particles. Considering both of these effects, we estimate that the systematic uncertainty in is 5%. Applying the 6% centrality cut to MC events we deduce that the number of participants in the data is (stat) for 56 AGeV and (stat) for 130 AGeV. The RMS of the distribution of for the MC events is 27 at 56 AGeV and 25 at 130 AGeV.
The analysis proceeded as follows: Using the information from the SPEC sensor planes a road-following tracking algorithm reconstructed straight line tracks passing through at least 4 layers of the detector and having a -probability of better than 1% for a non-vertex constrained straight line fit. MC studies show that in this step the tracking efficiency is better than 90%, with less than 10% ghost tracks. For central events, on average 13 tracks were reconstructed at AGeV and 18 tracks at 130 AGeV.
The position of the primary collision vertex was determined as the point of closest approach for the found tracks. The distribution of collision vertices, which define the beam orbit, was found to be very stable within each data set, while an offset of 0.7 mm between the two beam energies was observed. To optimize the stability of the vertex finding algorithm, which is essential for the multiplicity determination, we performed a second track finding analysis of the data by confining the vertex position to within 3 mm distance to the previously determined beam orbit in the transverse direction and within cm longitudinally. For central events in this region, MC simulations show that the vertex finding algorithm is more than 99% efficient. As a cross-check of the vertex finding procedure we compared the pointing accuracy of the found tracks to the fitted vertex for data and MC and found a most probable value of 1 mm in both cases.
Within the vertex fiducial volume we found a total of 103 central events for the low energy and 151 central events in the high energy data set. For the selected events, the multiplicity of charged particles was determined using the SPEC and VTX subdetectors independently. The measurement was done by counting tracklets, which are two hit combinations in consecutive layers of the SPEC or VTX subdetector consistent with a track originating at the primary vertex. For every hit the coordinates in and were calculated relative to the fitted vertex position, where is the azimuthal angle in radians. Then we determined for each hit in the first layer the closest hit in the second layer. Finally, hit combinations with a distance of in the SPEC subdetector and in the VTX subdetector were retained as tracklets. To obtain a constraint on possible random channel-by-channel inefficiencies in the sensors and readout-chain, we compared the multiplicities of single hits in VTX and SPEC, two-hit tracklets in VTX and SPEC and tracks in SPEC. A detection efficiency of less than 100% would enter in different powers into the different measurements. We find no evidence for inefficiencies beyond the % of dead channels identified in our standard calibration procedure.
MC studies show that the number of tracklets per event near is approximately proportional to the number of primary charged particles per event. Here we define as primary particles all charged hadrons produced in the collision, including the products of strong and electromagnetic decays, but excluding feed-down products from weak decays and hadrons produced in secondary interactions.
The pseudorapidity density of primary charged particles, , was obtained from the observed distribution of tracklets, , by accounting for several factors: The efficiency of tracklet finding, background due to noise hits, secondary and feed-down particles and the acceptance. The correction was done using the following procedure: Events from a standard event generator were propagated through the GEANT simulation of our setup. The simulated data were then processed with the identical reconstruction chain as the real data, including the event selection based on the paddle counter signals. For each simulated event we determined the number of tracklets, , found in the region and the number of primary charged particles in the same pseudorapidity region. We then determined the vertex dependent proportionality factor by calculating as a function of .
We repeated this procedure using both the HIJING and VENUS [6] event generators, which predict multiplicities that differ by a factor 2-3. We also compared obtained for running the event generators at various different energies. For all MC runs, agreed to better than 5%, demonstrating that the tracklet counting procedure provides a robust measure of the primary charged particle pseudorapidity density.
MC studies showed that less than 5% of the particles emitted into the angular acceptance of the SPEC and VTX detectors stop in the material of the beam pipe or the first detector layer. The multiplicities we report are corrected for this missing fraction based on the HIJING momentum distributions.
We further studied the contamination of the tracklet distribution by feed-down products from weak decays of strange particles. Due to the proximity of our detectors to the beamline and the good pointing accuracy in the tracklet reconstruction, the contribution was found to be small (). Again, the multiplicities reported here are corrected based on the HIJING distributions.
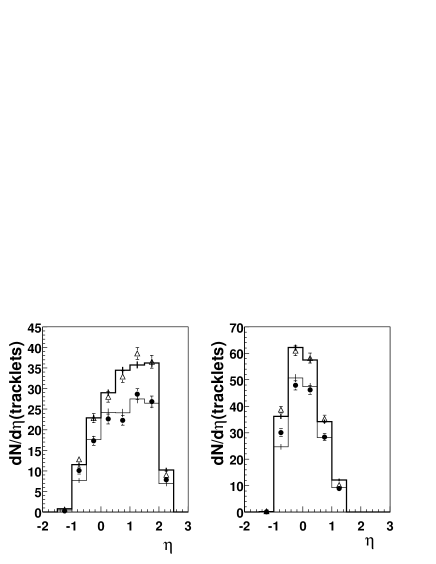
Fig. 3 shows a direct comparison of the SPEC (left) and VTX (right) tracklet distributions for data (symbols) and MC events (solid lines), normalized per event. Scaling factors of 1.15 for AGeV and 0.98 for AGeV were applied to the MC distribution to match the integrals to the data. The shape of the distribution agrees well between simulation and data. SPEC and VTX distributions are both consistent with the same scaling factor. Based on the MC studies, the comparison of data and MC tracklet distributions and the comparison of results from the SPEC and VTX tracklet analysis, we conclude that the proportionality factors can be applied to the measured tracklet distributions with an overall systematic uncertainty of less than 8%.
As the result of this procedure we obtain a primary charged particle density of for AGeV and at AGeV. From the simulation of the paddle counter selection we obtain for the mean number of participating nucleons for AGeV and for AGeV.
Normalizing per participant pair, we deduce and , respectively.
Finally, taking the strong correlation between the systematic errors at the two energies into account, we obtain an increase in the charged particle density per participant by a factor of .
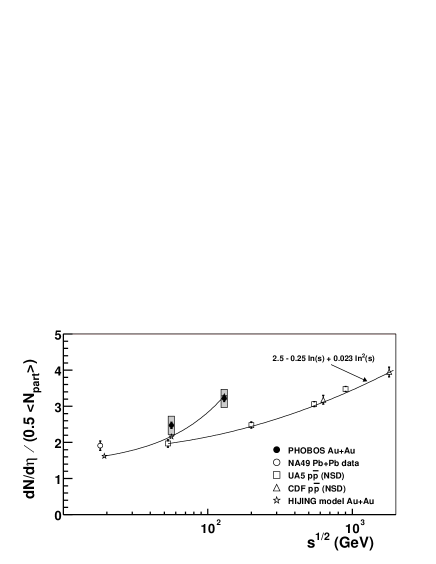
In Fig. 4 we show the normalized yield per participant obtained for Au+Au collisions, proton-antiproton () collisions [7] and central Pb+Pb collisions at the CERN SPS [8]. The value for the Pb+Pb data was obtained by numerically integrating the momentum distributions shown in [8].
Several important features of the data emerge: First, the central Au+Au collisions show a significantly larger charged particle density per participant than for example non-single diffractive (NSD) collisions at comparable energies. This rules out simple superposition models such as the wounded nucleon model [9] and is compatible with predictions of models like HIJING that include particle production via hard-scattering processes.
Secondly, the observed increase by 31% from 56 to 130 AGeV in central Au+Au collisions is significantly steeper than the increase shown by a parametrization (see Fig. 4) for the same energy interval [7]. Finally, comparing our data to those obtained at the CERN SPS for Pb+Pb collisions at AGeV, we find a 70% higher particle density per participant near at AGeV. General arguments (c.f. Bjorken’s estimate [10]) suggest that this increase should correspond to a similar increase in the maximal energy density achieved in the collision.
Acknowledgements: We acknowledge the generous support of the entire RHIC project personnel, C-A and Chemistry Departments at BNL. We thank Fermilab and CERN for help in silicon detector assembly. We thank the MIT School of Science and LNS for financial support. This work was partially supported by US DoE grants DE-AC02-98CH10886, DE-FG02-93ER40802, DE-FC02-94ER40818, DE-FG02-94ER40865, DE-FG02-99ER41099, W-31-109-ENG-38. NSF grants 9603486, 9722606 and 0072204. The Polish groups were partially supported by KBN grant 2 P03B 04916. The NCU group was partially supported by NSC of Taiwan under contract NSC 89-2112-M-008-024.
REFERENCES
- [1] See for example J.P.Blaizot, Nucl. Phys. A661 (1999) 3.
- [2] Proceedings of the 14th Quark Matter conference, Nucl. Phys. A661 (1999)
- [3] B.Back et al., Nucl. Phys. A661 (1999) 690.
- [4] H.Pernegger et al. Nucl. Instrum. Methods. A419 (1998) 549.
- [5] M.Gyulassy and X.N.Wang, Phys. Rev. D44 (1991) 3501. We used HIJING V1.35 (April 1998) with standard parameter settings.
- [6] K.Werner, Phys. Rep. 232 (1993) 87.
- [7] F.Abe et al., Phys. Rev. D41 (1990) 2330.
- [8] J.Bächler et al., Nucl. Phys. A661 (1999) 45.
- [9] A.Białas, B.Bleszyński and W.Czyż, Nucl. Phys. B111 (1976) 461.
- [10] J.D.Bjorken, Phys. Rev. D27 (1983) 140.