Precision Measurements of the -Boson Mass
Abstract
The Standard Model of electroweak interactions has had great success in describing the observed data over the last three decades. The precision of experimental measurements affords tests of the Standard Model at the quantum loop level beyond leading order. Despite this great success it is important to continue confronting experimental measurements with the Standard Model predictions as any deviation would signal new physics. As a fundamental parameter of the Standard Model, the mass of the -boson, , is of particular importance. Aside from being an important test of the SM itself, a precision measurement of can be used to constrain the mass of the Higgs boson, . In this article we review the principal experimental techniques for determining and discuss their combination into a single precision measurement, which is then used to yield constraints on . We conclude by briefly discussing future prospects for precision measurements of the -boson mass.
keywords:
-boson, mass, precision, electroweak, Higgs boson1 INTRODUCTION
The Standard Model of electroweak interactions (SM) theoretically unites the electromagnetic and weak forces of nature. It postulates that these forces are communicated between the constituent particles of nature, quarks and leptons, by carriers known as gauge bosons. In particular, the electromagnetic force is carried by the photon, , while the weak force is mediated by the neutral -boson, , and the charged -bosons, . As such, the -boson is fundamental to the Standard Model. Moreover, the mass of the -boson, , is a parameter of the theory itself, so that a comparison between the experimentally determined and the SM prediction provides an important and fundamental test of the theory. Alternatively, a precision measurement of can be used to estimate, within the framework of the SM, other parameters such as the mass of the Higgs boson, .
1.1 Historical Overview
The weak force was first inferred from observations of nuclear -decay, . In 1935, Fermi postulated the first theory of weak interactions. The form of the interaction was taken to be analogous with that of the electromagnetic interaction, and was characterized by a “coupling” (or strength) parameter — the Fermi constant, . By comparing interaction rates, the strength of the weak force was estimated to be about that of the electromagnetic force. Fermi’s theory very successfully described low energy weak interactions, but violated unitarity at high energy.
In 1967 Glashow, Weinberg and Salam proposed the electroweak gauge theory, which unifies the weak and electromagnetic forces [1]. The theory postulated that the weak force was mediated by massive particles, the - and -bosons, and predicted their masses to be of order GeV 111Here and throughout this article we use units of . The discovery of the -boson in 1983, with a mass of GeV [2], was a great success for the electroweak theory. More rigorous tests of the theory required more precise determinations of the boson masses.
Over the past 15 years a variety of experiments have measured the mass of the -boson with ever improving precision. The first measurements were made at the CERN collider [3] by the UA1 [4] and UA2 [5] experiments. The UA2 experiment made the first measurement of the -boson mass at a relative precision below [6]. The CDF [7] and DØ [8] experiments at the Fermilab TeVatron [9], another collider, were the first to push the precision to the level. More recently, measurements made at the CERN -collider, LEP, by the Aleph [10], Delphi [11], L3 [12], and Opal [13] experiments, have also reached relative precisions of . Combining all these measurements yields a relative precision of and affords stringent tests of the Standard Model. In particular, due to radiative corrections, such precision measurements offer indirect constraints on the mass of the Higgs boson.
1.2 The Electroweak Theory
In the electroweak theory, local gauge invariance is achieved by introducing four massless bosons, an isovector triplet , and an isosinglet, . In analogy to the electromagnetic case, the electroweak Lagrangian can be expressed as a product of currents and coupling parameters:
| (1) |
where and are the weak isospin and hypercharge currents of the physical fermions (i.e. quarks and leptons), respectively, and and are their couplings to the and fields. The weak quantum numbers are related to the electric charge, , by , where is the third component of the weak isospin associated with the group and is the weak hypercharge associated with the group [14]. The fact that the associated bosons are massless implies that the weak field is a long-range (infinite) field, in contradiction with experimental evidence. This short-coming can be addressed by imparting mass to the vector bosons, which is achieved by spontaneously breaking the symmetry with the introduction of an additional field. Demanding that the theory be valid to high energies and remain renormalizable, a necessary condition in order to extract meaningful theoretical predictions, constrains the form of this additional field. The simplest solution introduces a complex scalar isodoublet, the Higgs field, with one component having a vacuum expectation value [15]. The physical boson fields can then be expressed as
| (2) |
for the charged -bosons, , the neutral -boson, , and the photon, , respectively. The weak mixing angle, , relates the and coupling constants to the electromagnetic coupling constant (i.e. the fine structure constant), , by
| (3) |
The gauge boson masses are given by
| (4) |
corresponding to the massive and -bosons and the massless photon, respectively. Equations 3 and 4 yield the following relationship, .
At low energies, the electroweak theory is equivalent to the Fermi theory of weak interactions. Comparing the electroweak Lagrangian in Equation 1 to Fermi’s expression for the weak interaction yields the following equality, . This can be rewritten as
| (5) |
relating the mass of the -boson, the mass of the -boson, the fine structure constant and the Fermi constant, so that a measure of three yields a prediction of the fourth. To obtain theoretical predictions of an precision comparable to that of the experimental determinations of these parameters, radiative corrections must be included. These corrections can be incorporated by rewriting Equation 5 as:
| (6) |
where the effects of the radiative corrections are included in the additional term, . The corrections can be separated into three main pieces,
| (7) |
which include the running of the fine structure constant, , a quadratic dependence on the top quark mass, , and a logarithmic dependence on the mass of the Higgs boson, [16]. This last dependence is a unique consequence of the non-Abelian gauge structure of the electroweak theory, which allows interactions among the gauge bosons themselves. It is because of these radiative corrections that precision measurements of , , and when compared with theoretical calculations, can yield constraints on and [17].
2 MEASUREMENTS OF AT COLLIDERS
2.1 Measurement Techniques
2.1.1 -BOSON PRODUCTION
There have been two colliders with sufficient center-of-mass energy () to produce -bosons, the at CERN (=630 GeV) and the Tevatron at Fermilab (=1.8 TeV). Figure 1 shows the most important subprocesses for -boson production in collisions. At these center-of-mass energies, the dominant subprocess is . -bosons, which form an essential control sample, are produced via analogous processes.


The -boson mass measurements from these colliders all make use of the and decay channels. Electrons and muons222Here and throughout this article charge conjugation is implied. are easy to trigger on and their momenta can be measured very precisely. Moreover, and -bosons are the dominant source of isolated, high- electrons and muons in collisions. Therefore, samples of and -decays involving electrons and muons can be identified with very little background. Purely hadronic decays of the -boson are swamped by QCD background. Decays involving leptons are difficult to identify because the leptons decay before they enter the detector.
The cross sections for and production in collisions are large, pb at =630 GeV [18] and 2.3 nb at =1.8 TeV [19] for -bosons, where is the leptonic branching fraction. For -bosons the corresponding values are about 10 times smaller.
In the following, we refer to a coordinate system which has its origin at the average -collision point. The -axis is defined by the proton beam. The -axis points up. The -axis points along the horizontal. Since the parton center-of-mass frame is boosted along the beam direction, momentum components transverse to the beam are especially important. They are are denoted by a subscript T. The beams are unpolarized so that there is an inherent azimuthal symmetry. Thus it is often convenient to work in a cylindrical coordinate system in which is the angle with the -axis in the - plane. The longitudinal phase space is most conveniently expressed in terms of the pseudo-rapidity, , which is related to the polar angle .
The detectors have approximate azimuthal and forward-backward symmetry. They are constructed to cover as large a region in pseudo-rapidity as possible. From inside out, they typically consist of several sub-detectors: a tracking system to measure the trajectories of charged particles; a calorimeter to measure the energy of electrons, photons, and hadrons; and a muon detection system. The tracking system may be located in a magnetic field to determine the momentum of charged particles from the curvature of their trajectories.
2.1.2 EVENT CHARACTERISTICS
The detectors register the charged lepton from the decay of the -boson, while the neutrino escapes without detection. The initial proton and antiproton break up in the collision and the fragments hadronize, contributing additional particles to the event. The hadronization of final-state quarks or gluons also contributes particles, which may form jets if the initial parton had sufficient transverse momentum. We refer to all particles, except the -boson and its decay products, as the underlying event. Some of the particles of the underlying event escape through the beam pipe and are not detected at all. These particles may carry a substantial momentum component along the beam axis, but they carry little momentum transverse to the beam.
The transverse momenta of all final-state particles must add to zero, because the initial momentum is zero and momentum is conserved. Since the undetected neutrino carries away substantial momentum, the transverse momenta of all observed final-state particles do not add to zero. The apparent transverse momentum imbalance is called “missing ”.
The particles of the underlying event that fall within the detector acceptance cannot all be detected individually. The detector measures the sum of the energy of all particles incident on one calorimeter segment. The quantity
| (8) |
gives an approximate measurement of the total transverse momentum of all underlying event particles. The sum runs over all calorimeter cells, except those assigned to the charged lepton. is the energy in cell . The unit vector forms a right angle with the beam axis and points from the beam to cell .
Thus, the basic observables are the momentum of the charged lepton (, = or ) and the sum of the transverse momenta of the particles in the underlying event () which we call the recoil momentum. From these, the transverse momenta of the -boson () and the neutrino () can be inferred. A high- charged lepton and large missing form the characteristic signature of -boson decay events. -decay events are characterized by two charged leptons with high . There are no high- neutrinos in such -decays and therefore no significant missing is expected.
2.1.3 MASS MEASUREMENT METHOD
It is not possible to reconstruct the invariant mass of the -boson because there is no measurement of the momentum component of the neutrino along the beam axis. In addition, the -bosons are neither produced at rest nor are they the only particles produced in the collisions. Therefore, a precision measurement of the -boson mass using -bosons produced in collisions poses a particular challenge.
The most precise measurements of the mass of the -boson are based on the transverse mass of the charged lepton-neutrino pair, defined as
| (9) |
The advantage of the transverse mass is its invariance under boosts along the beam axis. Boosts transverse to the beam axis only give rise to corrections of order . On the other hand, the transverse mass depends on the measurement of the recoil momentum and all the associated systematic effects.
An alternative method to determine uses the spectrum of the lepton. This has the advantage of being insensitive to . However, it is affected by the boost of the -boson transverse to the beam axis to order and is therefore much more sensitive to systematic effects associated with the production of the -bosons.
In principle, the charged lepton momentum or the transverse momentum of the neutrino can also be used to measure the -boson mass. However the former is sensitive to boosts in all directions and the latter suffers from poor resolution. These variables serve mainly as cross checks.
It is not possible to describe the spectra of the variables mentioned above analytically. They have to be calculated numerically using a Monte Carlo model that takes into account the mechanisms for production and decay of -bosons, and detector effects.
2.1.4 BACKGROUNDS
The backgrounds to the signal are (1-2%), hadronic backgrounds (1% for , 1% for ), (1% for , 4% for ), and cosmic rays (1%). Hadronic backgrounds arise hadrons, that fake the charged lepton signature. decays can enter the sample if one of the leptons escapes detection. The quoted percentages give the approximate residual fractions of background events in the final samples. The precise background contamination depends on the details of the event selection and the detector. They have to be taken into account in the measurement to avoid biasing the result. The normalization and shapes of the background spectra are determined from control data samples and detailed Monte Carlo simulations.
2.1.5 EVENT SELECTION
The event selection consists of the identification of the charged lepton and a set of kinematic and topological cuts. The selection criteria have to achieve two competing goals: to reject backgrounds efficiently and to minimize any biases to the selected event sample. Kinematic cuts, requiring the momentum of the charged lepton and missing above a threshold (typically 25 GeV), are easy to simulate and reduce backgrounds significantly. -bosons with very high transverse momenta do not add to the statistical significance of the mass measurement, because their transverse mass and lepton spectra are very broad and carry little mass information. In addition, their recoil response is difficult to simulate and they are subject to higher background contamination. Thus, such events are usually eliminated from the sample by requiring that the -boson is below some threshold and/or that there are no high- jets in the events.
An electron is typically identified as an energy deposit in the calorimeter, consistent in shape with an electromagnetic shower, and a track that points to it. Since these electrons are highly relativistic, their momenta can be equated to the energy measured in the calorimeter. A muon is typically identified as a track stub in the muon detection system that matches a track in the tracking system and energy deposits in the calorimeter, small enough to be consistent with the passage of a minimum-ionizing particle. These criteria reduce contamination from hadronic backgrounds. However, both criteria inherently require the lepton to be isolated from other activity in the event. This biases the selection towards event topologies in which the charged lepton is emitted along the direction of motion of the -boson. In such events, the probability is smaller that the lepton overlaps with a recoil particle. Since the boost of the -boson increases the lepton in the lab frame, these events tend to have harder charged leptons and softer neutrinos. This bias does not affect the transverse mass spectrum significantly, but it must be understood to predict the spectra of the charged leptons and the neutrinos correctly.
Specific cuts are required to reject events due to an accidental coincidence between a cosmic ray traversing the detector and a beam crossing.
2.1.6 MONTE CARLO MODEL
In this section a generic description of the Monte Carlo models is given. The sections below, describing the individual measurements, highlight significant experiment specific deviations. To keep statistical fluctuations in the Monte Carlo simulation negligible, many millions of -decay events have to be generated. To simulate such large event samples, parameterized Monte Carlo algorithms for -boson production and decay, and detector modeling were developed specifically for the -mass measurements.
First, the -bosons are generated. Their distribution is determined theoretically from QCD-based calculations, empirically from the observed distribution of -bosons, or by a combination of both. The rapidity distribution of the generated -bosons depends on the momentum distribution of the partons inside the proton. To determine it, a specific set of parton distribution functions must be chosen. The mass distribution of the generated -bosons is a relativistic Breit-Wigner curve with peak at the hypothesized value of the -boson mass and -dependent width, given by the Standard Model expectation. This mass spectrum is skewed towards lower mass values due to the momentum distribution of the partons inside the proton.
Next, the -bosons are allowed to decay. At lowest order, the angular distribution of the charged leptons is , where is the scattering angle of the charged lepton in the rest frame of the -boson, the charge of the lepton, and the helicity of the -boson. In most events the initial quark comes from the proton and equals . In the much less likely case that the initial antiquark comes from the proton equals . Higher-order QCD processes modify the angular distribution of the leptons. Radiative decays, in which , modify the momentum spectrum of the leptons. The Monte Carlo models either include these effects or corrections are applied to the results.
The decay leads to events, that are topologically indistinguishable from . These can be calculated precisely in the framework of the Standard Model and are typically included in the Monte Carlo model.
Finally, the Monte Carlo model must account for detector effects. The simulation has now generated the “true” momenta of the -boson (and thus the recoil momentum) and the charged lepton in the event. These are modified to account for experimental resolutions, biases, and efficiencies. Adding random Gaussian uncertainties to the observables simulates resolution effects. The widths of these Gaussian distributions are parameterized in detector-specific ways. Other effects accounted for include the response of the detector to the charged lepton and to the underlying event. Also modeled are the imperfect separation of energy deposits between lepton and underlying event, which leads to biases in lepton and recoil momentum measurements, and selection efficiencies that depend on kinematics or topology of the events.
Events due to the process , constitute an extremely important control sample to determine these effects. Comparing the observed peak to the known -boson mass calibrates the energy or momentum response to charged leptons. The observed width of the peak measures the energy or momentum resolution for charged leptons. The -boson can be measured directly using the charged leptons from its decay and indirectly from the recoil momentum. By comparing both determinations, the events also serve to calibrate the recoil momentum response of the detector relative to the charged lepton response.
2.1.7 MASS MEASUREMENT
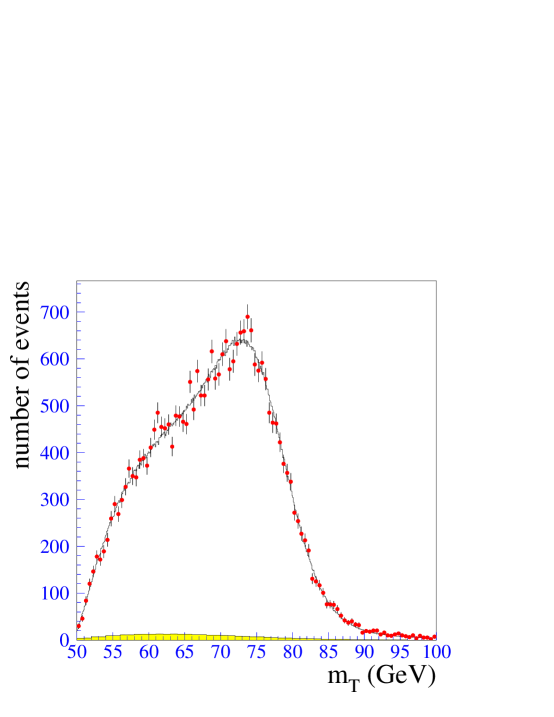
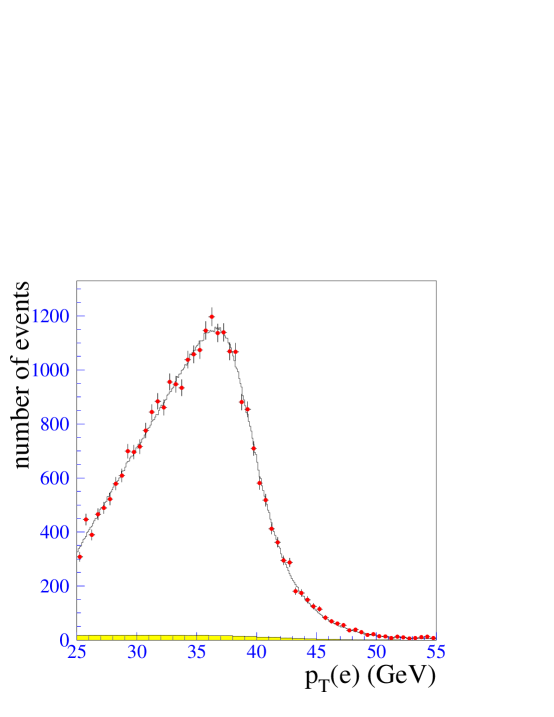
The Monte Carlo model predicts the shape of the transverse mass and the lepton spectra from decays as a function of the hypothesized value of the -boson mass. These are added to the estimated background spectra and normalized to obtain probability density functions for a maximum likelihood fit to the spectra from the collider data. The statistical uncertainty in the fit to the spectrum is typically 11 GeV/(number of events)1/2.
Figures 3 and 3 show representative spectra of transverse mass and lepton . These spectra were measured by the DØ experiment. The points indicate the collider data, the line indicates the Monte Carlo prediction that agrees best with the data, and the shaded region indicates the estimated background contribution.
2.1.8 SYSTEMATIC UNCERTAINTIES
All inputs of the Monte Carlo model contribute to the systematic uncertainty of the measurement. Each such contribution is estimated by varying the input within its 68% confidence interval to determine the resulting change in the measured -boson mass. The total systematic uncertainty is the sum in quadrature of all such contributions. Most of the model parameters are constrained by control data samples, most notably by the samples. In most cases the precision with which these parameters can be determined is limited by the size of the control samples, so that these uncertainties are really statistical in nature. This means that they can be quantified in a well-defined way. There are some cases in which no rigorous confidence interval can be defined, as is usually more typical of systematic uncertainties.
The following paragraphs elaborate on the most important categories of systematic uncertainties. The values quoted for each uncertainty are typical of the measurements from the Tevatron using a fit to the spectrum from a data sample of about 100 pb-1.
- Lepton energy/momentum scale:
-
(70-85 MeV) This is the most important systematic effect. Since all detector responses are calibrated against the charged leptons using the sample, the measured mass simply scales with the lepton scale. It can be set in two ways.
One method is to calibrate the lepton scale so that the and mass peaks (Fig. 4) agree with the known -boson mass [21]. This has the advantage that the uncertainty is dominated by statistical fluctuations in the sample, 3 GeV/(number of events)1/2, and little extrapolation is needed to the energies of leptons from -decays. Uncertainties in the extrapolation can be limited by using other resonances, such as or . If the scale calibration of the charged leptons is tied to the -boson mass, the measured quantity is really the ratio of the and -boson masses, rather than the -boson mass. Given that the -boson mass is known so precisely, the two quantities are of course de facto equivalent.
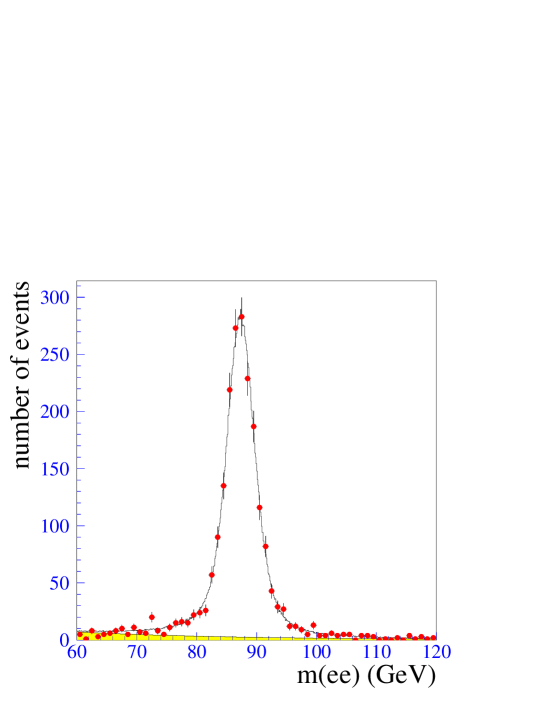
Figure 4: Mass spectrum from decays measured by DØ [20]. Detectors with a magnetic tracking system can alternatively calibrate the momentum measurement for charged tracks, using for example decays (Fig. 5), and then extrapolate to the momentum of leptons from -decays. The calorimeter must then be calibrated against the track momentum using the ratios of energy and momentum () measured for electrons from -decays. The advantage of the latter method lies in the higher precision of the track momentum calibration. Its disadvantage are the systematic effects associated with the extrapolation to higher momenta and the effects of radiation on the spectrum.
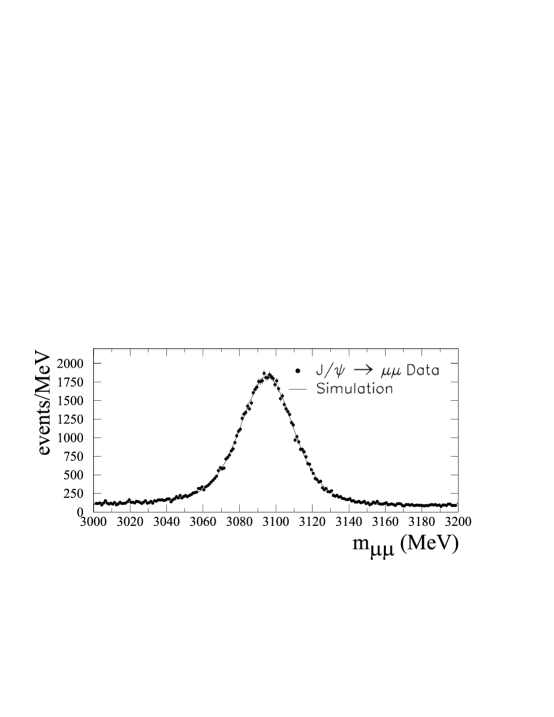
Figure 5: Mass spectrum from decays measured by CDF [22]. - Lepton energy/momentum resolution:
-
(20-25 MeV) The electron energy resolution can be modeled as , where is the electron energy, the sampling term and the constant term. The value of is taken from beam tests and is chosen so that the width of the peak predicted by the Monte Carlo model agrees with the peak from collider data. For muons, the transverse momentum resolution is of the form , where is the transverse momentum of the muon and a constant chosen to match the widths of the peaks from the Monte Carlo model and the collider data.
- Recoil model:
-
(30-40 MeV) This uncertainty arises from the parameters describing the response and resolution of the detector to the underlying event. These are determined from -decays and to a lesser extent from -decays.
- Lepton removal:
-
( 15 MeV) This describes uncertainties in the corrections to the recoil momentum for the imperfect separation of energy deposits between the charged lepton and underlying event. Some particles from the underlying event inevitably overlap with the charged lepton in the calorimeter. Their energies are not included in the calculation of . The correction is equal to the average energy deposited by the underlying event in an appropriately sized calorimeter segment in the data sample.
- Proton structure:
-
(10-20 MeV) This uncertainty characterizes the variations in the result between different choices of parton distribution functions. While relatively small, this uncertainty is completely correlated for all measurements at colliders. For any given set of parton distribution functions, the variation in the measured -boson mass is strongly correlated with the variation in the predicted forward-backward charge asymmetry in [22]. Recently, increasingly precise measurements of this asymmetry by the CDF collaboration [23, 24] have helped constrain the parton distribution functions (e.g. [25, 26]) and reduce the resulting uncertainty in the -boson mass measurement. The agreement of recent parton distribution functions with the measured asymmetry is shown in Fig. 6. Since no complete error matrices are available for parton distribution functions, this uncertainty cannot be evaluated in a statistically rigorous fashion.
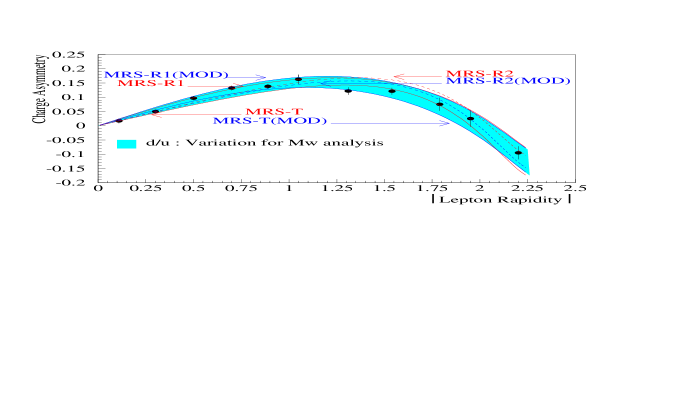
Figure 6: Charge asymmetry in measured by CDF [24], compared to predictions of different parton distribution functions. - spectrum:
-
( 10 MeV) The shape of the distribution can be constrained by theoretical calculations in conjunction with the observed distribution. For low , the spectrum cannot be calculated perturbatively. One approach [27, 28] uses the Collins-Soper-Sterman resummation formalism [29, 30] which contains universal empirical parameters. These parameters can be constrained by requiring the calculation to agree with the observed spectrum. Another, essentially equivalent, approach is to use the observed spectrum directly and convert it to a prediction for the spectrum using the ratio of the calculated and spectra. The precision of both approaches is limited by statistical fluctuations in the data sample. The measured spectrum does not provide a very stringent constraint because its shape at low is dominated by the recoil response of the detector. The spectrum, on the other hand, can be measured independently of the recoil response using the two charged leptons from the decay of the .
- Higher-order corrections:
- Backgrounds:
-
(5-25 MeV) The hadronic background dominates this uncertainty for the channel. Normalization and shape are determined from control data samples. The background dominates the channel. Uncertainties in the tracking efficiency at high and in the parton distribution functions give rise to this uncertainty.
2.2 Individual Measurements
2.2.1 UA2 EXPERIMENT
The UA2 collaboration published the first measurement of the -boson mass with a precision below 1% [6]. This was superceded by an improved result [34] based on 13 pb-1 of data taken in 1988-1990 at the CERN collider at =630 GeV.
The UA2 detector [5] consists of a calorimeter which covers the pseudo-rapidity range . It consists of lead and iron absorber plates interspersed with scintillators and wavelength shifter readout. The electromagnetic section is 17-24 radiation lengths deep and segmented into elements covering 15∘ in azimuth and approximately 0.2 units in pseudo-rapidity. The electron energy resolution is . The hadronic section is four interaction lengths deep. Inside the calorimeter are nested cylindrical tracking detectors. From inside out, they are: a drift chamber with arrays of silicon pad counters on either side, a transition radiation detector, and a scintillating fiber detector. The detector has no magnetic field.
The -boson mass measurement uses the and decay channels. The selection for the -event sample requires an electron in the central calorimeter, 20 GeV, 20 GeV, GeV, and GeV. The Monte Carlo model calculates the -boson rapidity from HRMSB structure functions [35]. The spectrum of is taken from a calculation [28], modified by an empirical distortion function. The distortion function is determined by comparing the spectrum of predicted by the same calculation with the observed distribution. The recoil response model has two parameters: resolution (dependent on the total energy measured in the event), and offset (dependent on ). Both were tuned using the sample and requiring that the mean predicted by the model agrees with the data.
Two samples are used. Sample 1 requires two central electrons, which must be inside the fiducial volume of the calorimeter within . Sample 2 requires one central electron and one electron outside the central acceptance region. The energy of the “outside” electron is rescaled so that all transverse momentum components along the outer bisector of the two electron directions add to zero.
A fit to the transverse mass spectrum gives GeV333Whenever two uncertainties are given, the first is due to statistical fluctuation, the second to systematic effects.. The mass is measured to be GeV using both samples. In all cases, the systematic uncertainties are dominated by the electron energy scale calibration. In the ratio the energy scale and other systematic uncertainties partially cancel. UA2 finds =0.88130.00360.0019. Using the current mass of 91.1870.002 GeV [21] gives 444Updated relative to original publication. GeV.
2.2.2 CDF EXPERIMENT
The CDF collaboration has performed measurements of the -boson mass using data sets from three running periods of the Fermilab Tevatron: 1988/89 [36], 1992/93 [22], and 1994-96 [37]. A publication of the results from the 1994-96 data is in preparation.
The CDF detector [7, 38] is a multipurpose magnetic spectrometer. Tracking detectors are surrounded by a solenoid, that provides an axial magnetic field of 1.4 T. The vertex time-projection chamber measures the position of the -collision point along the -axis with 1 mm resolution. The central tracking chamber has 84 layers of wires and covers . The transverse momentum resolution is .
The central calorimeter covers . The electromagnetic section consists of lead plates interleaved with scintillator. Including chamber wall and solenoid, it is 19 radiation lengths deep and segmented into projective towers covering =150.1. The electron energy resolution is . Proportional chambers after 6 radiation lengths measure the shower centroid position to 3 mm. The hadron calorimeter is made of iron-scintillator shower counters. Outside the central region () the calorimeter is made of gas proportional chambers with cathode pad readout.
Muon chambers are located 3.5 m from the beam behind 5 nuclear absorption lengths and cover .
CDF use both the and channels. Events are selected with GeV and GeV. There must be no high- tracks or energetic clusters in the calorimeter in addition to the charged lepton. For the 1992/93 data sample, GeV is required.
The muon momentum scale is based on a calibration of the tracking system to the mass. The electron energy scale is set using for electrons from -decays. The calibration is checked using the mass from decays, 91.120.52 GeV (1988/89) and GeV (1992/93), using the same calibration as for events.
For the analysis of the 1994-96 data, the electron energy scale determined by the technique results in a -mass peak from decays 3.9 standard deviations below the known mass. Thus this technique is not used to determine the mass. Instead, the muon momentum and electron energy scales are calibrated using the observed -mass peaks.
For the analysis of the 1988/89 data, the Monte Carlo model uses MRS-B parton distribution functions [39] as the nominal choice. The transverse momentum distribution of the -bosons is obtained from the observed distribution by an unfolding procedure. The results from the fits to the spectra in both decay channels are listed in Table 1. Both combined give GeV.
For the analysis of the 1992/93 data, parton distribution functions are restricted to those consistent with the measured charge asymmetry in decays [23]. The Monte Carlo model uses MRSD’ [40] as the nominal choice. The transverse momentum distribution of the -bosons is obtained from the observed distribution, corrected for electron resolution and scaled so that the spectrum of the component of perpendicular to the direction of the charged lepton agrees with the data. The underlying event model uses a lookup table of versus generated , built from the event sample. The results from the fits to the spectra in both decay channels are listed in Table 1. They combine to GeV.
For the analysis of the 1994/95 data, MRS-R2 [41] parton distribution functions are used. The spectrum is derived from the observed spectrum, corrected based on a theoretical calculation of the ratio of the and spectra [27, 28]. The parameterized recoil model is tuned to and data. The results from the fits to the spectra in both decay channels are listed in Table 1. Their combined value is GeV.
All CDF measurements combined give GeV.
2.2.3 DØ EXPERIMENT
The DØ collaboration has published three measurements of the -boson mass using the channel. Two measurements, using data from 1992/93 [42] and 1994-96 [20], use electrons in the central calorimeter. The third uses data with the electron in the end calorimeters [43].
The DØ detector [8] is based on a hermetic uranium-liquid argon sampling calorimeter, which encloses a non-magnetic tracking system and is surrounded by a muon spectrometer.
The tracking system consists of nested cylindrical sub-detectors: a vertex drift chamber, a transition radiation detector, and a central drift chamber, covering the pseudo-rapidity region . Forward drift chambers on either side extend the tracking coverage to . The chambers provide measurements of direction and energy loss of charged particles.
The calorimeter is housed in three cryostats. The central calorimeter (CC) covers and the two end calorimeters (EC) cover . The electromagnetic section is 21 radiation lengths deep and segmented radially into four layers and laterally into towers covering =0.10.1. It measures the energy of electromagnetic showers with a resolution of and the shower centroid position with a resolution of 2.5 mm in azimuthal direction. The hadron calorimeter is 7-9 nuclear interaction lengths deep and provides hermetic coverage without projective cracks.
The event selection for -decay events requires GeV, GeV, and GeV.
The -boson and rapidity spectra are determined by a theoretical calculation [27], constrained against the observed spectrum, and the MRSA’ parton distribution functions [25] for the 1992/93 data, and the MRST parton distribution functions [44] for the 1994-96 data. The electron energy scale calibration is mainly based on the observed peak. The energy spread of electrons from -decays, and signals from and decays limit nonlinearities. Electron resolution and the recoil model parameters are determined from the data.
Based on the fit to the spectrum from the 1992/93 data, the DØ collaboration measures555Updated uncertainties [20] relative to original publication. GeV. Based on the 1994-96 data, the DØ collaboration measures the -boson mass using the , , and spectra for electrons in CC and EC. Using the complete covariance matrix, these results are combined to GeV with for five degrees of freedom. By increasing the acceptance for electrons to pseudo-rapidity between 2.5 and 2.5, the sensitivity to the rapidity spectrum of the -bosons is greatly reduced. This is reflected in the reduced uncertainty due to proton structure. This uncertainty is 15 MeV if only central electrons are included and 7 MeV if also electrons in EC are accepted.
All DØ measurements combined give GeV.
2.3 Combination of Collider Results
Table 1 lists the individual measurements for comparison in sequence of their publication. The number of -boson events given reflect the number of events included in the fit to the transverse mass spectrum. The number of events is given if the data were used to calibrate the lepton scale. The statistical uncertainty reflects statistical fluctuations in the data sample. The scale uncertainty refers to the uncertainty in the lepton momentum scale calibration. If the data are used to calibrate the lepton scale, this uncertainty is dominated by statistical fluctuations in the data sample. The systematic uncertainty reflects all other systematic effects. All uncertainties are rounded to the nearest 5 MeV.
| measurement | events | stat | scale | syst | total | ||||
|---|---|---|---|---|---|---|---|---|---|
| (GeV) | (MeV) | ||||||||
| UA2 | [6] | 2065 | 251 | 80.36 | 220 | 260 | 150 | 370 | |
| CDF | [36] | 1130 | N/A | 79.91 | 350 | 190 | 240 | 465 | |
| 592 | N/A | 79.90 | 530 | 80 | 315 | 620 | |||
| CDF | [22] | 5718 | N/A | 80.49 | 145 | 120 | 130 | 230 | |
| 3268 | N/A | 80.31 | 205 | 50 | 120 | 245 | |||
| DØ | [42] | 5982 | 366 | 80.35 | 140 | 160 | 145 | 255 | |
| DØ | [20] | 23068 | 2179 | 80.44 | 70 | 70 | 60 | 115 | |
| DØ | [43] | 11090 | 1687 | 80.69 | 110 | 190 | 75 | 230 | |
| CDF | [37] | 30100 | 1600 | 80.47 | 65 | 75 | 55 | 115 | |
| 14700 | 1800 | 80.47 | 100 | 85 | 55 | 145 | |||
In combining the results from the three -collider experiments, correlations must be accounted for. Since the Monte Carlo models used by the three experiments were tuned independently based on experimental data, the detector models are certainly independent. The uncertainties due to higher order corrections are dominated by independent experimental uncertainties. The constraints on the spectra are dominated by statistical fluctuations in the respective data samples and are therefore uncorrelated as well. Thus, the only significant correlation originates from the common uncertainty in the structure of the proton. Table 2 summarizes the combined data.
| uncertainty (MeV) | |||
|---|---|---|---|
| experiment | (GeV) | total | correlated |
| UA2 | 80.363 | 371 | 85 |
| CDF | 80.433 | 79 | 25 |
| DØ | 80.482 | 91 | 9 |
The individual results combine to
| (10) |
with .
3 MEASUREMENTS OF AT LEP


From 1989-1995 the Large Electron-Positron collider (LEP) at CERN provided collisions at center-of-mass energies at or near the -boson mass. Since 1996, LEP has been running at center-of-mass energies above the -pair production threshold, . The collider provides data to four experiments, Aleph, Delphi, L3, and Opal. While the LEP1 program afforded precision measurements of the -boson mass, the LEP2 program provides the opportunity to precisely measure the -boson mass666“LEP1” refers to data taken from 1989-1995, when the LEP collider operated at about , while “LEP2” refers to data taken from 1996-2000 at GeV..
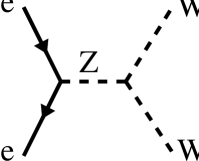
At LEP2 energies -bosons are predominantly produced in pairs through the reaction , whose tree level diagrams appear in Figure 7. Each subsequently decays either hadronically (), or leptonically (, , , or ). There are then three possible four-fermion final states, hadronic (), semi-leptonic (), and leptonic (), with branching fractions of , , and respectively. The production cross section varies from pb at GeV to pb at GeV. This can be contrasted with the production cross sections for the dominant background processes777Some of the cross sections given here include kinematic cuts which restrict the final states to -like parts of phase-space. These cuts are detailed in Reference [45]., pb, pb, pb, and pb, where the spread accounts for variations across the different LEP2 center-of-mass energies [45]. The algorithms used to select candidate events exploit the kinematic properties unique to the final states. The selection algorithms are sensitive to all possible final states and obtain efficiencies of better than about with purities in excess of about .
3.1 Measurement Techniques
There are two main methods available to measure at LEP2. The first exploits the fact that the production cross section is particularly sensitive to at . In this threshold region, assuming SM couplings and production mechanisms, a measure of the production cross section yields a measure of . In early 1996 each of the LEP experiments collected roughly of data at GeV and determined using the threshold technique [46].
The second method uses the shape of the reconstructed invariant mass distribution to measure . This method is particularly useful for GeV where the production cross section is larger and phase-space effects on the reconstructed mass distribution are smaller. Each experiment collected roughly at GeV [47] in later 1996, at GeV in 1997 [48], at GeV in 1998 [49], and at GeV in 1999. Since most of the LEP2 data have been collected at center-of-mass energies well above the threshold, the LEP2 determination is dominated by the direct reconstruction method. The results reported in this article only include the data taken through the end of 1998.
Each method shall be described in greater detail below.
3.2 Threshold Determination of
At center-of-mass energies very near the production cross section, , is a strong function of , so that a measurement of can be used to determine the -boson mass. This is illustrated in Figure 9, which plots the -pair production cross section as a function of center-of-mass energy for various assumed values of the -boson mass. Note that for significantly above or below , the various curves converge, so that has little sensitivity to at those energies. It is only in the threshold region that the curves significantly separate, so that a measure of affords a determination of . To measure the -boson mass using the threshold method, one needs to 1) select events, 2) determine , and 3) extract from the determination. In practice, steps 2) and 3) are not completely independent due to quantum interference effects, which require that special care be taken when defining the production cross section. Before discussing each of the steps in more detail below, it is useful to detail the calculation.
The -pair production cross section is defined to be the production cross section for the diagrams given in Figure 7. The separation between the signal production diagrams and background diagrams resulting in the same four-fermion final states (e.g. and ) is complicated by quantum interference effects. In addition, the shape of the vs. curve is affected by higher order electroweak and QCD corrections. The effects of four-fermion interference and the electroweak and QCD corrections must all be sufficiently understood theoretically in order to meaningfully determine . It turns out that the interference effects are small and can be sufficiently addressed in the background subtraction, as discussed in section 3.2.5. The effects of the higher-order corrections are larger and will be further discussed here.
As illustrated in Figure 9 [45], the vs. curve gets smeared out near by the effects of the natural width of the -boson, , and by the effects of initial state radiation (ISR). There are also large corrections associated with Coulomb interactions between the two s, and some QCD corrections affecting final states. The theoretical uncertainties associated with calculating the necessary corrections contribute a uncertainty in . These theoretical uncertainties are dominated by the uncertainty in the Higgs boson mass, which contributes to higher-order electroweak loop corrections and is most pronounced near threshold (). The remaining uncertainties contribute below the level [50].
3.2.1 EVENT SELECTIONS
The statistical uncertainty in determined from the threshold method can be expressed as
| (11) |
where and are the selection efficiency and purity, respectively and is the total integrated luminosity. From this it is obvious that high efficiency, high purity selections are important. Separate selections are developed for each of the main four-fermion final states — the fully hadronic, the semi-leptonic, and the fully leptonic. Each will be discussed separately. The algorithms employed are quite involved and vary in the details of their implementation across the LEP experiments. In the descriptions below an effort is made to simply emphasize the most important discriminating variables and the dominant systematic uncertainties. For detailed descriptions of the selection algorithms, the reader is referred to References [46].
3.2.2 EVENT SELECTION
The fully hadronic selection is designed to efficiently select events, which are characterized by four (or more) energetic hadronic jets, with little missing energy or momentum. The dominant background is from the QCD processes , which radiate little energy to ISR. Discrimination relies primarily on the fact that the jets in signal events tend to be higher energy and more spherically distributed than those in background events. In addition, to further reduce the QCD background, a kinematic fit can be employed which requires the two di-jet masses to be approximately equal. The selections usually require high multiplicity, full energy events and exploit the unique kinematics in a multivariate discriminant (e.g. a neural net output) to separate signal from background. The typical selection efficiency is about with purity.
For the background estimate, the dominant systematic uncertainty (5%) is associated with modeling the dominant QCD background, estimated by comparing data to Monte Carlo using high statistics samples of events from LEP1, and by comparing the estimates from various Monte Carlo generators (i.e. Pythia and Herwig). The uncertainty associated with the signal efficiency is dominated by comparisons of different generators (Pythia, Herwig, Ariadne, Koralw and Excalibur). Contributions from uncertainties in the LEP beam energy, , and ISR are negligible (). The selection efficiency is also negligibly dependent on and on the details of modeling color-reconnection and Bose-Einstein correlation effects, which are discussed in more detail in Section 3.3.4.
3.2.3 EVENT SELECTION
The semi-leptonic selection is designed to efficiently select events and is typically broken into three separate selections, one for each lepton flavor.
The and events are characterized by two energetic hadronic jets, a high energy, isolated lepton and large missing momentum associated with the prompt neutrino from the leptonically decaying . The dominant background is from radiative events in which a hadron or initial state photon is misidentified as a lepton. Other background sources include , and events. The selections require two hadronic jets, an identified, energetic (e.g. GeV), isolated electron or muon and large missing momentum. The backgrounds from radiative and events tend to produce missing momentum along the beam axis. Requiring a significant missing transverse momentum dramatically reduces these backgrounds. The typical selection efficiency is about with purities of around . These selections also select about of events due to the leptonic decays of the tau.
The dominant systematic uncertainty associated with the selection efficiencies () is due to uncertainties in the Monte Carlo modeling of the data and from comparing different Monte Carlo generators for events. The dominant systematic uncertainty () associated with the background estimate is again due to the modeling of the dominant background and from comparisons of different Monte Carlo generators. For the channel, uncertainties from the modeling of four-fermion interference, particularly from events, estimated by comparing the results of different Monte Carlo generators, can increase the total background uncertainty to . Since the selections are so pure, these relatively large uncertainties in the accepted background cross sections translate into very small uncertainties in .
The events are characterized by two hadronic jets, a -decay jet, and missing momentum associated with two or more neutrinos. The dominant background arises from radiative events where a third jet, often due to soft gluon emission, is misidentified as a -jet. These selections are very similar to the and selections except that they identify the as a low-mass, low multiplicity (1- or 3-prong), isolated jet. Since the lepton identification is looser than for the other selections, the background tends to be higher. Selection efficiencies vary widely among the LEP experiments — from exclusive of those events identified by one of the other selections. Due to the looser lepton identification requirements these algorithms typically select an additional of and events failing the above selections. The typical purity of this selection also varies widely among the LEP experiments, .
The dominant systematic uncertainty associated with the selection efficiency () is due to the modeling of the lepton identification variables, estimated by comparing LEP1 data and Monte Carlo, and from the comparison of various Monte Carlo generators. The dominant systematic uncertainty associated with the estimate of the accepted background cross section () comes from the modeling of hadron mis-identification, estimated by comparing the data and Monte Carlo fake rates in LEP1 events.
3.2.4 EVENT SELECTION
The fully leptonic channel, , is characterized by two high energy, isolated, acoplanar leptons. The selections typically start by requiring a low multiplicity and large missing transverse momentum. There are six distinct final states (, , , , and ), which have differing dominant background sources. Potential background sources are two photon, , , and radiative events. In general the selection involves several independent and overlapping sets of cuts which employ various combinations of specific electron, muon, and tau identification algorithms. Backgrounds are usually rejected by requiring large missing energy, large transverse momentum and a large lepton-lepton acoplanarity. The efficiency varies widely across the LEP experiments, from about for Delphi and L3, to about for Opal and Aleph. The selection purities are around .
The dominant systematic uncertainty associated with estimating the selection efficiency () is due to the modeling of lepton identification variables, specifically those sensitive to FSR modeling (e.g. isolation variables). Comparisons from different Monte Carlo generators also contribute. The dominant systematic uncertainty associated with estimating the accepted background cross sections () arises from limited Monte Carlo statistics and comparisons of different Monte Carlo generators. The effect of detector mis-modeling is small owing to the experience gained at LEP1 using data. However, veto cuts employed in these low multiplicity final states are particularly sensitive to beam related backgrounds which are not included in the Monte Carlo. These are estimated using random trigger crossings and have the consequence of reducing both the signal efficiency and accepted background by a factor of order with a relative uncertainty of a few percent.
3.2.5 DETERMINING AND
A maximum likelihood procedure is used to determine . The likelihood is usually taken to be the product of Poisson probabilities of observing events when expecting events, where , , and are the selection efficiency, branching ratio, and accepted background cross section, respectively, for the th selection, and is the integrated luminosity. In the likelihood calculation, correlations between the channels are properly accounted for and Standard Model branching ratios are assumed. The accepted background cross section is assumed independent of . Four-fermion interference effects are typically accounted for either by applying a correction factor, , to the product , or by adding a factor, , to . These corrections are negligible () for all channels except the and channels which have ( pb) and ( pb). These correction factors are determined by comparing the predicted total accepted cross section (i.e. signal plus background) calculated including and excluding these interference effects. A systematic uncertainty is estimated by comparing the predictions from different Monte Carlo generators which include the four-fermion (4f) interference effects. Given the large statistical uncertainty on these corrections do not significantly affect the result. Strictly speaking, the correct manner in which to account for these interference effects, is to make the replacement in the likelihood calculation, where is the -dependent 4-fermion production cross section, including the interference effects.
The measured production cross section is then compared to SM predictions for dependent on and . The likelihood equation is modified so that . The dependence of on is calculated using the semi-analytic program Gentle [51], which includes the higher order electroweak and QCD corrections. The results from each of the LEP experiments are given in Table 3.
In addition to the systematic uncertainties associated with the selection efficiencies and accepted background cross sections described above, there are uncertainties due to higher-order corrections affecting ( at GeV as discussed above) and to the precision of the LEP determination of ( MeV at GeV [52]).
| exp | (pb) | (GeV) | |
|---|---|---|---|
| Aleph | |||
| Delphi | |||
| L3 | |||
| Opal |
3.2.6 COMBINATION OF DETERMINATIONS FROM THRESHOLD
The combined determination of is extracted from the LEP combined measurement of , which is then compared to the Gentle prediction for assuming SM couplings and the LEP average center-of-mass energy as shown in Figure 10. When making the combination the expected statistical uncertainty is used to calculate the weight of each experimental measurement so as to avoid biasing the result. Since the statistical uncertainties dominate each individual measurement as well as the combined result, the smallest quoted systematic uncertainty ( pb) is conservatively taken to be fully correlated between experiments. Note that since an individual experiment’s weight in the combination is driven by its statistical uncertainty, this procedure does not affect the central value of the combination and yields a conservative estimate of the combined systematic uncertainty. Combining the four LEP experiments’ determinations of yields
| (12) |
with a per degree of freedom of . Using the LEP average center-of-mass energy of GeV and the Gentle prediction, the -boson mass is then determined from this threshold (TH) method to be [53]
| (13) |
The statistical uncertainty dominates the experimental uncertainty, which has a contribution of approximately MeV from correlated systematics. If this method were to be employed in the future (e.g. at an NLC), a potentially limiting uncertainty is due to the modeling of fragmentation and hadronization, which has a large effect on the channel and is correlated among the experiments. This uncertainty is presently the single largest contribution to the total uncertainty assigned to the LEP combined at higher center-of-mass energies (where the statistical uncertainties are smaller) and contributes approximately a MeV uncertainty to .
3.3 Direct Reconstruction of
As demonstrated in Figure 9, at center-of-mass energies above GeV the production cross section becomes significantly less sensitive to . At these energies one can extract a measure of from the invariant mass distribution of the -decay products. The sensitivity to uncertainties associated with the modeling of events near the phase-space limit () is greatly reduced since . However, as discussed in Section 3.3.4, the modeling of various final state interactions becomes more important in the channel. To measure using this direct reconstruction technique one must 1) select events, 2) obtain the reconstructed invariant mass, , for each event, and 3) extract a measure of from the distribution. Each of these steps is discussed in detail in the sections below.
3.3.1 EVENT SELECTION
The expected statistical uncertainty on determined from direct reconstruction will vary inversely with the selection efficiency and purity. At higher center-of-mass energies the production cross section increases by over a factor of four, while the dominant background cross sections increase less rapidly, or even decrease. This affords selections with greater efficiencies for the same purities relative to those employed for the selection at GeV. Nevertheless, the algorithms employed are very similar to those described in Section 3.2.1 and so will not be further discussed here. Typical selection efficiencies (purities) are () for the channel, () for the and channels, and () for the channel. The channel does not significantly contribute to the determination of from direct reconstruction and is not discussed further. For the high energy data taken through 1999, these efficiencies and purities yield approximately candidate events, about of which are non- background. The selection efficiencies have a total uncertainty of about (absolute) and have a negligible effect ( MeV) on the determination. The accepted background cross sections have a total uncertainty of (relative) and affect the determination at the MeV level (cf. Section 3.3.4).
3.3.2 INVARIANT MASS RECONSTRUCTION
For each selected event, an invariant mass is reconstructed from the decay products. There are several methods available for reconstructing the invariant mass of a candidate. The best resolution is obtained by using a kinematic fit which exploits the fact that the center-of-mass energy of the collision is known a priori 888Strictly speaking, this is not true since any ISR reduces the collision energy to less than twice the beam energy. The kinematic fits assume no ISR. The effect of ISR uncertainties is incorporated in the total systematic uncertainty discussed in Section 3.3.4 and is small.. Since the type of fit employed varies for each final state, each will be discussed separately. While the details of the fits differ among the LEP experiments, the important features are similar.
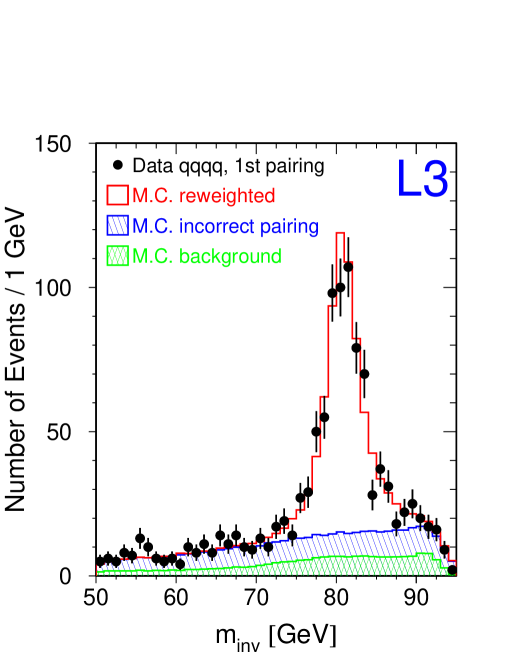
Selected events are forced into a four-jet configuration using, for example, the Durham algorithm [54]. A kinematic fit is then performed to estimate the reconstructed invariant mass of the candidates. A fit which incorporates the constraints of energy and momentum conservation (4C fit) yields two reconstructed invariant masses per event (,), one for each -boson in the final state. A fifth constraint can be incorporated by neglecting the finite width and constraining the invariant masses to be equal, . For each event, this 5C fit yields a single reconstructed mass, , its uncertainty, , and a fit -probability. The fit requires as input the jet momenta, energy, and their associated uncertainties. A complication of the final state is due to the pairing ambiguity — there exist three possible jet-jet pairings for a four-jet final state. This pairing ambiguity gives rise to a combinatoric background unique to this channel. Each LEP experiment employs a different technique for differentiating among the combinations. Typically an experiment will use the best one or two combinations. The correct combination is among those used in about of the events. For events with the correct pairing, the kinematic fit has a resolution of about GeV per event and is dominated by the jet angular resolution. The wrong combinations are treated as a background. It should be noted that the shape of the combinatoric background is fairly flat (cf. Figure 12). Because of this the determination is not critically dependent on how well known the fraction of correct pairings is.
Selected and events are forced, after removing the lepton candidate, into a two jet configuration. All four LEP experiments use a kinematic fit employing energy and momentum conservation constraints and the equal mass constraint. Since the prompt neutrino from the leptonically decaying takes three degrees of freedom, this is a 2C fit yielding a single reconstructed mass, uncertainty and fit -probability per event. The fit requires as input the jet and lepton energy and momenta and their associated uncertainty. The and events have a resolution of roughly GeV and GeV, respectively, per event. This resolution is dominated by the uncertainty in the lepton energy.
Selected events are forced, after removing tracks and clusters associated with the -decay, into a two jet configuration. The treatment of events varies among the LEP experiments. Basically the invariant mass of the hadronic system is used, the resolution of which can be improved by requiring energy and momentum conservation and employing the equal mass constraint. The resolution of the events is approximately GeV per event and is dominated by the resolution of the jet energies.
3.3.3 EXTRACTING
The ensemble of selected events yields a distribution from which a measure of is extracted. There are several methods available for extracting . Aleph, L3, and Opal all employ a traditional maximum likelihood comparison of data to Monte Carlo spectra corresponding to various . In addition to its simplicity, this method has the advantage that all biases (e.g. from resolution, ISR, selection, etc.) are implicitly included in the Monte Carlo spectra. The disadvantage of this method is that it may not make optimal use of all available information. Delphi employs a convolution technique, which makes use of all available information; in particular, events with large fit-errors are de-weighted relative to fits with small fit-errors. The convolution has the limitations that it requires various approximations (e.g. the resolution is often assumed to be Gaussian) and often requires an a posteriori correction as the fit procedure does not account for all biases, notably from ISR and selection. All experiments employ an analytic fit of a relativistic Breit-Wigner (with -dependent width)+background to the data, which also requires a posteriori corrections, as a cross-check. Since their dominant systematic uncertainties differ, is measured from the and the samples separately. These are then combined, taking into account correlations, to yield a final measurement of . In the results given here, the Standard Model relation between and has been assumed [50].
| exp | /GeV |
|---|---|
| Aleph | |
| Delphi | |
| L3 | |
| Opal | |
| LEP |
| exp | /GeV |
|---|---|
| Aleph | |
| Delphi | |
| L3 | |
| Opal | |
| LEP |
The results from each LEP experiment, using data collected at GeV [47, 48, 49], are given in Table 4 for the channel and in Table 5 for the channel999These results are based in part on preliminary numbers for the data taken at GeV.. Also included is the mass obtained when combining all the measurements. In the combination correlations are taken into account as described in Section 3.3.5. Figure 12 shows the Opal fits for the data taken at GeV.

3.3.4 SYSTEMATIC UNCERTAINTIES
The systematic uncertainties for a “typical” LEP experiment are given in Table 6. This table should be taken as a general guide. The actual numbers vary by as much as MeV from experiment to experiment. It is still the case that the total uncertainty of a single experiment is dominated by the statistical uncertainty. As this is the case, the experiments are at various stages in developing more sophisticated methods to estimate the limiting systematic uncertainties. This largely accounts for the range of uncertainties and not any inherent detector or methodological advantages. It should be noted that for all four LEP experiments the uncertainties associated with ISR, fragmentation, and four-fermion interference are limited by the statistics of the comparison. Uncertainties associated with the selection efficiencies and accepted backgrounds are included in the line labeled “fit procedure”. For the channel the largest single contribution to the systematic uncertainty is due to detector effects (e.g. energy scales, resolutions, and modeling). These uncertainties are expected to decrease as more data are collected. For the channel the dominant systematic uncertainty is due to color-reconnection and Bose-Einstein correlation effects. Each source of uncertainty and the methods for estimating it are briefly described below.
- Initial state radiation:
-
Uncertainties due to the modeling of ISR are estimated by comparing the distributions of Monte Carlo samples which include ISR corrections to differing orders. The standard Monte Carlo include corrections to next-to-leading-log . The differences are negligible in samples of several million events. The uncertainty is conservatively taken to be MeV.
- Four-fermion interference:
-
The systematic uncertainty associated with the modeling of four-fermion interference effects is usually estimated by comparing fit results using Monte Carlo reweighting techniques which employ matrix element calculations including and excluding the interferences. The differences are small and the comparisons often statistically limited.
- Fragmentation:
-
A variety of methods is employed to estimate the uncertainty associated with fragmentation modeling. Typically, LEP1 data are used to constrain model parameters. Those parameters are then varied in several Monte Carlo samples, which are re-fit as data. The results are compared to a Monte Carlo sample with default parameters. The differences are typically small except for the channel, where they are on the order of MeV. Since this systematic is strongly correlated among the LEP experiments, it is one of the dominant systematic uncertainties in the LEP combined measurement. Delphi employs an alternative method for estimating these uncertainties [48], in which two events are boosted to the appropriate center-of-mass energy and overlayed in data and Monte Carlo; the two samples are treated as data and their resulting fit masses compared.
- Detector effects:
-
Calibration data collected at the start and end of each year at , are used to establish limits on the uncertainties associated with detector modeling in the Monte Carlo. Uncertainties in energy scale and resolution are estimated using data. The linearity is checked using Bhabha, , and 3-jet events in data collected at higher center-of-mass energies. The angular resolutions are similarly determined. Typically the jet and lepton energy scales are known to within %, while the modeling of the angular and energy resolutions have associated uncertainties of the order % depending on polar angle. These uncertainties are propagated to the measurement by comparing the fit results of Monte Carlo samples in which the appropriate quantity has been scaled or varied to the results from the default Monte Carlo sample. The observed differences are used as estimates of the associated uncertainty on due to detector modeling effects.
- Fit procedure:
-
The type of effects considered depend on the fit method employed to extract from the distribution. These include uncertainties associated with the background normalization and shape, and fit biases. In general the total effect is very similar across methods. The background normalization is varied within uncertainties determined from a dedicated analysis yielding small effects. The shape of the background distribution is cross-checked using data where possible and compared across different Monte Carlo generators otherwise, also yielding small effects. The linearity of the fit methods is determined from Monte Carlo samples generated assuming various values. These samples are also used to verify that the statistical uncertainty is accurate. For the convolution and Breit-Wigner methods, these Monte Carlo samples are used to calculate the necessary bias corrections, whose uncertainties are then propagated to the final uncertainty.
- Beam energy:
-
The uncertainty in the beam energy enters via the constraints employed by the kinematic fit and should be of order . The effect on the measured is estimated by re-fitting all data changing the used in the fit and calculating the mean difference in fitted on an event-by-event basis. The beam energy is estimated using the method of resonant depolarization [55]; the last energy point for which the depolarization method works is GeV. An extrapolation is required to estimate the beam energies at which the data are taken, GeV. The uncertainty in the beam energy is about MeV and is dominated by the uncertainty in this extrapolation. With the addition of more resonant depolarization data and new techniques, it is expected that the uncertainty on due to uncertainties in will be reduced to around MeV [52, 56]. The spread in the beam energy, MeV [52], has a negligible effect on .
- CR/BE:
-
Since the typical decay distance of the -bosons, fm, is much smaller than the typical fragmentation radius, fm, the decay products originating from different -bosons cannot be considered as independent — i.e. they can “talk” to each other. The modeling of this cross-talk in the Monte Carlo spectra used to extract is an additional source of systematic uncertainty in the channel. The cross-talk can arise through two mechanisms, Bose-Einstein correlations (BE) and color reconnection effects (CR) [45][57]. The modeling uncertainty is estimated separately for BE and CR and is model dependent in both cases. In each case Monte Carlo samples employing implementations of various CR/BE models are treated as data and an bias is estimated. The systematic uncertainty is chosen to include the full range of variation among the models explored and is on the order of MeV.
It should be noted that there has been recent progress in experimentally constraining the available CR models by comparing event shape and charged particle multiplicity distributions as predicted by various Monte Carlo models (both including and excluding CR effects) with those observed in the high-energy data. In addition, studies using LEP1 data can also be used to test the available models [58]. On the basis of these studies, some of the models have been excluded as they fail to adequately describe the data [59], thus enabling a reduction in the associated systematic uncertainty (from to MeV). For a more complete discussion, see Reference [59]. Additional data should help to further constrain the remaining CR models and thus improve this uncertainty further.
| systematic | uncertainty (MeV) | |
|---|---|---|
| source | ||
| initial state radiation | 10 | 10 |
| four-fermion | 10 | 10 |
| fragmentation | 25 | 30 |
| detector effects | 30 | 30 |
| fit procedure | 20 | 20 |
| Sub-total | 46 | 49 |
| beam energy | 17 | 17 |
| CR/BE | – | 60 |
| Total | 49 | 79 |
3.3.5 COMBINATION OF DETERMINATIONS FROM DIRECT RECONSTRUCTION
Each of the LEP experiments provides their measured -boson mass for the fully-hadronic and semi-leptonic channels separately for each center-of-mass energy along with a matrix of associated uncertainties. The uncertainties are broken down into four components:
-
1.
uncertainties uncorrelated between channels and experiments (e.g. the statistical uncertainty or background normalization and shape uncertainties)
-
2.
uncertainties correlated among the channels of a given experiment, but uncorrelated between experiments (e.g. detector modeling uncertainties)
-
3.
uncertainties uncorrelated between the channels, but correlated among the experiments (i.e. CR/BE uncertainties)
-
4.
uncertainties correlated between the channels and among the experiments (e.g. ISR, fragmentation, uncertainties).
In this way the correlations between channels and among experiments are accounted for. The correlation of the uncertainty across the different years is also taken into account. The results for the combined and channels are given in the last lines of Tables 4 and 5 and are correlated with a . Combining all the direct reconstruction (DR) results into a single mass yields
where the uncertainties associated with CR/BE modeling and with the LEP beam energy have been listed separately [60]. The dominant systematic uncertainty is associated with the fragmentation model, which is correlated among the experiments (they all employ the same models in their Monte Carlo) and contributes an uncertainty of approximately MeV. The effect of the CR/BE uncertainty is to de-weight the measurements relative to the measurements in the channels.
3.4 Combination of LEP Results
The determination using the threshold method is combined with the determination using the direct reconstruction method taking account of the correlations. In particular, the systematic uncertainties associated with the LEP beam energy, and the modeling of ISR, fragmentation, and four-fermion interference effects are taken as correlated. Note that the weight of the threshold determination of in the combination is driven by the statistical uncertainty of that measurement. The LEP combined result, assuming the Standard Model relation between the decay width and mass, is
| (14) |
where the uncertainty includes both statistical and systematic uncertainties and is dominated by the determinations using direct reconstruction methods [60].
4 WHAT DO THESE MEASUREMENTS TELL US?
4.1 Combination of Results
Direct measurements of the -boson mass have been performed in two kinds of experiments, the production of -bosons in collisions and the production of pairs in collisions.
Until 1996, collisions were the only source of -bosons. The advantage of colliders lies in the large production cross section and the low background levels. The data give about 100,000 candidate events with about 97% purity. The production of -bosons, dynamically and kinematically very similar to -boson production, provides a very convenient control data sample. The disadvantage of colliders is that the parton center-of-mass frame is not known on an event-by-event basis and therefore systematic effects arising from the structure of the protons must be understood. The combined -collider measurement is GeV.
Since 1996, collisions with enough energy to produce pairs of -bosons are available. The advantage of collisions is that since the initial particles are point like and so the center-of-mass energy of the collision is known, kinematic fits can be employed to fully reconstruct events and thus yield invariant mass resolutions comparable to the -boson width. The disadvantage of colliders is that the production cross section is two orders of magnitude smaller than at colliders, resulting in smaller and less pure event samples (about 22,000 events with about 90% purity). In addition, the modeling of final-state interactions in events must be understood. The combined LEP measurement is GeV.
The two determinations of the -boson mass are completely uncorrelated. A combination of both results is simple, resulting in a world average of
| (15) |
with a of . Having two independent, precise determinations of this parameter in agreement with each other lends significant credibility to the results.
Within the framework of the Standard Model, the measurement of the -boson mass determines the radiative corrections, , in Equation 6. These corrections have a large contribution from the running of the electromagnetic coupling. We can absorb this into the value of by writing
| (16) |
For the residual contribution from electroweak loops, we find , about 10 standard deviations from zero.
4.2 Comparisons and Constraints within the Standard Model
The Standard Model provides us with a framework that allows us to relate the measurements from many processes that involve the electroweak interaction. The main sources of such information are measurements of the properties of the -boson at LEP1 and SLC, the study of deep inelastic neutrino scattering at Fermilab, and the measurement of the mass of the top quark at the Tevatron.
LEP1 and SLC have provided us with a wealth of very precise measurements of the properties of the -boson [61]. At tree level, the properties of the -boson are determined by its mass, the weak mixing angle, and the fine structure constant. Radiative corrections are dominated by the masses of the top quark and the Higgs boson. The wonderful success of the Standard Model lies in all measurements being consistent with single values of these parameters. The mass of the -boson is measured directly from the line shape, and the fine structure constant, evolved to is derived from measurements of , the ratio of the cross sections to hadrons and to . The other three parameters are extracted from a fit to the measurements. The mass then follows from Equation 6.
The CCFR [62] and NuTeV [63] experiments at Fermilab measure the ratio of charged current and neutral current interactions of neutrinos. This ratio depends directly on . From the measured value 101010CCFR and NuTeV combined., a value for the -boson mass of GeV can be derived.
At the loop level many other parameters contribute (mostly negligible) corrections to the tree level values. Due to the large mass difference between the top and bottom quarks, radiative corrections involving top-quark loops are important. The CDF and DØ Collaborations have measured the top quark mass directly [64]. Their combined value is GeV.
A fit of the Standard Model to all measurements except the direct measurements of the -boson mass returns [65] GeV as its preferred value. This value is in excellent agreement with the combined direct measurements, in support of the validity of the Standard Model. The mass of the Higgs boson is the only parameter which is not measured experimentally. Loops containing Higgs bosons also contribute important radiative corrections. A fit to all electroweak data, including the measurements of the -boson mass, prefers GeV for the mass of the Higgs boson [65].
The Higgs-boson mass can also be constrained based on the measured values of the -boson and top-quark masses alone. This is shown graphically in Figure 13. The shaded bands indicate the values of the -boson mass predicted by the Standard Model as a function of the top quark mass, for given values of the Higgs-boson mass [66]. The width of the bands indicates the variation due to the uncertainty in [67], which dominates the uncertainty in the predictions. The ellipse indicates the two-dimensional 68% confidence-level interval defined by the measured mass values. The inset shows a plot of between the measured values and the predictions as a function of the Higgs-boson mass. The preferred Higgs-boson mass is GeV. Values above 277 GeV are excluded at 90% confidence level. The dashed contour shows the 68% confidence-level interval from the fit to all other electroweak data [65].
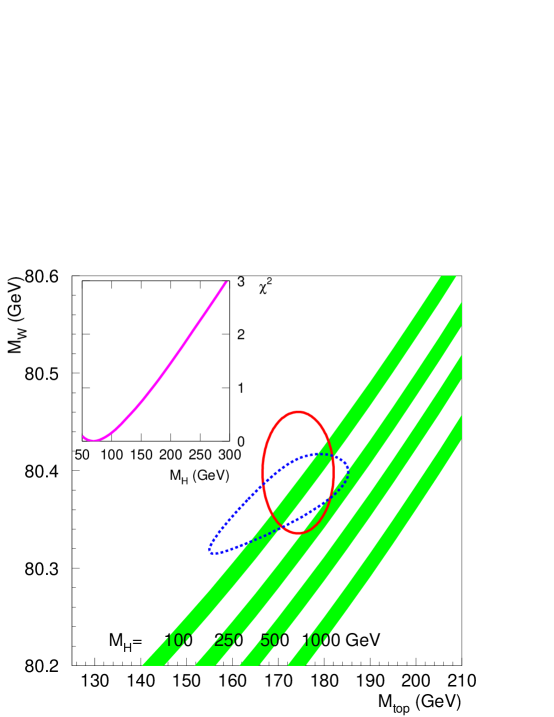
4.3 Constraints Outside the Standard Model
Any particle that couples to the -boson can contribute loop corrections to the value of the -boson mass. Thus a measurement of the -boson mass does not only test the Standard Model, but it is, at least in principle, also sensitive to non-standard physics. In the minimal supersymmetric model, corrections could increase the -boson mass by as much as 250 MeV [68]. The correction is larger, the lower the scale of supersymmetry breaking. If the scale of supersymmetry breaking is more than a few hundred GeV, supersymmetry decouples from Standard Model physics and the effects of supersymmetric loop corrections on the -boson mass become small. Supersymmetric particles that give large corrections must be relatively light and would also be the first ones to be seen in direct searches. Thus, precision measurements are unlikely to increase the sensitivity of direct searches for supersymmetric extensions of the standard model.
5 FUTURE PROSPECTS
The precision on the world average -mass is expected to improve significantly over the next 5 years, and could possibly improve dramatically over the next decade or so.
By the end of 2000, the LEP experiments will have more than doubled the statistics of their data sets relative to what has been included in this review. The inclusion of the additional data will yield a statistical uncertainty for the combined LEP measurement of of about MeV. Already a significant effort has been made to reduce the systematic uncertainties, particularly those associated with the detector energy scales and resolutions. It is expected that these errors can be brought to the MeV level. The additional constraints afforded by the LEP spectrometer project[56] and by additional depolarization data make it likely that the uncertainty associated with the LEP beam energy will be reduced to roughly MeV. It is difficult to predict how the systematic uncertainties associated with the modeling of Bose-Einstein and color-reconnection effects in the channel will evolve. While it is true that the additional data will provide more stringent tests, it is unknown whether the additional sensitivity will actually reveal a discrepancy large enough to reject any of the remaining viable models. Assuming none of the remaining models are rejected, so that the CR/BE uncertainty remains the same, the projected total uncertainty on at the end of LEP2 would be of order MeV from the LEP combination. If the CR/BE uncertainty can be reduced to less than MeV, it may be possible for the LEP combined determination to reach a total uncertainty of MeV.
In spring of 2001, the CDF and DØ experiments will start taking data at the Fermilab TeVatron. They anticipate collecting of data by 2004, which should give a five-fold improvement in the statistical uncertainty of the TeVatron measurement. The systematic uncertainties associated with the energy scale and other detector effects are dominated by the statistics of the control samples and are expected to scale accordingly. On the other hand, the systematic uncertainty associated with the -production modeling does not scale directly with statistics and may improve only moderately to about MeV. The uncertainty from the combined TeVatron determination is expected to be about MeV[69].
On the time-scale of the next five years, it is expected that the world average -mass will have a total uncertainty of MeV — a factor of two improvement relative to the present uncertainty. The SM constraint on afforded by the measurements alone will be comparable to that afforded by the measurements of LEP and SLD, which presently yield an uncertainty of order . Although these two sets of constraints are correlated through -dependent corrections, it is still interesting to compare them since they have differing sensitivities to the various radiative correction terms. A significant improvement to the SM constraints on requires a more precise determination of . On the same time-scale, the TeVatron experiments are expected to measure to GeV[69]. Including this improvement should yield constraints on with uncertainties on the order of (assuming that the fits continue to give a central value of GeV)[66].
Looking further ahead, on the time-scale of - years, it is possible that the LHC experiments, CMS and ATLAS, will measure the -mass to a precision of MeV and to GeV[70]. And on the time-scale of years, future high luminosity or colliders might yield the statistics to envision a MeV measurement of using the threshold method and a GeV measurement of [71][72]. If achieved, such precision measurements would yield constraints on with uncertainties of GeV - which we can hope will offer, by that time, a very interesting comparison with the directly measured !
6 CONCLUSIONS
The mass of the boson has been measured by many experiments at and colliders. All measurements are in good agreement. The world average of all measurements of the -boson mass is GeV. Based on measurements of other parameters, the Standard Model of the electroweak interactions leads to a prediction of GeV for the mass of the boson, in excellent agreement with the measured value. In the framework of the Standard Model this measurement of the -boson mass, together with the measurement of the top-quark mass, constrains the Higgs-boson mass to values below 280 GeV at 90% confidence level. Over the coming decade, a reduction in the uncertainty of the direct measurement of the -boson mass of at least a factor two is expected. As the top quark mass is measured more precisely and the reach of searches for the Higgs boson increases, the comparison of the indirect constraint on the Higgs-boson mass and its direct measurement or exclusion region will become one of the most interesting tests of the Standard Model. This test will for the first time close in on the symmetry breaking sector of the Standard Model about which very little is presently known.
Acknowledgments
We would like to thank our colleagues at LEP and the Tevatron, with whom we had the privilege to work on these exciting measurements. In particular, we should like to thank W. Carithers, J. Goldstein, A. Kotwal, M. Lancaster, M. Narain, H. Weerts, J. Womersley, N. Watson and D. Wood for many helpful comments and suggestions on the manuscript. This work is partially supported by the U.S. Department of Energy under contracts with Fermi National Accelerator Laboratory and Boston University. One of us (UH) also acknowledges the support of the Alfred P. Sloan Foundation.
References
- 1. Glashow SL, Nucl. Phys. A 22, 579 (1961); Weinberg S, Phys. Rev. Lett. 19, 1264 (1967); Salam A, 1968. In Elementary Particle Theory, ed. N Svartholm. Stockholm: Almquist and Wiksell. 367 pp.
- 2. UA1 Collaboration, Phys. Lett. B 122, 103 (1983); UA2 Collaboration, Phys. Lett. B 122, 476 (1983).
- 3. Phys. Lett. B 107, 306 (1981).
- 4. UA1 Collaboration, Z. Phys. C 47, 11 (1990).
- 5. UA2 Collaboration, Z. Phys. C 47, 11 (1990).
- 6. UA2 Collaboration, Phys. Lett. B 241, 150 (1990).
- 7. CDF Collaboration, Nucl. Instrum. Methods A 271, 387 (1988).
- 8. DØ Collaboration, Nucl. Instrum. Methods A 338, 185 (1994).
- 9. Edwards HT, Annual Reviews of Particle and Nuclear Science 35, 605 (1985).
- 10. Aleph Collaboration, NIMA 294, 121 (1990).
- 11. Delphi Collaboration, NIMA 303, 233 (1991); NIMA 378, 57 (1996).
- 12. L3 Collaboration, NIMA 289, 35 (1990); NIMA 349, 345 (1994); NIMA 351, 300 (1994); NIMA 374, 293 (1996); NIMA 381, 236 (1996); NIMA 383, 342 (1996).
- 13. Opal Collaboration, NIMA 305, 275 (1991); Anderson BE et al., IEEE Transactions on Nuclear Science 41, 845 (1994); Opal Collaboration, NIMA 403, 326 (1998).
- 14. More detailed discussions and derivations can be found, for example, in this textbook: Aitchison IJR and Hey AJG 1989. Gauge Theories in Particle Physics, 2nd ed. Philidelphia: IOP Publishing Ltd. 550 pp.
- 15. Higgs PW, Phys. Lett. 12, 132 (1964); Higgs PW, Phys. Rev. Lett. 13, 508 (1964); Phys. Rev. Lett. 145, 1156 (1966).
-
16.
A more detailed discussion and review of electroweak
radiative corrections can be found, for example, in this article:
Montagna G, Nicrosini O, Piccinni F, Precision Physics at LEP,
to appear in Rivista del Nuovo Cimento,
hep-ph/9802302(1998). - 17. A more detailed discussion, which additionally offers a nice historical perspective, can be found in this article: Marciano WJ, Sirlin A, Phys. Rev. D 29, 945 (1984).
- 18. UA2 Collaboration, Phys. Lett. B 276, 365 (1992).
- 19. DØ Collaboration, Phys. Rev. Lett. 75, 1456 (1995); Phys. Rev. D 60, 052003 (1999); FERMILAB-PUB-99-171-E.
- 20. DØ Collaboration, Phys. Rev. Lett. 80, 3008 (1998); Phys. Rev. D 58, 092003 (1998).
- 21. The LEP Collaborations Aleph, Delphi, L3, Opal with the LEP Energy Working Group and the SLD Heavy Flavor Group, CERN-EP/2000-016, pp. 5 (2000).
- 22. CDF Collaboration, Phys. Rev. Lett. 75, 11 (1995); Phys. Rev. D 52, 4784 (1995).
- 23. CDF Collaboration, Phys. Rev. Lett. 74, 850 (1995).
- 24. CDF Collaboration, Phys. Rev. Lett. 81, 5754 (1998).
- 25. Martin AD, Stirling WJ, and Roberts RG, Phys. Rev. D 50, 6734 (1994); Phys. Rev. D 51, 4756 (1995).
- 26. Lai HL etal., Phys. Rev. D 51, 4763 (1995).
- 27. Ladinsky GA, Yuan CP, Phys. Rev. D 50, 4239 (1994).
- 28. Arnold PB, Reno MH, Nucl. Phys. B 319, 37 (1989), Erratum ibid 330, 284 (1990); Arnold PB, Kauffman RP, Nucl. Phys. B 349, 381 (1991).
- 29. Collins J, Soper D, Nucl. Phys. B 193, 381 (1981), Erratum ibid 213, 545 (1983); Collins J, Soper D, Sterman G, ibid 250, 199 (1985).
- 30. Altarelli G et al., Nucl. Phys. B 246, 12 (1984).
- 31. Berends FA, Kleiss R, Revol JP, Vialle JP, Z. Phys. C 27, 155 (1985); Berends FA, Kleiss R, Z. Phys. C 27, 365 (1985).
- 32. Baur U, Berger EL, Phys. Rev. D 41, 1476 (1990).
- 33. Baur U et al., Phys. Rev. D 56, 140 (1997); Baur U, Keller S, Sakumoto WK, Phys. Rev. D 57, 199 (1998).
- 34. UA2 Collaboration, Phys. Lett. B 276, 354 (1992).
- 35. Harriman PM, Martin AD, Roberts RG, Stirling WJ, Phys. Rev. D 42, 798 (1990); Phys. Lett. B 243, 421 (1990).
- 36. CDF Collaboration, Phys. Rev. Lett. 65, 2243 (1990); Phys. Rev. D 43, 2070 (1991).
- 37. Lancaster M, FNAL-CONF-99-173-E, to appear in the Proceedings of the XXXIVth Rencontres de Moriond, Les Arcs, France, 1999.
- 38. CDF Collaboration, Phys. Rev. D 50, 2966 (1994).
- 39. Martin AD, Roberts RG, Stirling WJ, Phys. Rev. D 37, 1161 (1988).
- 40. Martin AD, Roberts RG, Stirling WJ, Phys. Lett. B 306, 145 (1993), Erratum ibid 309, 492 (1993).
- 41. Martin AD, Roberts RG, Stirling WJ, Phys. Lett. B 387, 419 (1996).
- 42. DØ Collaboration, Phys. Rev. Lett. 77, 3309 (1996); Phys. Rev. D 58, 012002 (1998).
- 43. DØ Collaboration, Phys. Rev. Lett. 84, 222 (2000); FERMILAB PUB-99-237-E.
- 44. Martin AD, Roberts RG, Stirling WJ, Thorne RS, Eur. Phys. J. C 4, 463 (1998).
- 45. Kunszt Z, Stirling WJ, 1996. In Physics at LEP2, volume 1, ed. G Altarelli, T Sjöstrand and F Zwirner, pp. 141-205. Geneva: CERN. 596 pp.
- 46. Opal Collaboration, Phys. Lett. B 389, 416 (1996); Delphi Collaboration, Phys. Lett. B 397, 158 (1997); L3 Collaboration, Phys. Lett. B 398, 223 (1997); Aleph Collaboration, Phys. Lett. B 401, 347 (1997).
- 47. L3 Collaboration, Phys. Lett. B 413, 176 (1997); Opal Collaboration, Eur. Phys. J. C 1, 395 (1998); Aleph Collaboration, Phys. Lett. B 422, 384 (1998); Delphi Collaboration, Eur. Phys. J. C 2, 581 (1998).
- 48. Opal Collaboration, Phys. Lett. B 453, 138 (1999); Aleph Collaboration, Phys. Lett. B 453, 121 (1999); L3 Collaboration, Phys. Lett. B 454, 386 (1999); Delphi Collaboration, Phys. Lett. B 462, 410 (1999).
- 49. Mir L, Mass from Fully Hadronic Decays at LEP, and Chierici R, Mass from Fully Leptonic and Mixed Decays at LEP, both to appear in the proceedings of EPS’99, Tampere, Finland, 1999.
- 50. Beenaker W, Berends FA, 1996. In Physics at LEP2, volume 1, ed. G Altarelli, T Sjöstrand and F Zwirner, pp. 81-140. Geneva: CERN. 596 pp.
- 51. Bardin D, et al., Nucl. Phys. Proc. Suppl. 37B, 148 (1994).
- 52. LEP Energy Working Group, Blondel A, et al., Evaluation of the LEP centre-of-mass energy above the W-pair production threshold, CERN-SL/98-073, accepted by Eur. Phys. J. C.
- 53. The LEP Collaborations Aleph, Delphi, L3, Opal with the LEP Energy Working Group and the SLD Heavy Flavor Group, CERN-PPE/97-154, pp. 22-23 (1997).
- 54. Brown N, Stirling WJ, Phys. Lett. B 252, 657 (1990).
- 55. LEP Polarisation Collaboration, Phys. Lett. B 284, 431 (1992).
- 56. Torrence E, Determination of the LEP Beam Energy, to appear in the proceedings of EPS’99, Tampere, Finland, 1999.
- 57. Ballestrero A, et al., J. Phys. G 24, 365 (1998).
- 58. Opal Collaboration, Eur. Phys. J. C 11, 217 (1999).
- 59. Opal Collaboration, Phys. Lett. B 453, 153 (1999).
- 60. The LEP Collaborations Aleph, Delphi, L3, Opal with the LEP Energy Working Group and the SLD Heavy Flavor Group, CERN-EP/2000-016, pp. 29-32 (2000).
- 61. The LEP Collaborations Aleph, Delphi, L3, Opal with the LEP Energy Working Group and the SLD Heavy Flavor Group, CERN-EP/2000-016 and references therein.
- 62. CCFR Collaboration, Eur. Phys. J. C 1, 509 (1998).
- 63. McFarland K, Proceedings of the XXXIII Rencontres de Moriond, Les Arcs, France 1998.
- 64. CDF Collaboration, 79 1992, 1997 (;) DØ Collaboration, Phys. Rev. D 58, 052001 (1998); CDF Collaboration, Phys. Rev. Lett. 80, 2767 (1998); DØ Collaboration, Phys. Rev. D 60, 052001 (1999); CDF Collaboration, Phys. Rev. Lett. 82, 271 (1999); Erratum ibid 82, 2808 (1999).
- 65. The LEP Collaborations Aleph, Delphi, L3, Opal with the LEP Energy Working Group and the SLD Heavy Flavor Group, CERN-EP/2000-016, pp. 48-49 (2000).
- 66. Degrassi G, Gambino P, Sirlin A, Phys. Lett. B 394, 188 (1997); Degrassi G, Gambino P, Passera M, Sirlin A, Phys. Lett. B 418, 209 (1998).
- 67. Eidelman S, Jegerlehner F, Z. Phys. C 67, 585 (1995).
- 68. Pierce D, Bagger JA, Matchev KT, Zhang RJ, Nucl. Phys. B 491, 3 (1997).
- 69. Future ElectroWeak Physics at the Fermilab Tevatron: Report of the TeV-2000 Study Group, ed. Amidei D and Brock R, FERMILAB-PUB-96-082 (1996).
- 70. Womersley J, Keller S, Eur. Phys. J. C 5, 249 (1998).
- 71. Physics and Technology of the Next Linear Collider, ed. Harris FA, et al. SLAC-R-0485 (1996).
- 72. Barger V, Berger MS, Gunion JF, Han T Phys. Rev. D 56, 1714 (1997).