PDK-752 TUHEP-00-05 17 July 2000 New results on atmospheric neutrinos from Soudan 2 ††thanks: Presented at NU2000, the XIXth Int. Conference on Neutrino Physics and Astrophysics, June 16 - 21, 2000, Sudbury, Canada.
Abstract
Neutrino interactions recorded in a 5.1 fiducial kiloton-year exposure of the Soudan-2 iron tracking calorimeter are analyzed for effects of neutrino oscillations. Using contained single track and single shower events, we update our measurement of the atmospheric / ratio-of-ratios and find . Assuming this anomalously low R-value is the result of flavor disappearance via to oscillation, we select samples of charged current events which offer good resolution, event-by-event, for reconstruction. Oscillation-weighted Monte Carlo events are fitted to these data events using a function summed over bins of log. The region allowed in the (, ) plane at 90% CL is obtained using the Feldman-Cousins procedure: and . A small but relatively energetic sample of partially contained events has also been isolated. Their distribution in log relative to null oscillation Monte Carlo is compatible with to oscillation scenarios within the parameters region allowed by our contained events.
1 DETECTOR; DATA EXPOSURE
The Soudan-2 experiment is currently taking data using its fine-grained iron tracking calorimeter of total mass 963 tons. This detector images non-relativistic as well as relativistic charged particles produced in atmospheric neutrino reactions. It is operating underground at a depth of 2100 meters-water-equivalent on level 27 of the Soudan Mine State Park in northern Minnesota (northwest of Sudbury). The calorimeter’s modular design enabled data-taking to commence in April 1989 when the detector was one quarter of its full size; assembly of the detector was completed during 1993. Data-taking has continued with 85% live time, even though dynamite blasting has been underway nearby for the MINOS cavern excavation since Summer 1999. The data exposure as of this Conference is 5.40 fiducial kiloton-years (kty). Results presented here are based upon a 5.1 kty exposure.
The tracking calorimeter operates as a slow-drift (0.6 cm/s) time projection chamber. Its tracking elements are meter-long plastic drift tubes which are placed into the corrugations of steel sheets. The sheets are stacked to form a tracking lattice of honeycomb geometry. A stack is packaged as a calorimeter module and the detector is assembled building-block fashion using these modules [1]. The calorimeter is surrounded on all sides by a cavern-liner active shield array of two or three layers of proportional tubes [2].
Topologies for contained events in Soudan 2 include single track and single shower events (mostly and quasi-elastic reactions) and multiprong events. Flavor-tagging proceeds straightforwardly: An event having a leading, non-scattering track with ionization compatible with muon mass is a candidate charged current (CC) event of flavor; an event having a prompt, relatively energetic shower prong is a candidate CC event. Recoil protons of momenta greater than approx. 350 MeV/ are imaged by the calorimeter, allowing a much-improved measurement of the incident neutrino direction, especially for sub-GeV quasi-elastic reactions.
2 ATMOSPHERIC FLAVOR RATIO
We measure the atmospheric neutrino / flavor ratio-of-ratios using single track and single shower events which are fully contained within the calorimeter (all hits more than 20 cm from the nearest surface). These samples contain mostly quasi-elastic neutrino reactions, but include a background of photon and neutron reactions originating in cosmic ray muon interactions in the surrounding cavern rock. The latter “rock events” are mostly tagged by coincident hits in the active shield, however some are unaccompanied by shield hits and constitute a background. The amount of zero-shield-hit rock background in a neutrino event sample is estimated by fitting event vertex-depth distributions to a combination of tagged-rock and Monte Carlo distributions. As expected, the fits show the background to be mostly confined to outer regions of the calorimeter. Details of our analysis procedures for quasi-elastic events can be found in Refs. [3].
The track and shower event samples for our 5.1 kty exposure are summarized in Table 1. Our full detector Monte Carlo simulation of atmospheric neutrino interactions is based on the 1996 Bartol flux for the Soudan site [4].
| Tracks | Showers | |
| Data, raw | 133 | 193 |
| Monte Carlo events | 1097 | 1017 |
| (norm. to 5.1 kty) | 193.1 | 179.0 |
| Data, bkgrd subtr. | 105.112.7 | 142.313.9 |
After correction for cosmic ray muon induced background, the number of single track events observed in data is less than the number of single shower events, whereas the null oscillation Monte Carlo predicts the relative rates to be other-way-round. Consequently the flavor ratio-of-ratios obtained is less than 1.0 and is anomalous:
This value is equal to the value obtained last summer using 4.6 kty exposure [6].
3 SAMPLE FOR MEASUREMENT
The phenomenology for to oscillations is quite specific; neutrinos of muon flavor can metamorphose and thereby “disappear” according to the equation
| (1) | |||||
Consequently it is optimal to analyze for neutrino oscillations using the variable . With the Soudan-2 calorimeter, measurement of event energy for charged current reactions is straightforward; we do this with resolution which is 20% for CC’s and 23% for CC’s. To determine the neutrino path length however, the zenith angle of the incident neutrino must be reconstructed with accuracy. The path length can be calculated from the zenith angle according to
| (2) | |||||
where is the Earth’s radius, is the depth of the detector, and is the mean neutrino production height. The latter is a function of flavor, energy, and [5].
We select from our data an event sample suited to this measurement. We use a quasi-elastic track or shower event provided that the recoil proton is measured and that exceeds 150 MeV/; otherwise, if the recoil nucleon is not visible, we require the single lepton to have great than 600 MeV. We also select multiprong events, provided they are energetic ( greater than 700 MeV) and have vector sum of exceeding 450 MeV/ (to ensure clear directionality). Additionally, the final state lepton momenta are required to exceed 250 MeV/. For the selected sample, flavor tagging is estimated to be correct for more than 92% of events. The resolution for recovering the incident neutrino direction is evaluated using the mean angular separation between “true” versus reconstructed neutrino direction in Monte Carlo events. The mean separations are for CC’s and for CC’s . The resolution in ( in kilometers, in GeV) is better than 0.5 for the selected sample. Hereafter we refer to these events as “HiRes events”.
The zero-shield-hit rock background, as estimated by the fits to event vertex depth distributions, comprises 6.8% (5.1%) of the () flavor sample of HiRes events.
Table 2 shows the HiRes event populations. After background subtraction there are 106.3 data events of flavor and 132.8 events of -flavor. Using these events, whose mean energy is higher than that of our track and shower events, the ratio-of-ratios is , which is also significantly less than 1.0.
| Data, raw | 114.010.7 | 140.011.8 | ||
| Data, subt. | 106.314.7 | 132.813.4 | ||
| Monte Carlo | 158.5 4.8 | 132.84.4 |
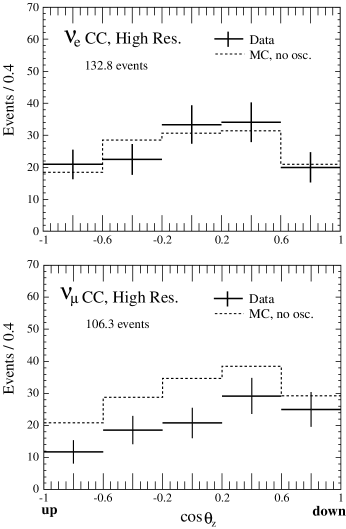
The atmospheric Monte Carlo (MC) sample represents 28.2 kiloton years of exposure. The MC event rates displayed in Table 2 have been normalized to the data sample. This normalization is equivalent to a reduction of the Bartol neutrino fluxes by 21%. The assumption implicit with this adjustment is that the sample is devoid of oscillation effects. Figs. 1, 2 and 3 show HiRes distributions with this normalization in place.
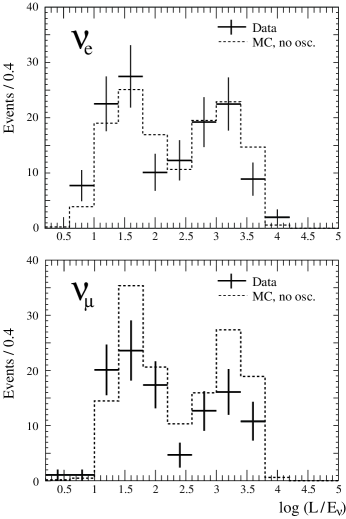
Fig. 1 shows the distributions of these samples in cosine of the zenith angle. For events, the shape of the distribution for data (Fig. 1a, crosses) coincides with that predicted by the Monte Carlo (dashed histogram) for null oscillations. The distribution of data however, falls below the MC prediction in all bins (Fig. 1b) with the relative dearth being more pronounced for ’s incident from below horizon. Distributions in for HiRes events are shown in Fig. 2. For null oscillations this variable distributes according to a ‘phase space’ which reflects the neutrino points-of-origin throughout the spherical shell volume of the Earth’s atmosphere. That is, down-going ’s populate the peak at lower from 0.0 to 2.0. Neutrinos incident from/near the horizon occur within the dip region extending from 2.0 to 2.6, while upward-going neutrinos populate the peak at higher values. Fig. 2a shows that, allowing for statistical fluctuations, the data follows the shape of the null oscillation MC distribution. In contrast, the data (Fig. 2b) falls below the null ocillation MC for all but the most vertically down-going flux.
4 (, ) ALLOWED REGION
To convert results of our atmospheric neutrino simulation generated under the no-oscillation hypothesis into simulated neutrino oscillation data, we apply to every MC event an -dependent weight representing the probability of flavor survival for a given and .
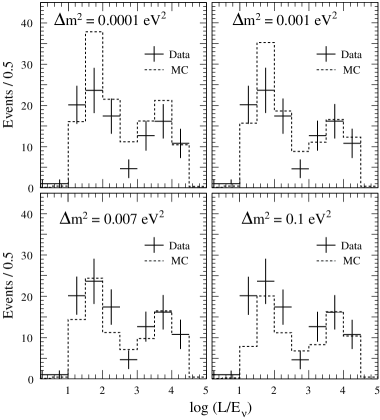
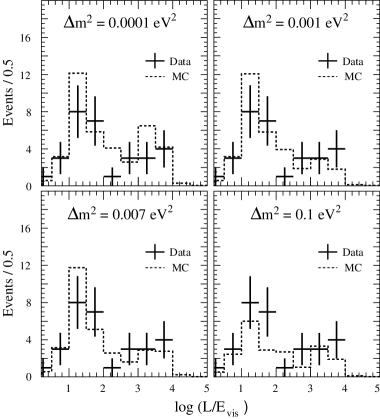
An exploratory matchup of data with trial oscillation scenarios is shown in Fig. 3. For the mixing angle fixed at unity, we plot the MC distribution weighted for to oscillations with differing settings. With (Fig. 3a), the oscillation prediction lies above the data in most bins. With (Fig. 3b), the upgoing flux is now better described by the MC, although the expectation for horizontal and down-going neutrinos remains somewhat high. With , a rough agreement overall is achieved (Fig. 3c). Going to higher , we find that for the oscillation-weighted MC falls below the data in most bins (Fig. 3d). These hints concerning the parameters regime preferred by the data are borne out by a more considered analysis, as we now show.
To determine the neutrino oscillation parameters and from our data, we construct a function over the plane-of-parameters. For points in the physical region of the plane, we fit the MC expection to our data at each point. The MC flux normalization, as well as and , is a free parameter:
| (3) | |||||
We assume that the oscillation affecting our data is purely into and that the data is unaffected.
The is summed over data bins containing our selected (HiRes) and samples, where are bins, with containing all the events. The denominator accounts for finite statistics in the neutrino Monte Carlo and for uncertainty in the rock background in the data. Not yet included are error terms which address systematic errors in the analysis, however preliminary examination shows statistical errors to be the dominant error source in the analysis. The MC counts for the bin are constructed using oscillation weight factors.
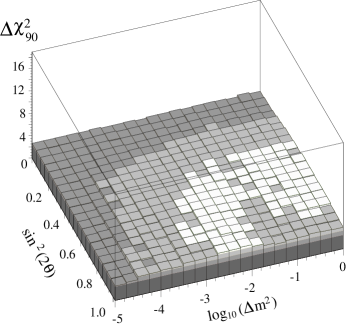
We find the location of minimum , and plot which is . The surface thereby obtained is shown in Fig. 4. A crater region of low values is clearly discerned, at the bottom of which is a relatively flat basin. The lowest point occurs at values = 0.90, , with flux normalization = 0.78.
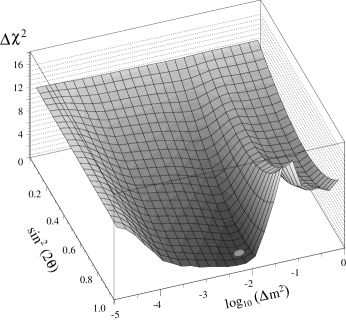
An additional structure is the ridge which occurs at large mixing angle and for above 10-2 eV2 . For oscillation solutions in this regime, depletion in the downward-going neutrino flux with sub-GeV energies is predicted for to oscillations by equation (1) arising from the first oscillation minimum. Our HiRes events have sufficient resolution to show such an effect if it would be present. However, no pronounced depletion is observed, and so the has a high value there.
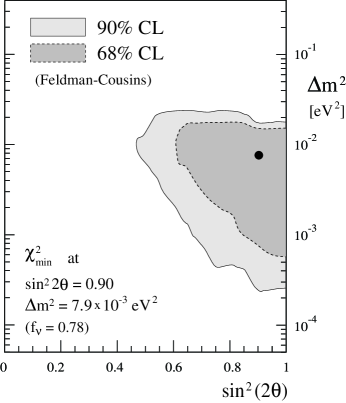
To find the region allowed for the oscillation parameters by our data at 90% confidence level (CL), we use the method of Feldman and Cousins [7]. At each of 2500 points on a grid spanning the physical region of the plane parameters, we run 1000 simulated experiments. For each of the simulated sets, we find such that is less than for 90% of the simulated experiments at . The surface defined by local over the oscillation parameters plane is shown in Fig. 5. Note that the surface is not a plane at = 4.61, but rather has a concave shape. The central shaded portion is approximately = 4.6, however the outlying regions have values which are lower. At each point over the physical region, if is less than , then belongs to the allowed region of the 90% CL contour.
The region allowed by our data at 90% CL is shown by the shaded area in Fig. 6. Although occurs at the location depicted by the solid circle, the relatively flat basin of our surface extends to lower values. SuperK has reported their best fit value to be [8]; our data is compatible with that as well as with somewhat higher values.
5 PARTIALLY CONTAINED EVENTS
We plan to include more data in the above analysis. An additional data sample is comprised of flavor events which are partially contained. For each event of this category, the primary vertex is required to be 80 cm (one hadronic interaction length) from exterior surfaces of the calorimeter, and the final state must contain a non-scattering, exiting track with ionization compatible with a muon mass. This sample is useful because the assignment of flavor is reliable to better than 98%, and because the events are relatively energetic and consequently “point well” to the incident direction. The mean energy for neutrinos which initiate PCEs is estimated to be 4.7 GeV, to be compared to a mean energy of 1.3 GeV for HiRes events. The mean angular deviation of the reconstructed direction versus the true direction (in Monte Carlo) is . Unfortunately the number of PCEs is low, less than one-third the population of our HiRes sample.
In order to isolate PCE two-prong and multiprong topologies, the data events (with MC events interspersed throughout) are processed through a software filter; those which pass are scanned. The filter is designed to eliminate downward-stopping muons which have endpoint decays. In Soudan-2, an electron from a muon decay near rangeout can give rise to a small shower of 10 hits from the end of a muon track; the topology is roughly akin to that of a neutrino-induced two-prong. Consequently care must be taken to avoid remnant up-down asymmetry in PCEs introduced by the filter. The problem is avoided by requiring that there be 20 hits from a PCE vertex which are additional to the muon track.
To mitigate against cosmic-ray induced backgrounds we require that any hit in the active shield which is coincident with a PCE, must be clearly associated with the exiting muon track. Occasionally it happens that a charged pion ejected from the cavern rock is incident upon the calorimeter. If the pion penetrates by more than an interaction length and then scatters inelastically, it can mimic a PCE topology. Background events of this type are removed by requiring the net momentum of the hadronic system of a PCE to lie within the same hemisphere which contains the candidate muon track.
With these selections we obtain 31 events for which the cosmic ray induced background is less than one event. The PCE rate predicted by our Monte Carlo with no oscillations is 40 events. The distribution of PCE data in can be compared, as done previously for contained HiRes events, to representative oscillation scenarios having = 1.0. In Fig. 7 we observe that, compared to the data (crosses) the oscillation prediction (dashed histogram) is relatively high for (Fig. 7a). However the prediction for (Fig. 7d) is too low relative to the data. Figs. 7b,c suggest that the scenario preferred by the data lies in the regime between .
6 PLANS
In the near future, we will include the partially contained events into our fit to . Additionally, a sample of upward-stopping muon events initiated by neutrino reactions below the detector has been isolated and will be analyzed for oscillation effects. And of course we will continue to accumulate and analyze new data. Our goal is to keep the Soudan-2 detector running and tuned for the change-of-beams incident at our underground site. The change will be from atmospheric ’s to Fermilab ’s in Fall 2003, at which time the detector will serve the MINOS experiment [9].
References
- [1] W.W.M. Allison et al., Nucl. Instr. Meth. A376 (1996) 36; ibid A381 (1996) 385.
- [2] W.P. Oliver et al., Nucl. Instr. Meth. A276 (1989) 371.
- [3] W.W.M. Allison et al., Phys. Lett. B 391 (1997) 491; Phys. Lett. B 449 (1999) 137.
- [4] V. Agrawal, T.K. Gaisser, P. Lipari, and T. Stanev, Phys. Rev. D53 (1996) 1313.
- [5] K. Ruddick, Soudan-2 internal note PDK-704 (1998), unpublished.
- [6] W.A. Mann, Plenary Talk at the XIX Int. Symposium on Lepton and Photon Interactions at High Energies, Stanford University, August 1999, hep-ex/9912007; T. Kafka, in: TAUP99 - Proceedings of the Sixth Int. Workshop on Topics in Astroparticle and Underground Physics, College de France, Paris, France, September 1999, Nucl. Phys. B (Proc. Suppl.) 87 (2000) 186.
- [7] G.J. Feldman and R.D. Cousins, Phys. Rev. D 57 (1998) 3873.
- [8] H. Sobel, these Proceedings.
- [9] S. Wojcicki, these Proceedings.