Cosmic ray tests of the DØ preshower detector
Abstract
The DØ preshower detector consists of scintillator strips with embedded wavelength-shifting fibers, and a readout using Visible Light Photon Counters. The response to minimum ionizing particles has been tested with cosmic ray muons. We report results on the gain calibration and light-yield distributions. The spatial resolution is investigated taking into account the light sharing between strips, the effects of multiple scattering and various systematic uncertainties. The detection efficiency and noise contamination are also investigated.
, , , , , , , , , , , , , , , , , , , , , , , , , , , , , , , ,
For the DØ Collaboration
1 Introduction
The DØ Central and Forward Preshower (CPS and FPS) detectors [1] employ scintillator strips with embedded wavelength-shifting (WLS) fibers and readout via Visible Light Photon Counters (VLPCs) [2]. The CPS has three concentric cylindrical layers of strips covering a pseudorapidity00footnotemark: 0 region of . It is located outside a solenoid coil and lead absorber, which comprise a total of two radiation lengths () at =0. The FPS consists of trapezoidally-shaped modules in front and behind a lead absorber, covering the pseudorapidity region . The preshower detectors sample the energy deposition with fine granularity, and thereby provide information for the identification of electrons and photons.
Studies of the prototype detectors comparing different construction techniques have been previously reported [3, 4]. In this paper, we report cosmic ray tests of a representative axial module of the CPS and of a FPS module, which were studied at Fermilab during three periods from August 1999 to March 2000. We first describe the apparatus and the data processing, the gain calibration of photoelectrons and the light yield for minimum ionizing particles (MIPs). The spatial resolution is investigated by examining light sharing between neighboring strips. The systematic uncertainties and effects from multiple scattering are estimated using GEANT 3 simulations [5]. Finally, the detection efficiency and noise are examined as a function of readout threshold.
2 Apparatus
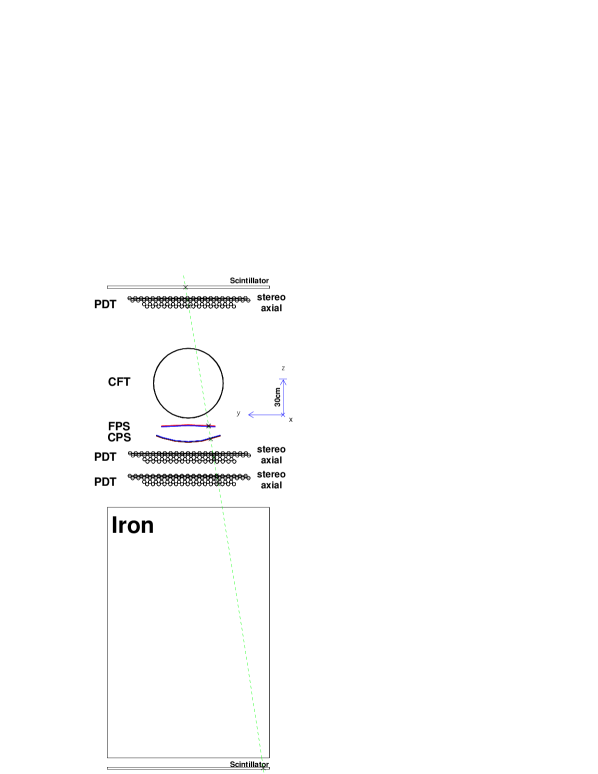
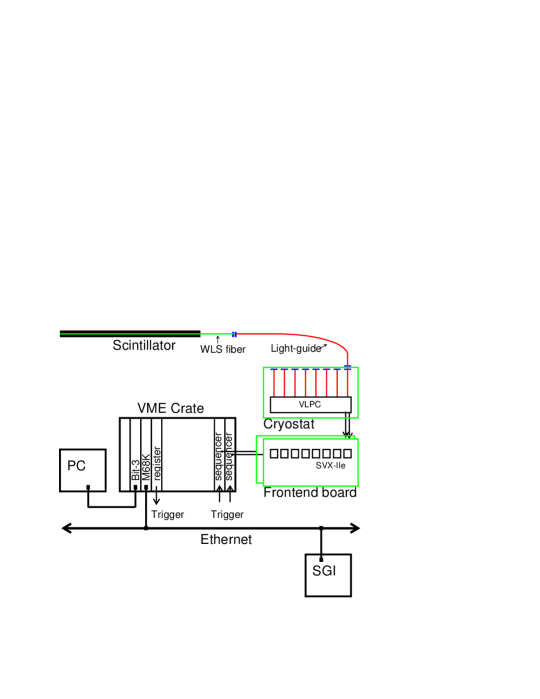
The experimental setup is illustrated in Fig. 1. Cosmic ray muons are filtered by iron blocks having a 2.5 GeV equivalent stopping power, and triggered by the coincidence of scintillation counters above and below the apparatus. The reference tracking system consists of three sets of proportional drift tubes (PDTs) [6]: each with an axial and a stereo layer of 32 tubes crossing at a angle. The trigger area is covered fully by the PDTs, which have 25 mm pitch and are 2800 mm long. The test detectors include an axial CPS module, and a FPS module. A prototype of the third cylinder of the DØ central fiber tracker (CFT) [1] is also present. Its performance is reported elsewhere.
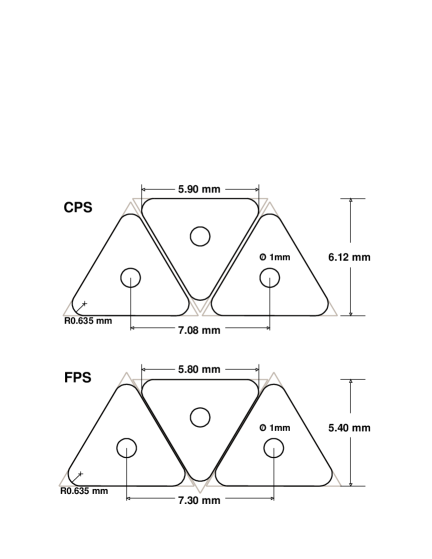
The preshower scintillator layers consist of interlocking triangular strips, as illustrated in Fig. 2. The strips of equilateral triangular cross section are made by extrusion of polystyrene plastic [7], which is doped with 1% p-terphenyl and 150 ppm diphenyl stilbene, similar to the Bicron [8] BC-404 scintillator. Each scintillator strip is wrapped in aluminized mylar for optical isolation. The packing density is different for the CPS and the FPS modules, which results in different layer thickness and strip pitches. The strip pitch is 3.54 mm for the axial CPS module and 3.65 mm for the FPS.
Embedded at the center of the scintillator strip is a WLS fiber which collects and directs the light to the edge of the module, where a clear light-guide fiber transports light to the input of the VLPC. The WLS fibers are Kuraray [9] Y-11 (250 ppm concentration) multi-clad fibers of 835 m diameter. The non-readout ends are silvered for better light collection. The clear fibers are Kuraray multi-clad S-type fibers of 835 m diameter, and the lengths used in this test are 11 m and 13.5 m.
The CPS module is an octant of a cylinder of average radius 721.5 mm containing one layer of 160 scintillator strips that are 2412 mm long. The WLS fibers of half the strip length are inserted from both ends of the strips, meet in the middle, and thus they divide the module into the north and the south segments for readout. Each segment has the middle 64 strips connected to the readout system. The scintillator strips are aligned with the axial PDT tubes. The strip positions at the module edges differ in vertical () direction by 55 mm from the strips at the center of the module.
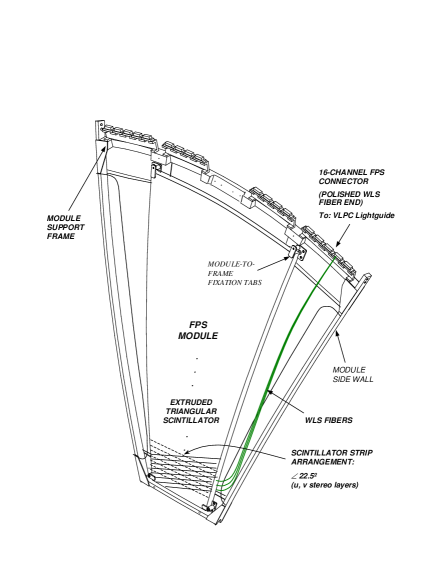
The FPS module (illustrated in Fig. 3) has two scintillator layers (denoted by and ); each has 144 strips of lengths between 104 mm to 293 mm. The upper 128 strips are connected to the readout. The strips of the FPS- layer are aligned to the axial PDT and the strips of the FPS- make a 22.5∘ angle with the -layer strips. The scintillator layers have a curvature of average radius 2540 mm, and the strip positions in vary by a maximum of 12 mm.
The signals are processed through VLPC cassettes located in a cryostat container maintained at 9 Kelvin [10]. VLPCs are solid state photodetectors with a high quantum efficiency and gain. The quantum efficiency is bias-voltage dependent and is reported by the manufacturer to plateau at 80% at WLS wavelengths. Likewise, the gain is voltage dependent. At the operating voltage used in this paper, the gain ranges from 25000 to 50000.
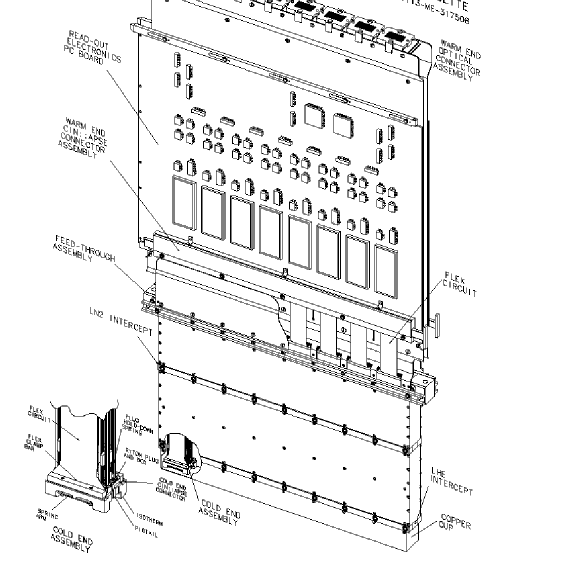
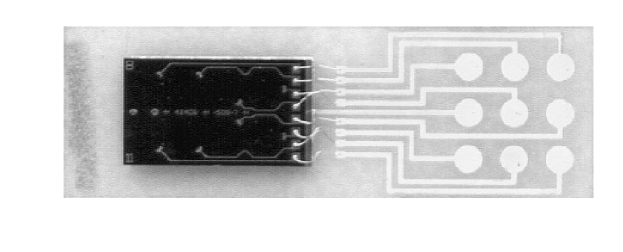
The VLPC assembly and the readout electronics are illustrated in Fig. 4. A VLPC cassette has eight readout modules, each of which is attached to one bundle of clear fibers containing 128 fibers. A VLPC module consists of two columns of VLPC chips, each chip has 8 pixels (shown in Fig. 6), and the column of 8 chips (64 pixels) is connected via a flex cable to a packaged SVX-IIe [11] chip mounted on a front-end board. Two front-end boards are employed, each having 8 SVX chips.
The SVX chip has 128 channels, of which 64 channels are employed. The signal from the VLPC is processed through a preamplifier, an analog pipeline, a pedestal comparator, and a Wilkinson 8-bit ADC. The digitized signals are sent to a stand-alone sequencer [12] in a VME crate. The SVX chip is configured for readout of all channels and the preamplifier dynamic range is set for 120.2 fC (0.47 fC/ADC). The data acquisition system consists of a VME 68k CPU board and a SGI workstation running a DART[13] based program. The readout electronics and the data flow are illustrated in Fig. 6.
3 Data processing
3.1 SVX pedestal
The SVX data are corrected for pedestal values and for common-mode shifts. Within the same SVX chip, the pedestal values of the 64 readout channels are quite uniform, with the standard deviation from the mean being typically a few ADC counts. The common-mode shift is the pickup from low frequency noise that shifts the pedestal. It is calculated for each event excluding channels that may contain a signal ( above pedestal). The mean values of the pedestals for all the 16 chips are plotted in Fig. 8.a. The standard deviation on the mean pedestal, which reflects the significance of the common-mode shift, is presented in Fig. 8.b. It is observed to be on the order of one to three ADC counts.

3.2 Timing of cosmic ray trigger
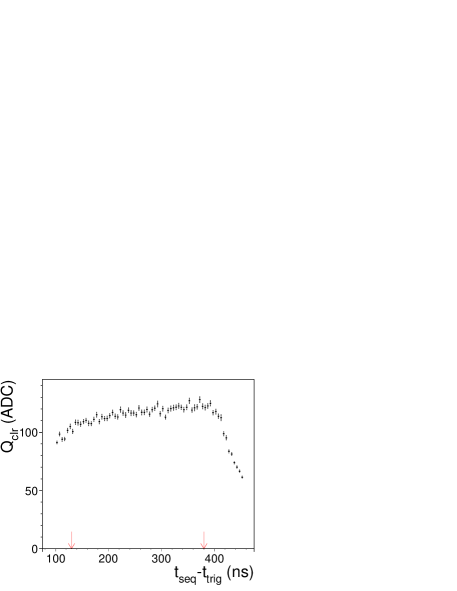
The SVX-IIe circuits perform sequential sampling of the preamplifier output, and feed one of the 32 storage capacitors in the analog pipeline. The clock cycles are produced by a stand-alone sequencer at 396 ns intervals, and the cosmic ray triggers are randomly distributed within the clock cycle. The difference in time between the event trigger and the beginning of the SVX data acquisition cycle is recorded by a TDC module. The signal contained within a pipeline capacitor (shown in Fig. 8) has a relatively flat plateau extending over 250 ns. Event selection requires the TDC stamp to be within the interval between 130 to 380 ns.
4 VLPC calibration
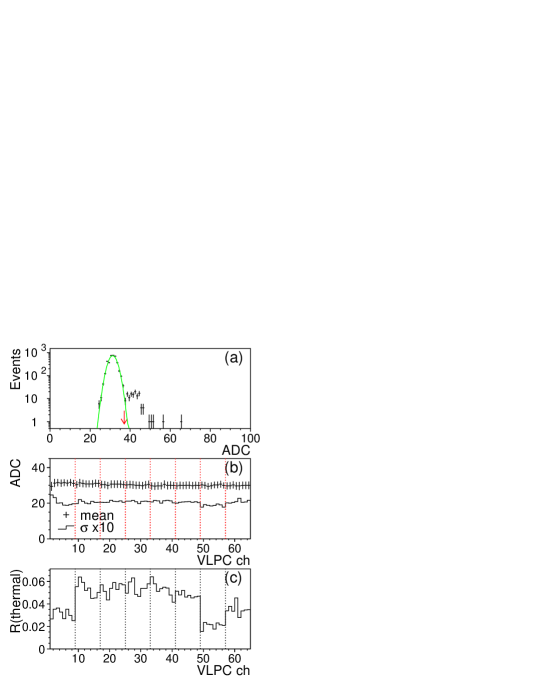
The VLPC chips used within a module have similar gain and quantum efficiency. A typical distribution for output from a VLPC pixel (without input) is shown in Fig. 9.a, where the pedestal peak is fit to a Gaussian function, and the arrow indicates the threshold separating the pedestal from signals originating from thermal electrons. The pedestal width is typically 2 to 3 ADC counts, equivalent typically to 0.3 photoelectrons.
The 64 channels on each side of a VLPC module have a common bias and the signals are processed by the same SVX chip. The mean and width of each Gaussian fit to the pedestal are plotted in Fig. 9.b. The bias voltage is chosen to attain high quantum efficiency and low noise; but the optimum deviates chip-by-chip, as reflected in the fraction of events that have signals from thermal electrons (Fig. 9.c). The fraction of thermal electrons, typically kept at around 5%, provides an indication of proper biasing.
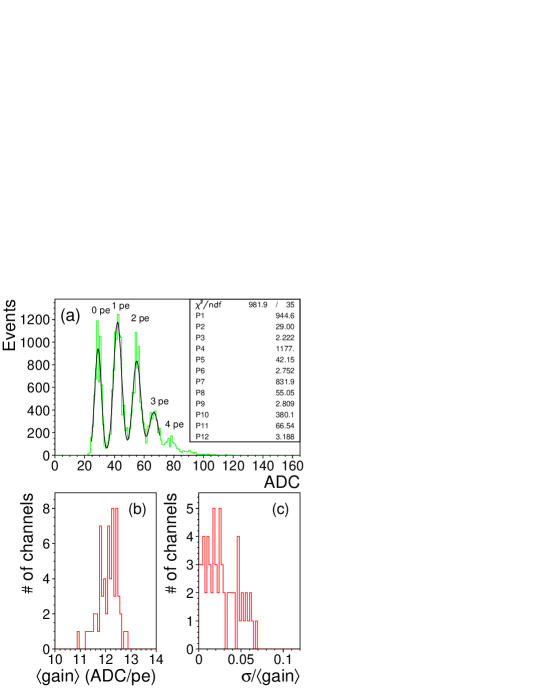
The gain calibration for photoelectrons is performed with a LED device. The LED light is diffused through a bundle of clear fibers located above 250 mm long rectangular tubes mounted on the warm-end connection to the VLPC. Each tube is matched to one VLPC module. Several LED pulser configurations were used in the calibration procedure to obtain distributions with varying numbers of photoelectrons. A typical distribution for a moderate light yield, fitted to a distribution of four Gaussians, is shown in Fig. 10.a. The clearly separated peaks correspond to the pedestal and observation of up to five photoelectrons.
The peak-to-peak uniformity of photoelectron gain for each channel is obtained from the four Gaussians of the fit. The photoelectron gains are derived from the differences between adjacent Gaussian means. The average gain and the standard deviation are calculated. Results from the 64 channels of a typical SVX readout are presented in Figs. 10.b and c, respectively. The VLPC pixels have compatible gains of around 12 ADC counts per photoelectron, and the standard deviations are all within 5%.
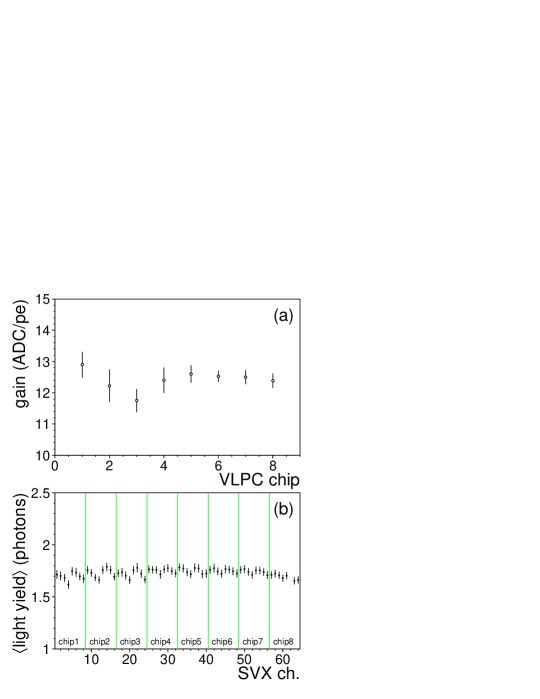
The photoelectron gains within pixels of the same VLPC chip are uniform to within 2% and are grouped together during the calibration phase. The means with standard deviations are plotted in Fig. 11.a for the 8 chips of a typical SVX readout. The light yield from the calibration is calculated from the number of photoelectrons, weighted by the Gaussian areas of the fit, and plotted for each pixel in Fig. 11.b. The yield is reasonably uniform over all pixels. The incident LED light has slightly higher intensity in the central region of the VLPC module, and the deviation seen every four channels corresponds to the positions of pixels located between the center and the edge of the module.
5 PDT track reconstruction and cosmic ray selection
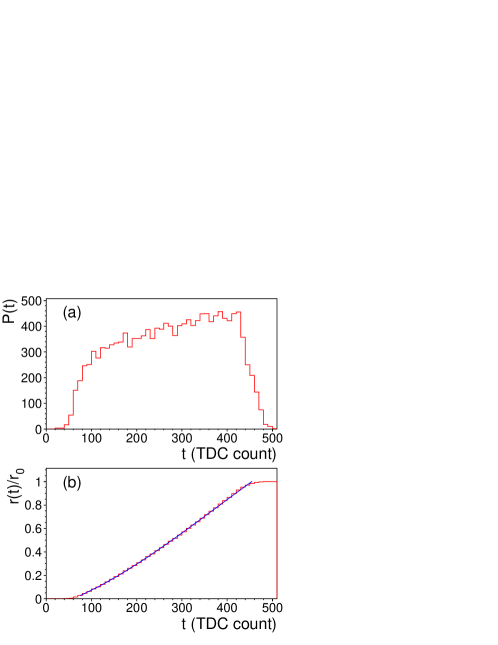
The PDT data that provide reference tracking are processed independently of the VLPC data stream. A typical PDT drift time distribution is shown in Fig. 12.a. The cosmic ray muons are distributed approximately uniformly across the tube. The higher event fraction at larger drift times indicates a slower drift speed for ionization charge produced at large distances from the anode. The integrated event fraction, , as a function of drift time, shown in Fig. 12.b, is fit to a third order polynomial, and is used for calculating the time-to-distance function. For a given drift time , the distance to the anode is
| (1) |
where is the tube radius. The position where the track traversed the PDT is calculated, first, assuming a vertical track, and iterated after the track fitting is performed to correct for the incident angle.
The PDT diameter is 30 mm, the offset between adjacent tubes is 25 mm in the horizontal -axis, and 20 mm in the vertical -axis. A large fraction of the tracks passes through a PDT layer hitting just a single tube, which introduces a two-fold () ambiguity for the drift direction. Each direction is tried, and the one with the best value for the linear track is selected.
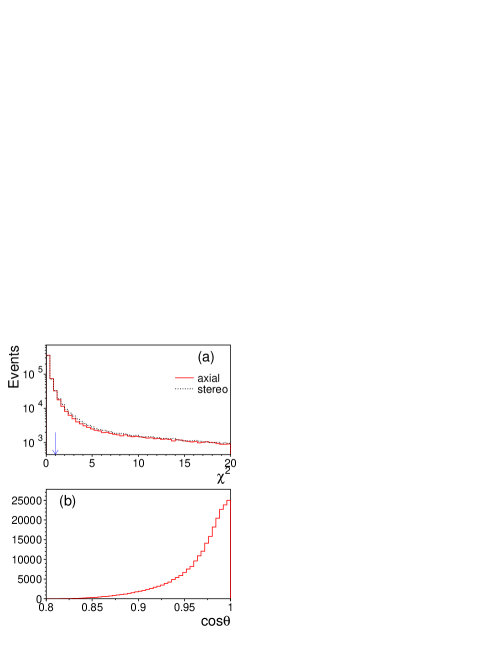
An unweighted linear fit [14] is performed to the PDT hit positions in versus the anode position in . The distributions obtained for fits to the axial and stereo layers are plotted in Fig. 13.a. Events containing a single track are selected if both values are smaller than one. The selected tracks on average have four hits, and the distribution for the polar angle to the -axis is plotted in Fig. 13.b. The -coordinate of the three-dimensional (3-D) reference track is derived from the fit to axial PDT hits, and the -coordinate comes from the fit to stereo hits.

6 Preshower MIP light yield
6.1 Strip cluster
The triangular scintillator strips are stacked such that the fraction of vertical tracks traversing two strips is 67% for the CPS and 62% for the FPS. The SVX outputs are in units of ADC counts, and are first converted to number of photoelectrons (pe). The SVX channel numbers are mapped to the sequence of the strip layout. A strip cluster for a traversing track is reconstructed requiring:
-
i.
a channel with maximum light yield larger than 2 pe,
-
ii.
adjacent channels with descending values of signal above a cutoff threshold of 0.7 pe,
-
iii.
and a total cluster light yield, , to be larger than 3 pe.
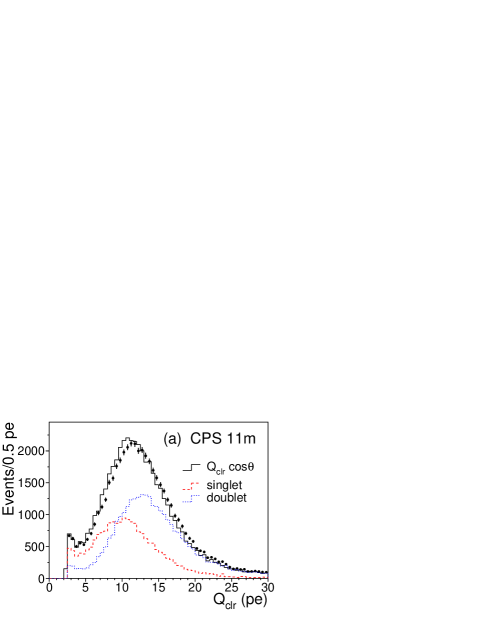
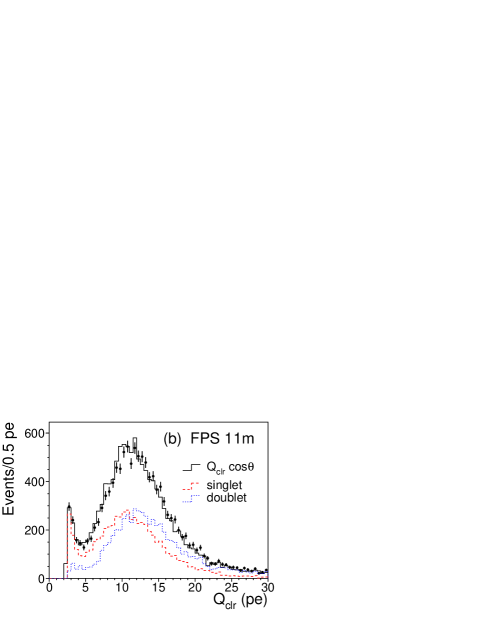
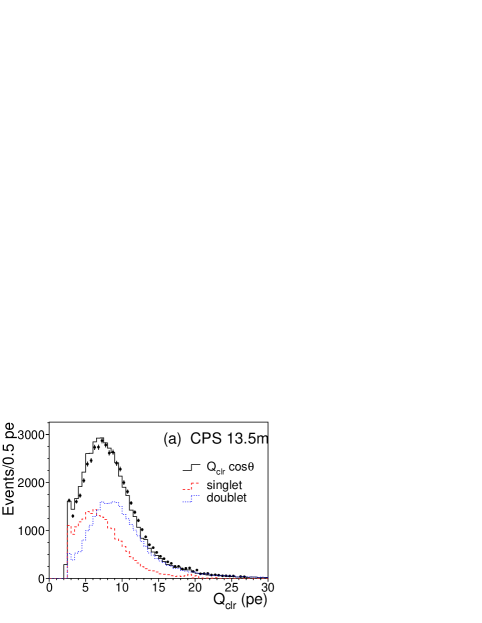
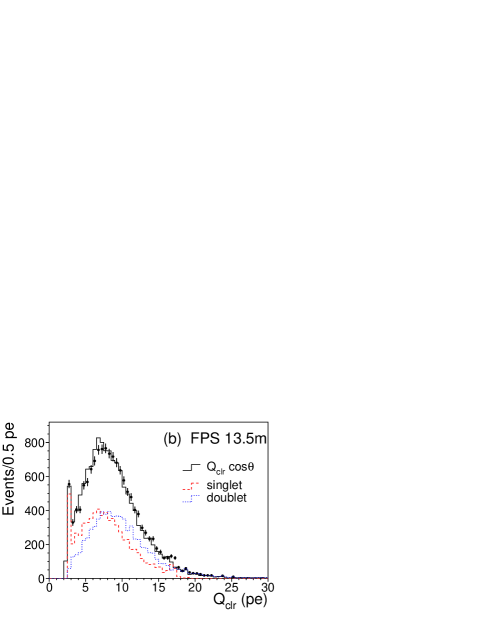
The distributions in the number of strips contained in a cluster are shown in Fig. 14. The cluster light yield observed for cosmic ray muons is uniform over the readout channels. The light-yield spectra obtained with 11 m clear fibers are plotted in Figs. 15.a and b, for the CPS-south segment and the FPS- layer, respectively. Similar spectra obtained with the 13.5 m clear fibers are plotted in Fig. 17. Contributions from single (singlet) and two-strip (doublet) clusters are shown by the dashed and dotted lines, respectively. The fraction of doublets with 11 m clear fibers is 61% for the CPS and 53% for the FPS, which is about 10% lower than the geometric fractions caused by the low light yield and selection cutoffs for muons traversing the corners of the strips. The average polar angle of tracks is about (Fig. 13.b), corresponding roughly to a 4% longer distance in the scintillator than along the vertical direction. The light yields, normalized to vertical tracks, are shown by the solid lines.
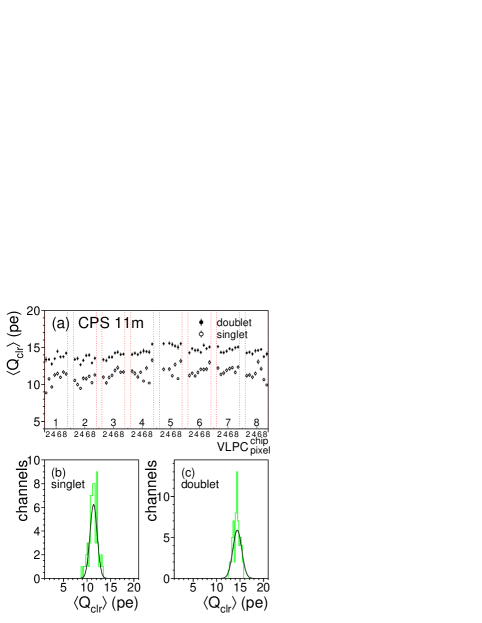
The average light-yield profile versus the fiber number of the cluster center, for the CPS with 11 m clear fibers, is shown in Fig. 17.a. The light-yield uniformity depends on the quality of scintillator strips, WLS and clear fibers, and the quantum efficiency of VLPC chips at the same bias voltage. The light yield tends to be correlated with VLPC chip in levels, which is a indication for the difference in quantum efficiency. Singlet clusters have lower light yield, in part due to the smaller depth of scintillator. The distributions of average light yield for singlets and doublets are shown in Figs. 17.b and c, respectively, and fitted to Gaussians. Results of the fits for the CPS and the FPS with 11 m and 13.5 m clear fibers are presented in Table 1. The standard deviations obtained are in general less than 10% of the mean. The singlet light yields are about 20% lower than those for doublets.
The light collection is improved with optical grease applied at the end-faces of the clear fibers. The mean light yield was compared to that in a setup without grease. Applying Bicron BC-630 optical grease at one end of the clear fibers increases the mean yield by about 7%. When grease is applied at both ends, the mean increases by 14%. Light attenuation along the scintillator strips is studied for the CPS module as a function of PDT track position in . The loss due to attenuation is about 10% over the 1206 mm strip length.
| Detector | clear-fiber | singlet | doublet | ||
|---|---|---|---|---|---|
| length (m) | mean (pe) | /mean | mean (pe) | /mean | |
| CPS-south | 11 | % | % | ||
| FPS- | 11 | % | % | ||
| CPS-north | 13.5 | % | % | ||
| FPS- | 13.5 | % | % | ||
6.2 Cross talk and delta-rays
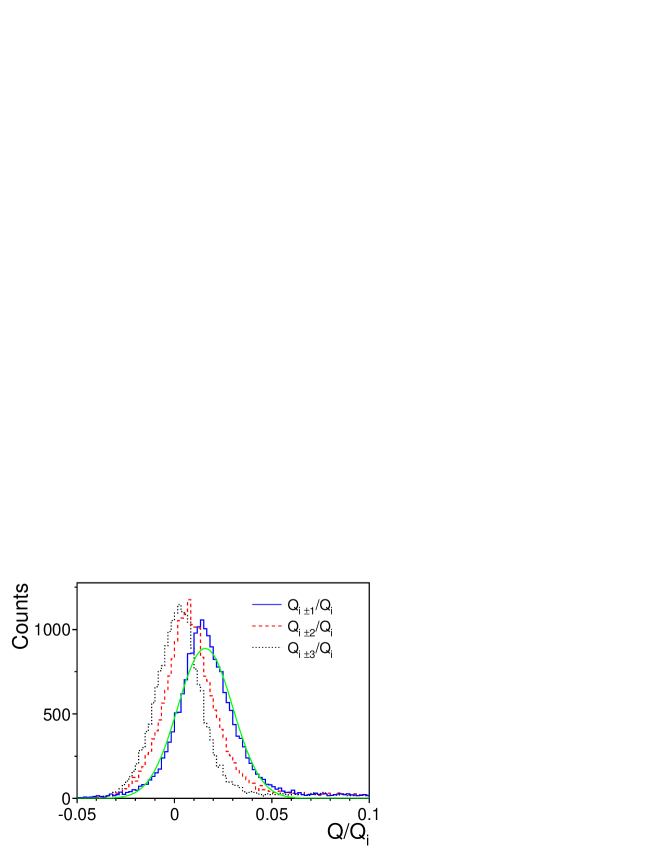
Cross talk in the electronics and between the traces on the flex cable was investigated for channels with light yield larger than 10 photoelectrons. The charge seen in adjacent channels, normalized to the one selected (), is plotted in Fig. 18. A Gaussian fit to the distribution gives a mean of 1.6% with a standard deviation of 1.4%. The clear fiber connections are arranged such that adjacent scintillator strips are read out through non-adjacent electronic channels, thereby decoupling cross talk between adjacent electronic channels from light leakage or delta-rays crossing adjacent strips.
The same analysis was made for channels further away from the selected one. The distributions for cross talk to two () and three channels () away from the central one, have Gaussian means of 0.7% and 0.2%, respectively, and standard deviations of 1.4% and 1.2%. The magnitude of the cross talk is observed to be similar for all channels. The flex cable is designed for minimum heat transfer from the cold end in the VLPC cassette to the front-end board at room temperature. Cross talk between the traces is anticipated, and the small value observed is within design tolerance.
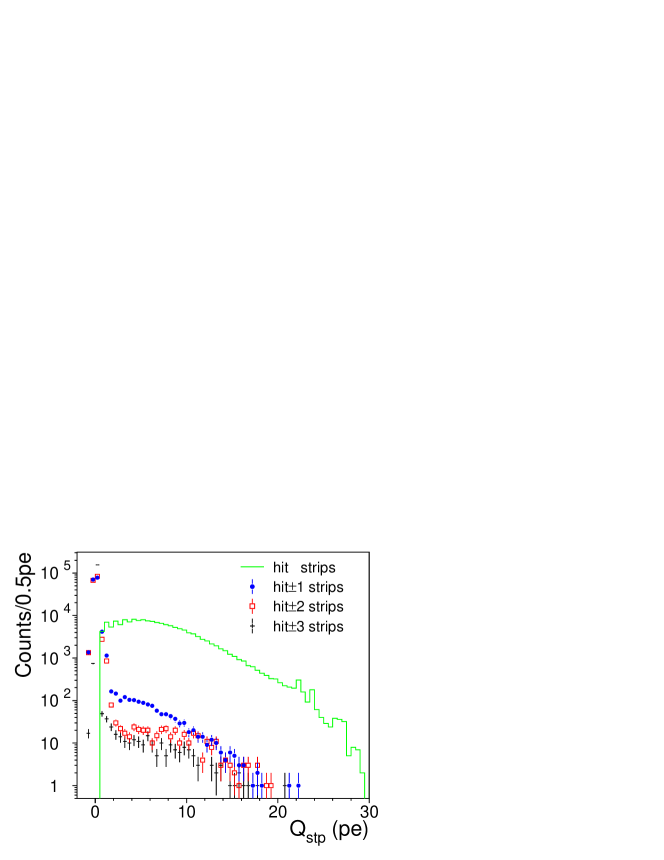
Light leakage between scintillator strips and clear fibers as well as delta-ray contributions were investigated using clusters containing two or more strips. The two adjacent strips with the most light deposition are denoted as the hit-strips which the muon traversed. The light-yield spectra for individual strips () are plotted in Fig. 19. At a threshold of 2 photoelectrons, the cumulative event fraction for the strips adjacent to the hit-strips (hit) is 0.85%, indicating a negligible light leakage between strips and clear fibers. Occasionally the adjacent strips can have large light deposition, and the event fraction decreases slowly with the distance to the hit-strips. The cumulative event fractions (above 2 photoelectrons) observed in strips two and three strips away from the hit-strips are 0.25% and 0.15%. These are most likely events containing delta-rays generated upstream. These event fractions for different CPS and FPS modules are consistent with each other.


7 Spatial resolution
7.1 Strip cluster position
The triangular shape of the scintillator strips is a convenient configuration for reconstructing the position of a particle that passes through two strips. The distance traversed by the track in each strip has a linear correspondence to the incident position. The cluster position can therefore be calculated by using the charge-weighted mean of the strip centers. The light sharing between two neighboring strips is expressed by the ratio
| (2) |
where and are the strip signals of the right and left channels of a doublet cluster. If a cluster contains more than two strips, possibly from a delta-ray or thermal noise, then and are the sum of channels on the right and left of the charge weighted mean.
The distribution in and total yield in cluster light as a function of are plotted in Fig. 20 for the CPS with 11 m clear fibers. Muon tracks are assumed to be distributed uniformly across a strip. In the ideal case, one would anticipate a uniform distribution in . The round-offs near =0 and 1 correspond to regions of low light yield and to the individual strip threshold of 0.7 photoelectrons that removes tracks traversing a corner of a strip. Clusters of more than two strips account for about 6% of the total events. The contamination from thermal electrons can be suppressed by a higher cutoff threshold, which produces a wider gap at =0 and 1, and the tradeoff of having more singlet clusters.
The cluster position for doublets is derived for the light sharing by
| (3) |
where is the strip pitch and the center of the right-hand strip. The distributions of cluster position relative to the closest strip center (), in units of the strip pitch, are shown in Fig. 21. Singlet clusters, which would fall at in this algorithm, are not plotted. The CPS and FPS modules with 13.5 m clear fibers have lower light yields, and the strip cutoff threshold therefore creates a wider gap at near . The shape reflects the combined effects of the geometry and the Poisson statistics of low light yield near a strip corner.
Spatial resolution is investigated with respect to hit positions given by the PDT track. The strip cluster position is corrected for alignment relative to the PDTs, which includes the offsets and rotations of strip positions. The preshower strips are mounted on cylindrical platforms, and the strip pitch and position are therefore corrected accordingly. The dominant systematic uncertainties arise from the effects of multiple scattering and strip alignment. The effects are seen in Fig. 22 which shows the difference between the PDT track position and the center of the strip where a cluster is found. A uniform distribution would be expected for ideal resolution with the doublet component of the distribution looking similar to Fig. 21 and the singlet component filling the central gap.
| /ndf | (mm) | (mm) | |||
|---|---|---|---|---|---|
| CPS (11m) | singlet | 53/32 | |||
| CPS (11m) | doublet | 28/30 | |||
| CPS (11m) | combined | 32/30 | |||
| CPS (13.5m) | singlet | 36/34 | |||
| CPS (13.5m) | doublet | 48/30 | |||
| CPS (13.5m) | combined | 54/32 | |||
| FPS (13.5m) | singlet | 37/42 | |||
| FPS (13.5m) | doublet | 43/38 | |||
| FPS (13.5m) | combined | 37/40 |
7.2 GEANT simulation and spatial resolution
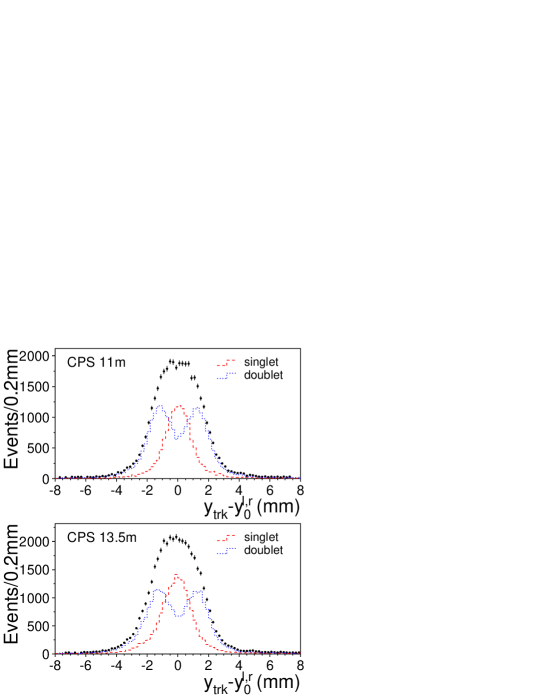
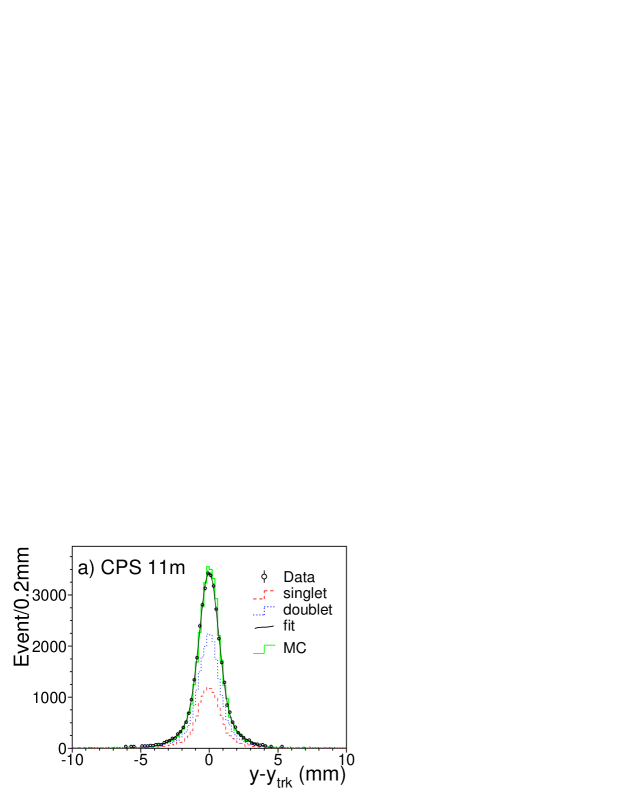
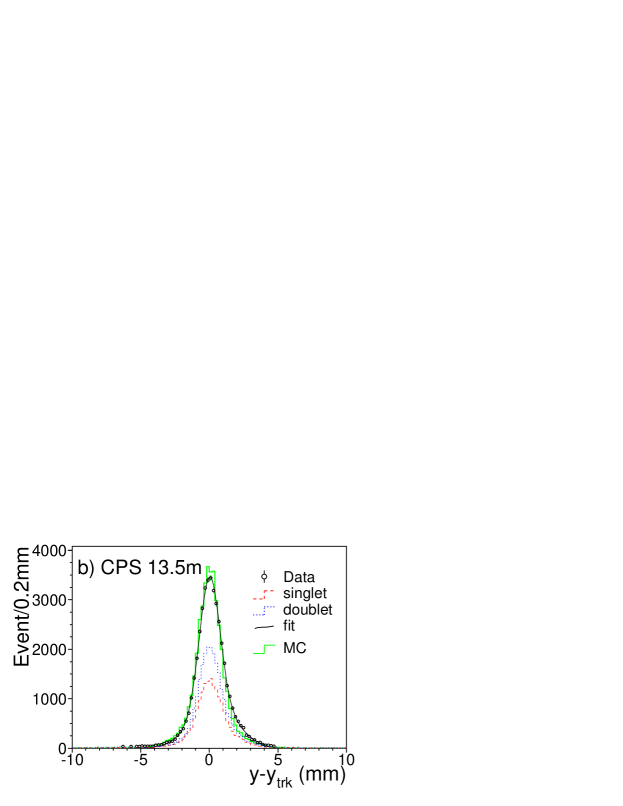
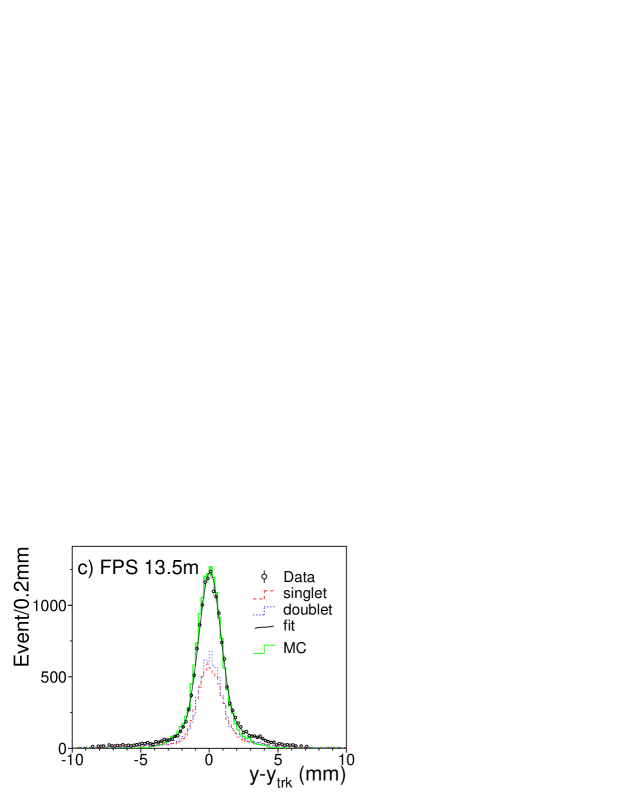
The residuals for the positions of preshower clusters relative to the PDT tracks are plotted in Fig. 23 for the CPS with 11 m and 13.5 m clear fibers, and for the FPS- (axial) layer with 13.5 m clear fibers. The curves are fits of double-Gaussian shapes to the data. The parameters from the fits are listed in Table 2. Results of separate fits to singlet and doublet contributions are also listed in Table 2.
The widths of the narrower Gaussians are used to define the detector resolution. The wider Gaussians are employed to obtain good fits in the tails. The lower light yield for the CPS with 13.5 m clear fibers gives wider residuals than those with 11 m clear fibers. The FPS has wider strip pitch and more singlet events, which also result in wider distributions. The small asymmetry seen in the distributions is caused by the offset of trigger counters from the muon direction. The dominant systematic uncertainties are contributed by multiple scattering and strip alignment. The uncertainties in the survey of the strip positions in and the straightness of the strips have a large effect on the precision of the PDT track position. The relative contributions of these factors are evaluated using a GEANT simulation.
The GEANT simulations calculate the ionization energy loss of the muon and use default energy cutoffs (1 MeV) for bremsstrahlung photons and electrons. A detector hit is assigned at the mean of the entrance and exit positions in an active volume. To account for momentum dependence, the cosmic ray muon momentum spectrum at sea level [15, 16] is generated and the filtering by the iron block is taken into account. The incident muon angle is sampled according to that observed in the data. The angular deflection by multiple scattering is calculated using Molière theory [17, 18, 19, 20]. Detector resolutions are approximated by Gaussian smearings of the hit positions for preshower detectors as well as for PDT hits. The Gaussian widths representing detector resolutions are obtained through a minimization of the simulated residuals relative to those in the data.
The PDT hits are assigned and processed independently in the same way as the data, using the same event selection criteria and cutoffs. The width of the Gaussian smearing applied to the PDT hits is 470 m, which is 6% lower than the nominal value [6]. The combined effect on the precision of the reference track positions from multiple scattering and the smearing of the PDT hits is estimated to be 380 m for the CPS and 390 m for the FPS. The muon momentum spectrum at sea-level as measured by different experiments has large uncertainties [21]. The uncertainty in the muon momentum spectrum contributes a 2% systematic error to the resolution analysis.
The preshower light yield is simulated so as to resemble the data, with the light yield spectrum generated as a function of the length of scintillator traversed by the muon. For doublet events, the spatial resolution is well described by a Gaussian smearing at the hit position, and the width is determined by adjusting it until the simulated residuals agree with the data. The singlet events are assigned randomly over the geometric acceptance at the strip center (Fig. 21), which corresponds to a Gaussian distribution of about 400 m in width. The simulated residuals have an approximately Gaussian shape with a width of 620 m. Gaussian smearing is also applied to singlets, and the spatial resolution is obtained from a quadratic sum of the widths for the geometric acceptance (400 m) and this Gaussian smearing.
The spatial resolutions estimated for ideal alignments are listed in Table 3, where the combined resolutions are given by the weighted sum of singlet and doublet resolutions. The uncertainties in strip alignment and position in make large contributions to the residual distributions in the data. The total is estimated to be 200 m predominantly from the 1 mm inaccuracy in the strip position in . To account for the geometric uncertainties, strip positions in the simulations are smeared by a Gaussian of 200 m in width. The residual distributions seen in the data are reproduced when the geometric uncertainties are combined with the uncertainties in the PDT track positions and the preshower resolutions listed in Table 3. The best result is 510 m for the CPS doublet events using 11 m clear fibers. The larger light yield gives a better signal-to-noise ratio and smaller cutoff effect from VLPC quantization for photoelectrons. The systematic error is estimated to be 10%, and is dominated by uncertainties in the alignment effects.
| Ideal geometry (m) | Uncertainty =200 m (m) | ||
|---|---|---|---|
| CPS (11m) | singlet | ||
| CPS (11m) | doublet | ||
| CPS (11m) | combined | ||
| CPS (13.5m) | singlet | ||
| CPS (13.5m) | doublet | ||
| CPS (13.5m) | combined | ||
| FPS (13.5m) | singlet | ||
| FPS (13.5m) | doublet | ||
| FPS (13.5m) | combined |
8 Detection efficiency
The detection efficiency of the preshower detectors is studied relative to the PDT track position in a region 50 mm away from the ends of strips. The CPS strips are searched for a hit at the expected position. If a predicted hit is found, for example, on the CPS-north segment, noise clusters are counted for CPS-south. The FPS hits are examined in a similar way in an overlapping region of the two layers. When a hit is found in one layer, the other layer is searched for a hit. A noise cluster is defined if the PDT track is far from the FPS module. The noise contamination and the efficiency for detecting minimum ionizing particles are studied as functions of the threshold set on the yield for the strip cluster. Plotted in Fig. 24, as a example, are the distributions obtained for the CPS segments with 11 m clear fibers, and the FPS layers with 13.5 m clear fibers. Several combinations of VLPC modules and clear fiber lengths have been tested and the results for the CPS and the FPS are compatible.
The occurrence of noise clusters depends on the VLPC gain and the contribution from thermal electrons. The distributions shown in Fig. 24.a for the CPS segments are obtained with low-gain chips (9 ADC/pe) and on average below 5% of events originated from thermal electrons. The VLPCs used for the FPS module have moderate gains (12 ADC/pe) and higher fractions of events with thermal electrons (5%), and the noise contamination increases significantly below a cluster threshold of 3 photoelectrons.
The detection efficiency for minimum ionizing particles depends on the light yield. In Fig. 24.b the CPS and the FPS results are obtained with clear fibers of 11 m and 13.5 m in lengths, respectively. The mean light yields for singlets are approximately 11 and 8 photoelectrons, respectively. At a cluster threshold of 3 photoelectrons, the detection efficiencies of both CPS and FPS have reached 99%. As the cluster threshold increases, the loss of CPS efficiency is much less than that for FPS. The effect of having a defective channel can be seen for the FPS- layer. The reduced efficiency is roughly proportional to the geometric fraction of singlets in a strip.

9 Conclusion
The DØ preshower modules, tested with cosmic ray muons during three periods spread over six months time, have shown a long-term stability with consistent MIP light yields from three VLPC cassettes. The mean light yields obtained with 11 m clear fibers is 12 photoelectrons for singlet clusters and 14 photoelectrons for doublet clusters, and the strip-by-strip uniformity is better than 10%.
The triangular cross section of the scintillator strips allows a convenient configuration for the reconstruction of track positions. The spatial resolution is about 15% of the strip pitch. For the CPS doublets, with a mean light yield of 14 photoelectrons, the spatial resolution is found to be m. The MIP signals are well separated from electronic noise and signals of thermal electrons. At low light-yield thresholds, a 99% detection efficiency can be achieved with only a few percent noise contamination.
Acknowledgements
We wish to thank our colleagues on DØ for their essential contributions. We would like to express our gratitude to Prof. T. Ferbel for stimulating discussions and careful reading of the manuscript. We acknowledge technical assistance provided by the DØ department of the Fermilab Particle Physics Division. This work was supported by the U.S. Department of Energy and the National Science Foundation.
References
- [1] S. Abachi et al., FERMILAB-PUB-96-357-E, October 1996.
- [2] D. Lincoln, Nucl. Phys. B (Proc. Suppl.) 78 (1999) 281, and references therein.
- [3] M. Adams et al., Nucl. Instr. and Meth. A 366 (1995) 263.
- [4] M. Adams et al., Nucl. Instr. and Meth. A 378 (1996) 131.
- [5] GEANT Version 3.21 (October 1994); R. Brun et al., CERN DD/EE/84-1 (September 1987), CERN Program Library Long Writeup W5013 (October 1994).
- [6] Yu.M. Antipov et al., Nucl. Instr. and Meth. A 297 (1990) 121.
- [7] A. Pla-Dalmau et al., FERMILAB-CONF-99-095, April 1999.
- [8] Bicron Corporation, 12345 Kinsman Road, Newbury, OH, 44065, USA.
- [9] Kuraray Intl., 200 Park Ave, New York, NY 10166, USA.
- [10] T.H. Gasteyer and P.D. Wheelwright, FERMILAB-PUB-97-255, July 1997.
- [11] R. Yarema et al., FERMILAB-TM-1892, October 1996, and references therein.
- [12] M. Utes, DØ Engineering Note 3823.110-EN-504, March 1999.
- [13] Online system developed by the Online System Department, Fermilab Computing Division, FNAL PN509, July 1998.
- [14] M. Metcalf, LFIT, CERNLIB E250, November 1984.
- [15] O.C. Allkofer et al., Phys. Lett. 36B (1971) 425.
- [16] M.P. De Pascale et al., J. Geophys. Res. 98 (1993) 3501.
- [17] G.Z. Molière, Z. Naturforsch. 2a (1947) 133.
- [18] G.Z. Molière, Z. Naturforsch. 3a (1948) 78.
- [19] H.A. Bethe, Phys. Rev. 89 (1953) 1256.
- [20] W.T. Scott, Rev. Mod. Phys. 35 (1963) 231.
- [21] See, for example, discussions in S. Cecchini and M. Sioli, DFUB-99-26(hep-ex/0002052), 5th School on Non-accelerator Particle Astrophysics, Trieste, Italy, 1998.