TOP QUARK MASS MEASUREMENTS AT THE TEVATRON
Abstract
The general strategy, as well as channel-specific details, applied to the measurement of the top quark mass at the Tevatron in Run I are reviewed, and the combination of the results obtained by the CDF and DØ collaborations presented. The accelerator and detector upgrades for Run II are described, and expected improvements in the systematic uncertainties on the measurement evaluated.
1 Introduction
The mass of the top quark is a fundamental parameter of the standard model. Its precise measurement will not only improve understanding of the model, but in combination with other experimental data it will also allow to further check the model’s consistency. In addition, combined with the mass measurement, it can be used to constrain the mass of the Higgs boson.
This paper is organized as follows: Section 2 addresses top quark production and decay topologies at the Tevatron; top-quark mass measurements performed in Run I are reviewed in Section 3, and the combined CDF and DØ result is given in Section 4. This is followed in Section 5 by a description of accelerator and detector upgrades for Run II, and in Section 6 by the prospects for reduction of systematic uncertainties on the mass measurement. Conclusions are drawn in Section 7.
2 Top Quark Production and Decay at the Tevatron
At the Tevatron, top quarks are produced mainly in pairs. At , about 90% of the cross section is due to annihilation and 10% to gluon fusion. The production cross section has been measured by both the CDF[1] and DØ[2] collaborations to be , and , respectively. These results are in good agreement with the theoretical predictions[3], which range from to . Single top quarks can also be produced in electroweak processes, but due the smaller cross sections and larger backgrounds, these have not yet been observed.
Because of its large width, the top quark decays to a quark and a boson before it hadronizes. The various possible boson decays determine the separate channels for mass measurement: events in which both bosons decay hadronically comprise the “all hadronic” channel, and account for 44 % of all produced events. Events in which one or both of the bosons decay to or form the “lepton+jets” ( 30 %) and “dilepton” ( 4.9 %) channels, respectively. Events in which one or both bosons decay to are not used in the mass and cross section measurements.
3 Top-Quark Mass Measurements
3.1 General Strategy
While different experiments and different channels require specific analyses, these measurements have enough in common so that one can speak of a general strategy to extract the mass of the top quark from data. This involves four steps:
-
•
Apply a set of criteria to select the candidate sample, while being careful to choose cuts that introduce little bias in the extracted mass.
-
•
Fit each event’s kinematics to the top quark pair production hypothesis, extracting a fitted top-quark mass .
-
•
Signal distributions are generated for many values of , and a likelihood () fit is used to compare the measured distribution to summed signal and background distributions for each value of . The fit determines the relative contributions of signal and background.
-
•
Fit the obtained versus , and extract the mass at the minimum of .
In all cases, signal distributions have been generated using the HERWIG[4] Monte Carlo generator. The background is dominated by multiple-jet production and the production of a boson in association with additional jets. The former is derived from data while the latter is modeled using the VECBOS[5] event generator.
3.2 All-Hadronic Channel
Only CDF has published a mass measurement[6] in the all-hadronic channel. Events are required to have six or more jets, of which at least one is tagged as a -quark jet by the detection of a secondary vertex (“SVX tag”). Imposing that the masses of the top and anti-top quark be equal, and that the invariant mass of pairs of jets forming bosons equals the -boson mass, yields a 3-C fit. However, for each event, multiple combinations are possible in the association of jets to bosons or quarks, so the combination resulting in the lowest is chosen as the right kinematic fit. The sample consists of 136 events (corresponding to an integrated luminosity of ), with the background contamination estimated at 1089 events. The measured top mass is .
3.3 Lepton + Jets Channel
The DØ lepton + jets analysis[7] requires an isolated central lepton, four or more jets and at least missing transverse energy. Since the neutrino’s longitudinal momentum is not measured, the kinematic fit to the hypothesis is now a 2C fit. DØ also computes a discriminant D, based on 4 variables weakly correlated with the top-quark mass. This discriminant is computed through a comparison of signal and background using classical methods, as well as a neural network. The likelihood fit to determine the top mass is then performed on a two-dimensional grid of D versus the top mass. Both discriminants yield results that are in good agreement with each other, which when combined give . The background contamination is estimated to be approximatively 50 out of the 77 events that pass all selection criteria.
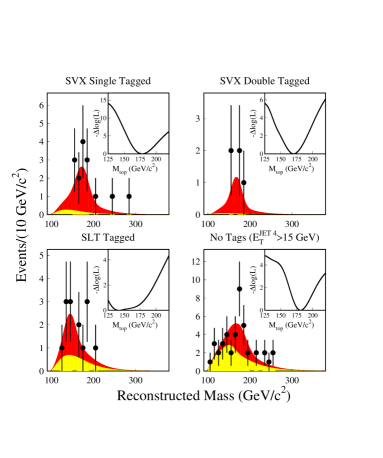
CDF[8] uses a similar procedure, but finds that optimal results can be obtained by dividing the sample into 4 subsamples: events with two SVX tags (5 events), events with a single SVX tag (15 events), events without SVX tags but where one jet is identified as a -quark jet through a soft lepton tag (“SLT tag”) (14 events), and finally events without any tags (42 events). The samples are fitted separately and the results, shown in Fig. 1, when combined yield .
3.4 Dilepton Channel
As indicated in Section 2, the dilepton channel has fairly low statistics. On the other hand, the background is small, dominated by boson decays to charged leptons and particle misidentification. The difficulty arises from the presence of two neutrinos, for which only the combined transverse momentum can be measured. The system is thus kinematically underconstrained, and both experiments use the so-called “neutrino weighting” technique to measure the top quark mass: for every chosen top quark mass, there is a sampling of allowed neutrino rapidities. Given the neutrino rapidities, the assumed top mass, and the charged-lepton and b-quark momenta, the system can now be solved for the transverse and longitudinal momentum components of the neutrinos (with a two-fold ambiguity for each neutrino). A weight is then assigned to each solution based on the agreement between the calculated and measured missing transverse momentum. All weights are summed for all possible combinations of neutrino rapidities. This is done as a function of top mass value for each event.
DØ[9] has observed 6 events in a sample corresponding to an integrated luminosity of about . For each event, the distribution of weights is split into five mass regions, and used to form a vector for calculating the mean mass value for all events in the sample. Fig. 2 summarizes the results based on these events. DØ also evaluates the mass in this sample using an extended version of the Dalitz-Goldstein and Kondo method. Both results are compatible, and the combined measured top-quark mass is .

Eight events are observed by CDF[10] (in a sample corresponding to an integrated luminosity of ). Each event’s top mass estimate is determined from the peak of the weight distribution, and the resulting distribution compared with Monte Carlo simulation, leading to a measured top-quark mass of .
3.5 Systematic Uncertainties
The main contributions to the systematic uncertainties on the Run I top-quark mass measurements are given in Table 1. The dominant contribution is due to the determination of the jet energy scale. Other important contributions come from uncertainties in initial and final state radiation, and modeling of the background. All of these will be discussed in more detail in Section 6.
| a | b | c | d | e | f | |
|---|---|---|---|---|---|---|
| CDF Dilepton | 3.8 | 2.8 | 0.6 | - | 0.3 | 0.7 |
| CDF Lepton + Jets | 4.4 | 2.6 | 0.1 | - | 1.3 | - |
| CDF All Hadronic | 5.0 | 1.8 | 0.8 | - | 1.7 | 0.6 |
| DØ Dilepton | 2.4 | 1.7 | - | 1.3 | 1.0 | 1.1 |
| DØ Lepton + Jets | 4.0 | 1.9 | - | 1.3 | 2.5 | 1.5 |
4 Combined CDF and DØ Measurement
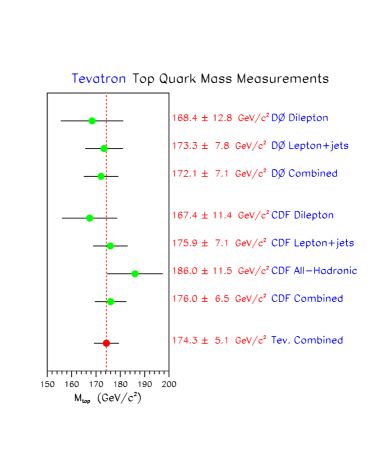
The Top Averaging Group[11] has combined the 5 mass measurements described in Section 3. As expected, after taking into account all correlations, the best contribution comes from the lepton + jets channel. The combined result is , which is compared with the individual measurements in Fig. 3.
5 Run II Upgrades
Run II is formally scheduled to start at the Tevatron on March 1st, 2001. This will follow a shutdown during which both the accelerator complex and the collider detectors will have undergone significant upgrade from their Run I configurations.
5.1 Upgrade of the Accelerator Complex
In Run II, the Tevatron is expected to operate at a center of mass energy , an increase of over Run I. For top quark studies, this yields a substantial rise of 40 % in the cross-section.
In addition to that, the completion of the Main Injector should provide significant improvement in the luminosity. Both experiments are expected to record data corresponding to an integrated luminosity of in the first two years, followed, after a brief shutdown, by per year until the start up of the LHC.
5.2 DØ Upgrade
The main features of the DØ upgrade involve the addition of a 2 Tesla solenoid inside the calorimeter, combined with improved tracking and particle identification capabilities.
Two central tracking systems have been built: an extensive silicon detector consisting of barrels for central tracking and disks covering the forward regions, and a scintillating fiber tracker between the silicon and the solenoid. The silicon barrels have four layers mainly of double-sided silicon sensors, while all disks provide two hit projections. The fiber tracker consists of 8 coaxial cylinders, and is used in the Level-1 trigger.
In addition to the tracking systems, preshower detectors will be used to identify electrons and photons. Also, the muon coverage has been extended and a new three-level trigger system is being built.
5.3 CDF Upgrade
The upgraded CDF detector will have improved central tracking detectors, as well as increased coverage in pseudorapidity for lepton identification.
The new silicon detector consists of three parts: “Layer-00”, silicon barrels, and the “Intermediate Silicon Layers (ISL)”. Layer-00 is a single layer of silicon located very close to the beam, leading to significant improvement in impact parameter resolution. The barrels have five layers of double-sided silicon sensors, with the ISL located at larger radii, providing additional points between the silicon and the Central Outer Tracker (COT). The COT is an improved version of CDF’s Run I central drift chamber: it has 12 layers of wires, less material, and operates with shorter drift times.
New end plug calorimeters have been built, giving better coverage for electron identification, and the muon coverage has also been increased. In addition to this, a time-of-flight system is located between the COT and the solenoid, and a new three-level trigger system is being implemented.
6 Systematic Uncertainties on the Top-Quark Mass Expected in Run II
In this section, we discuss ways to reduce the dominant systematic uncertainties on the mesurement of the mass of the top quark.
6.1 Determination of Jet Energy Scale
For Run I data, CDF and DØ use a somewhat different approach to determine the jet energy scale. In DØ, the essential steps of the procedure are the following: the electromagnetic scale is normalized by the mass of the -boson, and the hadronic response is then derived by balancing + jets events. Corrections for the underlying event, multiple interactions and noise, are determined from minimum-bias data, while corrections for leakage outside the jet cone are computed based on test-beam data and Monte Carlo simulation. Finally, the conversion from jet to parton energy is based on Monte Carlo (HERWIG), with separate treatment of light and -quark jets. A small remnant pseudo-rapidity dependence is corrected using data from + 1 jet events, and the results are cross-checked using + jets events. In DØ, the required corrections are determined separately and symmetrically for data and Monte Carlo, and then the relative difference between data and Monte Carlo is added to the systematic uncertainty. Since the top-quark mass is measured by comparison of data with simulation, this is a valid approach.
While many of the steps are similar in CDF, there is one fundamental difference: in CDF, the Monte Carlo simulation, and in particular the fragmentation, is tuned to the data, exploiting the available accurate tracking information. As is shown in Table 1, the two different approaches do not seem to lead to significantly different results.
In Run II, the additional and improved data will yield at least two new handles on the jet energy scale in events. The first is given by the larger sample of lepton + jets events with two -quark tags. In 2 , this sample is expected to contain of the order of 300 to 500 events, allowing accurate calibration of light quark jets through the reconstruction of the -boson mass. Probably the most precise way to determine the calibration of the jet energy scale is given by the large sample of events expected in Run II. This type of events has already been observed by CDF in Run I[12], but the sample is unfortunately to small to be used for determining the jet energy scale. It is expected that using these events in Run II will allow reduction in this dominant uncertainty to below 1%.
6.2 Initial and Final-State Radiation
A second sizeable contribution to systematic uncertainty is due to the treatment of initial and final-state radiation. Clearly, additional jets from initial-state radiation should not be included in the kinematic fits, but those due to final-state radiation certainly should be. Unfortunately, such additional jets are the least energetic only about 55 % of the time. However, theoretical work is progressing, and present and future versions of the Monte Carlo generators should reproduce these processes with better accuracy. Furthermore, the sample of lepton + jets events with extra jets in Run II should be large enough to allow more detailed study and comparison to Monte Carlo. This can be done using variables such as the number of additional jets, relative angles between jets, etc.
6.3 Backgrounds
Multiple-jet QCD background is determined directly from data, and does not represent a major problem. In Run I, a significant systematic uncertainty came from the +jets background, which was modeled using the VECBOS event generator. In the meantime, and -boson transverse momentum distributions at the Tevatron have been studied in detail[13], contributing to our understanding of these vector boson production processes. Better Monte Carlo generators already exist, so this uncertainty should be reduced appreciably in Run II.
7 Conclusions
In Run I at the Tevatron, the top quark mass has been measured with an accuracy of 3 %. The measured value is , which corresponds to a top Yukawa coupling .
In Run II, thanks to the improved accelerators and detectors, statistics will not be an issue. Furthermore, the additional data will provide better control of systematic uncertainties, where the main contribution will probably shift to the treatment of initial and final-state radiation. A challenging goal will be to reduce the systematic uncertainty on the top quark mass to less than 2 .
References
- 1 . F. Ptohos (for the CDF Collaboration), talk presented at the International Europhysics Conference on High Energy Physics 99, Tampere, Finland, July 17, 1999.
- 2 . B. Abbott et al., DØ Collaboration, Phys. Rev. Lett. 83, 1908 (1999).
- 3 . E. Laenen, J. Smith, and W. van Neerven, Phys Lett. B321, 254 (1994); E.L. Berger, H. Contopanagos, Phys. Rev. D54, 3085 (1996); S. Catani, M.L. Mangano, P. Nason and L. Trentadue, Phys. Lett. B378, 329 (1996).
- 4 . G. Marchesini et al., Comput. Phys. Commun. 67, 465 (1992).
- 5 . F.A. Berends, H. Kuijf, B. Tausk, and W.T. Giele, Nucl. Phys. 357, 32 (1991).
- 6 . F. Abe et al., CDF Collaboration, Phys. Rev. Lett. 79, 1992 (1997), and Phys. Rev. Lett. 82, 271 (1999).
- 7 . B. Abbott et al., DØ Collaboration, Phys. Rev. D 58, 052001 (1998), and Phys. Rev. Lett. 79, 1197 (1997).
- 8 . F. Abe et al., CDF Collaboration, Phys. Rev. Lett. 80, 2767 (1998), and Phys. Rev. Lett. 82, 271 (1999).
- 9 . B. Abbott et al., DØ Collaboration, Phys. Rev. D 60, 052001 (1999).
- 10 . F. Abe et al., CDF Collaboration, Phys. Rev. Lett. 82, 271 (1999).
- 11 . L. Demortier et al., The Top Averaging Group, Fermilab-TM-2084 (1999).
- 12 . F. Abe et al., CDF Collaboration, FERMILAB-CONF-98-197-E (1998), and hep-ex/9806022.
- 13 . B. Abbott et al., DØ Collaboration, Phys. Rev. Lett. 84, 2792 (2000), and Phys. Rev. D 61, 032004 (2000); B. Abbott et al., DØ Collaboration, FERMILAB-CONF-99-204-E (1999); F. Abe et al., CDF Collaboration, Phys. Rev. Lett. 79, 4760 (1997).