Design, construction, and operation of SciFi tracking detector for K2K experiment
Abstract
We describe the construction and performance of a scintillating fiber detector used in the near detector for the K2K (KEK to Kamioka, KEK E362) long baseline neutrino oscillation experiment. The detector uses 3.7 m long and 0.692 mm diameter scintillating fiber coupled to image-intensifier tubes (IIT), and a CCD camera readout system. Fiber sheet production and detector construction began in 1997, and the detector was commissioned in March, 1999. Results from the first K2K runs confirm good initial performance : position resolution is estimated to be about 0.8 mm, and track finding efficiency is % for long tracks (i.e., those which intersect more than 5 fiber planes). The hit efficiency was estimated to be % using cosmic-ray muons, after noise reduction at the offline stage. The possibility of using the detector for particle identification is also discussed.
1 Introduction
1.1 K2K experiment
The Super-Kamiokande Collaboration has shown strong evidence for neutrino oscillations in an analysis of atmospheric neutrino data[1].
K2K[2] is a long baseline neutrino experiment designed to allow more precise studies of neutrino oscillations. A high-purity muon neutrino beam, generated using the KEK 12 GeV proton synchrotron, is directed through a near detector system at KEK to the Super-Kamiokande site 250 km away. By comparing the beam flux and energy spectrum between the near and far detectors, we can investigate neutrino oscillations between and other neutrino flavors.
The near detector includes a 1kt water Cherenkov detector and a fine-grained detector (FGD), which in turn consists of the scintillating fiber (SciFi) detector, scintillating counters, a lead glass counter, and a muon range detector. Data taking for K2K began in March, 1999.
1.2 Scintillating fiber (SciFi) detector
The near neutrino detector is designed to measure the flux and the energy spectrum of the neutrino beam as it leaves KEK. The detector must provide good tracking capability, allowing discrimination between different types of interactions such as quasi-elastic or inelastic events. Its mass composition should be dominated by water, to allow cancellation of common systematic uncertainties with the Super-Kamiokande detector to the maximum extent possible. In order to study neutrino interactions in greater detail, we decided to use a SciFi detector constructed with fiber tracking layers interleaving water target tanks. SciFi detectors have been used in UA2 and CHORUS experiments [3, 4]. The K2K SciFi detector is the largest ever so far, and employs a simple design of optoelectronics readout and a calibration system using electro-luminescent (EL) plates.
2 Construction and operation of the K2K SciFi detector
2.1 Design and structure
A schematic overview of the SciFi detector is shown in Fig. 1.
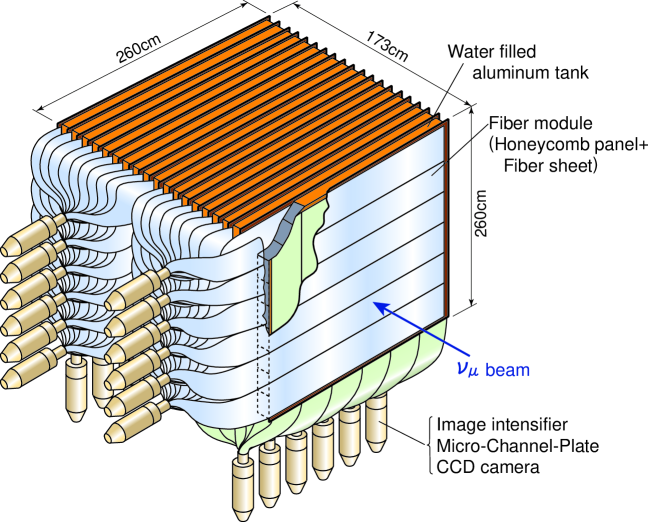
It consists of 20 layers of 2.6 m 2.6 m tracking modules, spaced 9 cm apart, each of which contains double layers of scintillating fiber sheets in both the horizontal and vertical directions (i.e., XXYY layers). The fiber sheets are coupled to image-intensifier tubes (IITs) which in turn are read out by CCD cameras (Fig. 2).
Between the fiber modules, there are 19 layers of water target contained in extruded aluminum tanks. Each target layer consists of 15 tank modules, and thus there are 285 in total. The width, height, and length of the tanks are 6 cm, 16 cm, and 240 cm, respectively. The thickness of the aluminum tank is 1.8 mm. The fiber is 3.7 m long and 0.692 mm in diameter.
2.2 Optimization of the scintillating fibers
2.2.1 Measurement of the light yield of various fibers
We measured the light yield and attenuation length of various types of scintillating fibers using a photo-multiplier tube (PMT), irradiating the fiber with a 90Sr -ray source. The light yield, after propagation of the light over a distance in the fiber, is expressed by
| (1) |
where is an initial light yield at (IIT surface) and is an attenuation length. We estimated by extrapolation from measurements at = 1.5, 2.0, 2.5, and 3.0 m. The results are summarized in Table 1.
| SciFi type | Diameter[mm] | [p.e.] | [m] | Efficiency)[%] |
|---|---|---|---|---|
| SCSF-78M | 0.5 | 4.4 0.2 | 3.46 0.18 | 97.2 0.7 |
| 0.7 | 6.5 0.2 | 3.57 0.17 | 99.6 0.1 | |
| SCSF-78 | 0.7 | 5.2 0.1 | 3.48 0.13 | 98.6 0.3 |
| 0.9 | 7.2 0.2 | 3.86 0.13 | 99.9 0.03 | |
| SCSF-77 | 0.7 | 4.2 0.1 | 4.39 0.27 | 98.9 0.3 |
| BCF-12 | 0.7 | 3.6 0.1 | 3.36 0.18 | 94.2 1.2 |
Kuraray SCSF-78M is a multi-cladding fiber, and the others have single-cladding. From these measurements, we also estimated the detection efficiency for minimum ionizing particles after light propagation over a distance =4 m for a double-layered fiber sheet. Here, we took into account the quantum efficiencies of the IIT () and PMT (), and the reflectivity at the far end of the fiber (). When we required more than 99 % detection efficiency, there were only two candidates left. In order to minimize the readout area, we selected the smaller-diameter fiber, SCSF-78M (0.7 mm diameter).
2.2.2 Aging
Scintillating fibers are known to have a finite lifetime, with fiber transparency diminishing with age. Aging is mainly caused by a chemical reaction of the core material (polystyrene) with oxygen in air. Fiber lifetime depends on temperature. We measured the decrease in light yield of SCSF-78M at several elevated temperatures and estimated the fiber lifetime at lower temperatures using an “Arrhenius” plot, lifetime as a function of temperature (Fig. 3).

Here we define a fiber lifetime as the number of days at which the light yield of the fiber drops to 90 % of its initial value. From the Arrhenius plot, the lifetimes of SCSF-78M at 15 ∘C and 20 ∘C are estimated to be 21,000 and 9,400 days, respectively. If we keep the temperature of the experimental hall less than 20 ∘C, the decrease in the light yield is expected to be less than 10 % during the five years of the experiment. In fact, we attempt to maintain the SciFi detector temperature at 16 ∘C.
2.3 Fiber sheet production
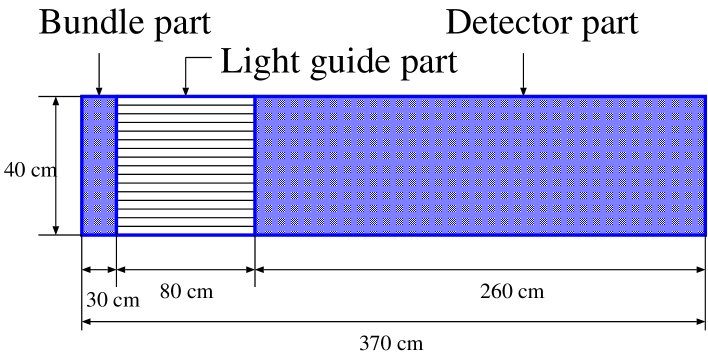
We had to fabricate double-layered fiber sheets before building the fiber tracking modules. Each fiber sheet is 370 cm long and 40 cm wide, consisting of a 260 cm long sensitive area, 80 cm long light guide, and 30 cm long IIT bundle segment (Fig. 4).
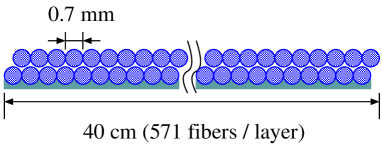
A fiber tracking module consists of 6 double-layered fiber sheets laid side by side to make a total width of 240 cm, in both horizontal and vertical directions. For 20 such modules, we needed to fabricate 240 sheets in total, plus 8 spares. This method of fiber sheet production is quite similar that used by the CHORUS Collaboration [5, 6]. To produce 3.7 m long fiber sheets, we prepared a 1.2 m diameter drum with a spiral groove whose pitch was 0.7 mm. We wound fiber stock along the groove until the sheet became 40 cm wide. Then, we coated the sheet with white paint. After it became dry, we wound the second layer fiber onto the first layer and painted it again. Finally, we cut the sheet, removed it from the drum, and painted its inner side.
A control system for fiber sheet production is shown in Fig. 5.
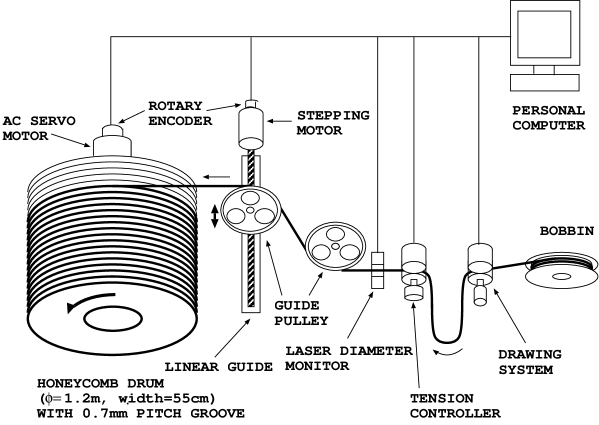
Fiber stock was wound onto the bobbin and threaded onto the winding machine. The drawing system, which consists of 2 rubber coated rollers, a rotary encoder, and a stepping motor, drew fiber from the bobbin. Because the two layers have slightly different circumferences on the drum, we applied a constant tension to each layer (150 gw to the first and 300 gw to the second layers, respectively) during winding. After being removed from the drum, the prestressed sheet then became flat due to the restoring force supplied by the outer fibers. At the downstream end of the tension controller, a laser sensor monitored the fiber diameter. When it detected a fiber section out of tolerance (692 m m), the whole system stopped, and we cut away the segment. Guide pullies attached to an accurate linear guide, driven by a stepping motor, lead the fiber onto the groove of the drum. They were synchronized with rotation of the drum and moved 0.7mm for a turn of rotation. The drum was driven by an AC servo motor. The rotation speed was adjustable and the maximum speed was about 1 m/sec (0.265 rps). The whole fiber sheet production system was controlled by a conventional PC with 2 custom interface boards.
2.4 Fiber sheet modules
After all the fiber sheets were made, both ends of the sheets were polished by a milling machine and far ends of the sheets were sputtered with aluminum. We checked the quality of all the individual fibers by irradiating the sheets with 90Sr -source at the farthest point. The light yield of the fiber sheets was measured to be 81 photo-electrons.
Since the fiber sheets are very fragile, we needed a strong and light material to support the fiber sheet. We chose a honeycomb panel with a dimension of 2.6 m 2.6 m 1.6 cm, consisting of a 1.4 cm thick paper-honeycomb core and two 1 mm thick GFRP skins. The area density of the honeycomb board is 0.52 g/cm2, and their net mass is 30 kg per board.
We glued 6 fiber sheets side by side on one surface of the honeycomb panel in a horizontal direction, and 6 more sheets on the other side in a vertical direction (referring to the final orientation), using epoxy adhesive CY221/HY2967. Since we found that gas released by the glue actually accelerates fiber aging, we placed the glue in a vacuum chamber for 5 minutes before gluing. The positions and the straightness of the sheets were controlled within 0.5 mm by a ruler bar and alignment pins when the sheets are glued. The straightness of each sheet was measured by a micrometer every 10 cm with accuracy of 0.1 mm.
Since the fiber sheet modules were rather large (3.7 m 3.7 m), we made a special aluminum jig (4 m 4 m) to perform assembly, transportation, and installation of the modules safely and easily. Throughout the installation, only about 20 fibers were broken out of 274080.
2.5 Fiber bundles
In order to make effective use of the photosensitive area (10 cm diameter) of the IIT surface, fibers are bundled at the readout. All the fibers (1142 6 20 2 = 274080) are grouped at the readout end and glued into bundles, which are then attached to the 24 IIT’s. Ten consecutive fiber sheets along the beam direction are assigned to one fiber bundle. Thus, there are 6 fiber bundles in the upstream half of the detector, and another 6 fiber bundles in the downstream half, in both x (horizontal) and y (vertical) directions.
One fiber bundle contains 1142 10 (or 274080/24)= 11420 fibers. Fig. 6 shows the arrangement used to accumulate fibers and make a (half) bundle from (5) fiber sheets. The remaining half bundle is symmetrical with respect to the direction along the SciFi layer and the two halves are glued together.
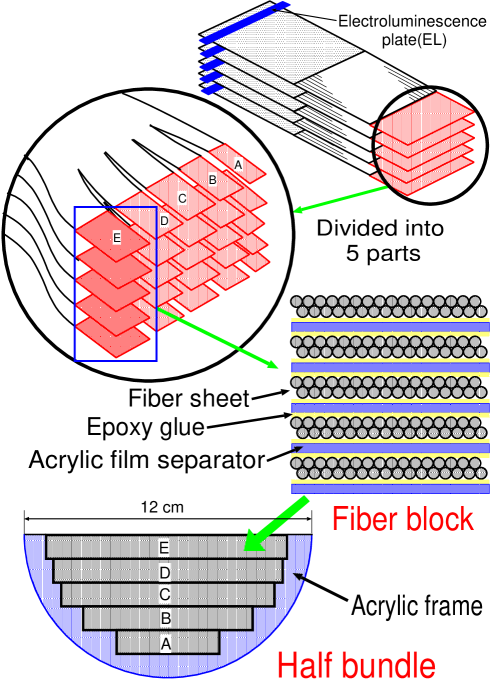
In order to optically separate fiber sheets from different layers, acrylic films (200 m thick) are inserted between individual fiber sheets in a bundle. Epoxy glue (CY221/HY2967) was used to fabricate the bundle. For good optical contact with the IIT surface, we trimmed and polished the surface of each bundle using a custom-made polishing machine. The detector geometry and construction logistics required us to perform bundle polishing operations in the experimental hall, after installation of all the SciFi modules, with very limited working space. A compact portable milling machine, with dual carbide and diamond bits and pre-programmed automatic feed control, was specially designed and built for this purpose[7]. Following polishing, bundles were inspected for flaws using a microscope system.
2.6 Readout system
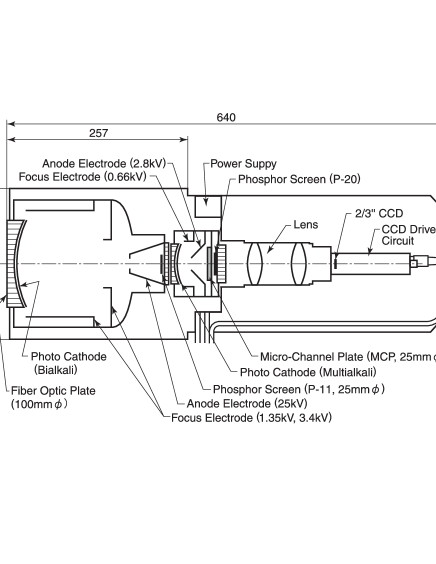
Our opto-electronics readout comprises two stages of image-intensifiers, an optical lens and a CCD camera(See Fig. 2). The system was designed to ensure simplicity and thus low cost. The first stage is an electrostatic image-intensifier (Hamamatsu V5502UX) with 100 mm diameter photocathode. The image is reduced in diameter by a factor of 23 % and the light yield is amplified by about 5. The bialkali photocathode has quantum efficiency 22% at 430nm, which is the peak wavelength in the emission spectrum of the scintillating fiber. The second stage is a micro-channel-plate(MCP) image-intensifier (Hamamatsu MCP-IIT:V1366GX). The gain in light yield is about 1000 at a typical HV value of 2600 volts. We operate the MCP-IIT with pulsed HV to reduce unwanted events. The gate width is set to 100 s, which corresponds to the decay time of the fluorescent phosphor screen in the first stage IIT. The optical lens at the third stage reduces the image to 30 % and projects it onto the CCD camera (C3077). The CCD camera used here has 768 pixels and 493 pixels in horizontal and vertical directions, respectively, with pixel size 11 m 13 m. One fiber is seen by about pixels.
The video signal from the CCD is fed to a flash-ADC module housed in a NIM crate, where positions of the CCD and the pulse height are digitized. The digital outputs are then sent to 12 VME FIFO modules. The readout time is about 30 msec.
2.7 EL calibration
To identify hit fibers from the CCD image, we have to know the correspondence between fiber and CCD coordinates. For this purpose, we illuminate selected fibers at regular intervals using an electro-luminescent plate (EL). We will refer to these position calibrations as “EL” calibrations hereafter.
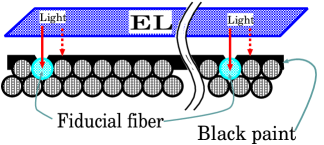
We placed EL’s at the edge of the fiber sheets (See Fig. 6 in the previous subsection), where we coated the sheet with black paint and then scraped the coating off selected fiducial fibers (Fig. 7). Thus, light from the EL goes only into the fiducial fibers. We illuminate only one out of every 10 or 20 fibers and fibers at the edges of the sheets, to save labor and data size. Positions of the other fibers are interpolated from these fiducial measurements. We get the fiber positions within 100 m by this method. We measured the x, y, and z positions of the edge fibers of each layer with accuracy of 1 mm during installation, along with other fiducial marks on the fiber modules, to relate fiber coordinates to the experiment coordinate system. Cosmic-ray muons were used to obtain the final alignment information.
3 Performance of the detector and analysis of the data
3.1 Hit definition and the pulse height
The energy loss of a minimum ionizing particle is estimated to be 0.19 MeV in the fiber sheet and generates about 8 photoelectrons (p.e.) on the IIT surface if the particle hits the fiber at the mid-point of SciFi detector (2.4 m from the readout end), and 6.5 p.e. if it hits at the end of the fiber (3.7 m from the readout).
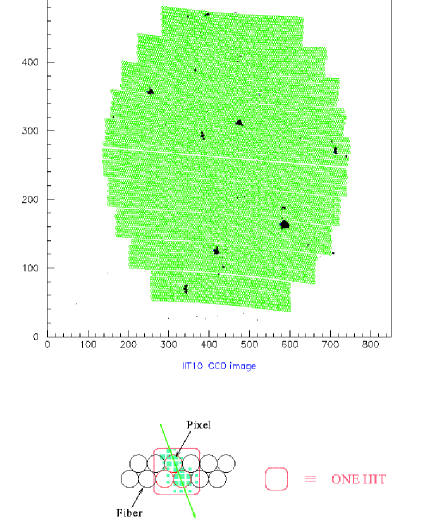
Fig. 8 shows a typical IIT image corresponding to a particle track, read out by CCD: the dark spots represent hit CCD pixels. The fiber positions determined from EL calibration are also shown as small circles. To reconstruct a hit, the hit finding algorithm starts clustering CCD-pixels, finds all fibers which overlap the pixel cluster, and clusters the fibers. The hit is defined as a cluster of fibers which overlap the pixel clusters: the hit position is calculated for the center of gravity of the hit fibers (weighted by the number of overlapping pixels) in the fiber cluster.
The attenuation and reflection of photons inside the fiber was measured during the quality test as described in Section 2.4. The light yield is given by
| (2) |
where is the normalization constant, is the distance from the IIT surface, is the attenuation length (323 cm), is the reflectivity of aluminum coated side (0.74), and is the length of fiber (370 cm).
Fig. 9 shows the mean values of the number of pixels in a cluster () as a function of hit position. The IIT surface is located at cm (the center of detector is located at ). The data shown in open circles are the measured values for the cosmic-ray muons and they agree well with the prediction by Eq. (2) (solid line). After the attenuation correction, the position dependence almost vanished, as shown in the figure (the solid circles). The value for all track hits are normalized to that at .

Fig. 10 shows the typical distribution of data and a pixel simulation of cosmic-ray muons. is corrected for the attenuation length and the incident angle.

The response for a minimum ionizing particle (MIP) is calibrated using cosmic-ray muons. The distribution for cosmic-ray muons shows a peak at about 50 when it is normalized to the pulse height at . This means 8 p.e. corresponds to at the peak position, which agrees well with LED test data.
3.2 SciFi Monte Carlo simulation - Pixel simulation
The Monte Carlo simulation for the SciFi detector proceeds in two steps. In the first, charged particles are tracked through the detector using GEANT[8]. The energy loss of a particle (in GeV) is computed whenever the particle traverses a fiber and is then converted to the number of photoelectrons observed by the IIT/CCD imaging system, taking into account attenuation along the fiber, reflection at the aluminium coated end and the quantum efficiency of the IIT photocathodes.
The photoelectrons are then converted to an image on the CCD surface. Each photoelectron is offset from the center of the fiber according to a gaussian distribution measured using single photoelectrons during LED testing of the IITs. The size of the pixel cluster corresponding to a single photoelectron is then chosen from distributions parameterized from the LED data and the pixel cluster is built assuming circular symmetry. Finally, the tuning of the energy scale (i.e. how many photoelectrons correspond to the energy deposition from a minimum ionising particle) is carried out using cosmic-ray muons.
3.3 Track and vertex reconstruction
The track and vertex finding algorithm proceeds in 4 steps. First, the track finder searches for 2-dimensional (2D) track candidates (in the XZ or YZ planes) which hit at least 3 layers of SciFi modules. A 3D track is reconstructed by finding the best combination of two X-view and Y-view 2D tracks, comparing the starting and ending points and checking the overlap of the 2D tracks. A vertex is defined as an intersection of 3D tracks, and the vertex position is determined with full 3D minimization fit. If there is only one track in the event, the mid-point of the nearest upstream water tube is taken as the event vertex. Finally, using the reconstructed vertex position, the track finder starts searching for extra tracks near the vertex, which are mainly short tracks. The last step is very important because most proton tracks from charge current (CC) interactions are short and may not be found in the first iteration of track finding.
The efficiency of track finding strongly depends on hit efficiency and the density of noise hits in the events. Hit efficiency () was evaluated using cosmic-ray muons which penetrate whole SciFi modules as
| (3) |
In order to keep the hit efficiency reasonably high and to keep the noise rate as low as 0.5 %, we required a minimum value of for a hit. Fig. 11 shows the hit efficiency and the noise rate at various cut values on . Based on this figure, we decided to require . As a result, the hit efficiency was found to be 922 % on average, with almost no noise contamination (0.5 %)111After upgrading the HV system of IIT in Summer, 1999, we found the hit efficiency to be 96 2 % with the same noise level.. Fig. 12 shows the hit efficiency for each layer.


Fig. 13 shows the track finding efficiency, which was estimated using cosmic-ray muons and muon tracks from CC interactions generated in the Monte Carlo simulation. They agree with each other: 982 % for long tracks (traversing more than 7 SciFi layers) and 856 % for short tracks. Here, the horizontal axis is the number of layers which the muon passes through.

Vertex resolution estimated using Monte-Carlo events( CC events) was 1.5 mm in the beam direction and 1.5 mm perpendicular to the beam.
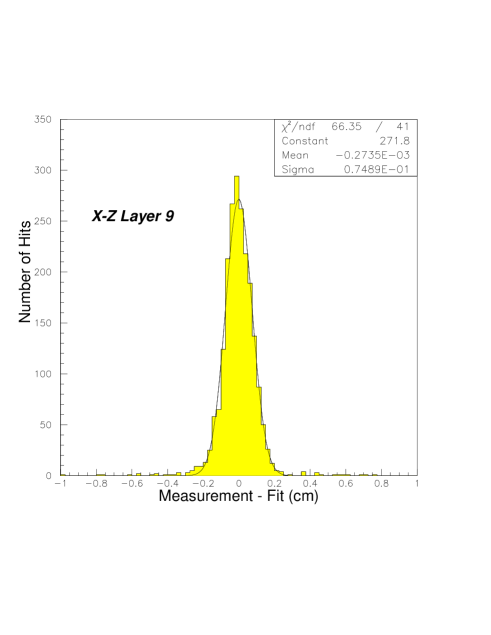
The position resolution of SciFi detector was estimated from the residual distribution for hits. Since multiple Coulomb scattering effects are not negligible, we implemented a Kalman filtering/smoothing algorithm[9] in order to take multiple scattering into account during the track fit. Fig. 14 shows a residual distribution of hits for cosmic-ray muons. The figure shows that hit position resolution is 0.8 mm.222Using a simple straight-line fit instead of Kalman Filter method, the rms of the corresponding residual distribution was 1.5 mm. At present, performance is limited by multiple scattering effects in the water tank and imperfect alignment of the sheets. If we can correct for the detailed alignment parameters, such as the curvature and rotation of the sheets, we expect the hit position resolution to improve to about 0.5mm, which is dominated by multiple scattering effects.
3.4 Neutrino event reconstruction
Fig. 15 shows a typical CC quasi-elastic (qe) interaction () candidate. The longer track is a muon, which hits the scintillating counters and lead glass counters and reaches the muon range detector, and the shorter track is a proton.
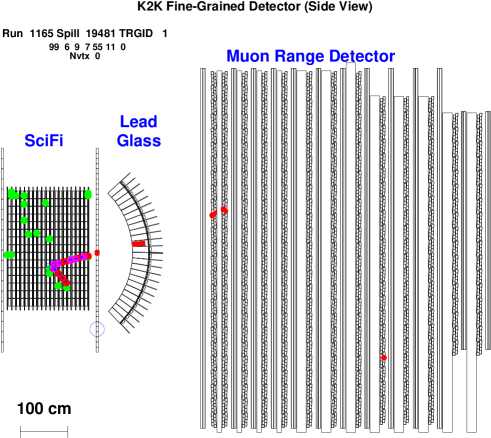
Fig. 16 shows the distribution of the number of the reconstructed tracks from the interaction vertex in event candidates. The total number of events in a Monte Carlo prediction is normalized to that in the data. It shows that charged particles in CC events are succesfully reconstructed and the data (solid circles) are well reproduced by Monte Carlo prediction (histogram). We estimated the fraction of tracks with misreconstructed trajectories to be less than 4 %.

3.5 Particle identification
Although tracking is the main purpose of the SciFi detector, we may use it for particle identification. Electrons can be identified from SciFi hit patterns, and are useful for identifying the events. The energy of an electron can be estimated from the number of hits in the shower, i.e. = 10 MeV/hit for SciFi detector, which is estimated from a Monte Carlo study and a beam test with a prototype detector. The energy resolution of electrons was measured to be about 28 % for 0.3 GeV in the beam test and it is estimated to be 15 % for 1.0 GeV electrons.
From LED runs and the beam test, the number of pixels () shows good linearity with the number of photoelectrons (). Fig. 17(a) shows the correlation of and from the LED test. Fig. 17(b) shows the results of the beam test of the proton and pion beams. The horizontal axis is the of the particle and the vertical axis is the mean value of . The simplified Bethe-Bloch formula reproduces the data points well.


of the tracks may be used to separate protons from muons or pions. A feasibility study was performed using CCqe event candidates, which contain one muon track and one proton track. Fig. 18 shows distribution for (a) muon and (b) proton candidates. The figure shows that the proton candidates have larger values because protons will lose more energy in the fiber sheet.

4 Summary
A very large scintillating fiber (SciFi) tracking detector for the K2K long baseline neutrino oscillation experiment has been in operation since March, 1999. Track finding efficiency is 982 % for long muon tracks (those which intersect more than 5 fiber planes), and 856 % for short tracks, which were estimated using cosmic-ray muons and a Monte Carlo simulation. The position resolution per layer is about 0.8 mm. The SciFi detector has demonstrated its capability for reconstruction of interactions. The pulse heights for cosmic-ray muons have been stable within 10 % after one year of operation. In addition, the SciFi detector offers the possibility of performing electron and proton identification.
5 Acknowledgements
We thank Mr. S. Ishikawa and Mr. T. Kawai of Nagoya University for designing and constructing the fiber spooling machine. We also thank Prof. K. Niwa and his group, especially Dr. T. Nakano, of Nagoya University for their cooperation. Thanks are also due to Mr. C. Lindenmeyer, Mr. P. Mulligan, and Mr. J. Roze, for the design, construction, and operation of the fiber bundle polishing machine. We also thank M. Powlowski, T. Raza, and T. Kato (SUNY) for helping the fiber sheet assembly.
References
- [1] Y. Fukuda et al(Super-Kamiokande Collaboration), Phys. Rev. Lett. 81 (1998) 1562–1567.
- [2] K. Nishikawa, Nucl. Phys. B (Proc Suppl.) 77 (1999) 198.
- [3] R. E. Ansorage et al, Nucl. Instr. Meth. A265(1988) 33.
- [4] P. Annis et al(CHORUS Collaboration), Nucl. Instr. Meth. A412(1998) 19.
- [5] T.Nakano et al, IEEE Transaction on Nuclear Science Vol.39 (1992) No.4.
- [6] S.Ishikawa et al, “Hoshasen” Vol.21, No.3 (1995) 85–119 (in Japanese).
- [7] PM Manufacturing, Inc., Yorkville, IL, USA.
- [8] GEANT : Detector Description and Simulation Tool, CERN Program Library, 1995.
- [9] R. Fruhwirth, Nucl. Instr. and Meth. A262 (1987) 444.