S. Adler1 M.S. Atiya1 I-H. Chiang1 M.V. Diwan1
J.S. Frank1 J.S. Haggerty1 S.H. Kettell1
T.F. Kycia1[1]
K.K. Li1 L.S. Littenberg1
A. Sambamurti1[1]
A. Stevens1
R.C. Strand1 C. Witzig1
T.K. Komatsubara2 M. Kuriki2
N. Muramatsu2
S. Sugimoto2 T. Inagaki3 S. Kabe3
M. Kobayashi3 Y. Kuno3 T. Sato3 T. Shinkawa3
Y. Yoshimura3 Y. Kishi4 T. Nakano4
M. Ardebili5 M.R. Convery5
M.M. Ito5 D.R. Marlow5
R.A. McPherson5 P.D. Meyers5 F.C. Shoemaker5
A.J.S. Smith5 J.R. Stone5 M. Aoki6[2]
E.W. Blackmore6 P.C. Bergbusch6,8 D.A. Bryman6,8
A. Konaka6
J.A. Macdonald6 J. Mildenberger6 T. Numao6
P. Padley6 J.-M. Poutissou6
R. Poutissou6
G. Redlinger6[3]
P. Kitching7 and R. Soluk7 (E787 Collaboration)
1Brookhaven National Laboratory, Upton, New York 11973
2High Energy Accelerator Research Organization (KEK),
Tanashi-branch, Midoricho, Tanashi, Tokyo 188-8501, Japan
3High Energy Accelerator Research Organization (KEK),
Oho, Tsukuba, Ibaraki 305-0801, Japan
4RCNP, Osaka University, 10–1 Mihogasaki, Ibaraki, Osaka 567-0047,
Japan
5Joseph Henry Laboratories, Princeton University, Princeton,
New Jersey 08544
6 TRIUMF, 4004 Wesbrook Mall, Vancouver, British Columbia,
Canada, V6T 2A3
7 Centre for Subatomic Research, University of Alberta, Edmonton,
Alberta, Canada, T6G 2N5
8 Department of Physics and Astronomy, University of British Columbia,
Vancouver, BC, Canada, V6T 1Z1
Abstract
We report the first measurement of a structure dependent
component in the decay .
Using the kinematic region where the muon kinetic energy is greater
than 137 MeV and the photon energy is greater than 90 MeV,
we find that the absolute value of the sum of the vector
and axial-vector form factors is
.
This corresponds to a branching ratio of
.
We also set the limit at c.l.
The decay () can proceed via two distinct
mechanisms.
The first, internal bremsstrahlung (IB),
is a radiative version of the familiar () decay:
its Feynman diagram has a photon emitted from the external
kaon or muon line.
The second, structure dependent radiative decay (SD),
involves the emission of a photon from intermediate states.
SD is sensitive to the electroweak structure of
the kaon and has been the subject of an extensive theoretical
literature[4, 5].
In recent years most of this has been in the
framework
of Chiral Perturbation Theory (ChPT)[6].
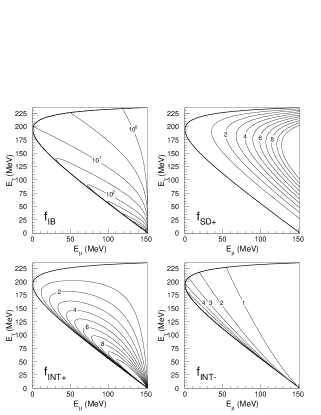
The differential rate in the rest frame
can be written [5] in terms of
and
,
where is the photon energy, is the muon kinetic energy,
is the mass, and is the mass:
where
In these formulas,
is the vector form factor,
is the axial form factor [7],
is the fine structure constant (1/137.036),
is the decay constant ( MeV), and
is the width of the decay.
and refer to different photon
polarizations and these components do not mutually interfere.
Both and can interfere with IB, however, resulting
in the terms labeled and .
Figure 1 shows the shapes of
, , and .
The component peaks at high muon and photon energy, making it the easiest
of the SD components to observe.
This analysis, therefore, is mostly aimed at observing the component.
The form factors of the decay, and , can,
in principle, depend on , which is given by
in the rest frame.
In an ChPT calculation
[6, 9], however, they are found to be independent and
are given by , , which
corresponds to .
In the data analysis, we initially assume that they are constant, then
test for dependence.
The IB component of has been well measured in other experiments
and found to agree with the QED prediction [10].
The structure dependent components, on the other hand,
have not yet been measured.
For the component, the best limit is
BR() [10].
There is also a limit on the combination BR(+ )
[10]. In terms of the form factors,
these limits translate into
, .
Better measurements
are available from the closely related process
().
In , the IB term is heavily suppressed by helicity,
so that the SD terms are easier to extract.
Since the INT terms are also highly suppressed, the signs of
the form factors are practically impossible to measure.
In ChPT, and for are identical to those
for .
The experiments[11] give , , in agreement with ChPT.
In , the IB term is large, thus complicating the extraction of
the SD terms, but also making the INT terms comparable in size
to the SD terms.
This makes it possible, in principle, to measure the sign as well as the
magnitude of the form factors.
In addition to its potential for checking the predictions of ChPT,
is also interesting as a probe of non-Standard Model
CP-violation[12].
One can look for a T-violating component of
muon polarization transverse to the plane of the decay.
Such an effect is proportional to the INT components.
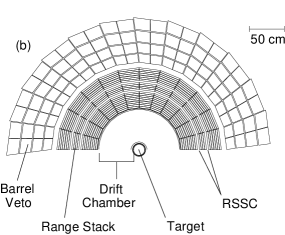
The E787 experiment at the Brookhaven Alternating Gradient Synchrotron (AGS)
[13],
shown schematically in Figure 2,
was used to look for the component.
E787, originally designed to search for , uses a beam of
mesons brought to a stop in a scintillating fiber target.
From there, charged decay products can enter the drift chamber
where their momentum is measured in a 1-T magnetic field.
The charged tracks then enter the Range Stack (RS),
which consists of 21 layers of
scintillator and two layers of straw tube chambers (RSSC).
Most tracks range out in the RS,
thus allowing measurements of their total energy
and range.
A 4 photon detection system, composed of the Barrel Veto (BV)
and two endcaps, surrounds the central region.
In the present application the BV, covering
70% of the solid angle and composed of lead and scintillator,
is used to detect the photons of interest
as well as to rule out the presence of more than one photon.
The data was taken with the upgraded E787 detector, which was completed in
1994.
In this analysis, the redundant charged track energy
and momentum measurements are
combined (assuming a mass) to give an improved measurement of
the track kinematics.
The rms resolution of this combined quantity is MeV/, for MeV/,
where is the combined measurement expressed as a momentum.
The resolutions for the azimuthal () and polar
(, with respect to the beam) angles of the
muons are each mrad.
The resolutions on the photon kinematic quantities are
MeV
( in MeV), mrad, and mrad.
A special trigger designed to search for the
component of required a high energy charged track in
the central region, a high energy photon in the BV, and
no other photons in the event.
A two-day run using this trigger netted a total exposure
of , yielding a total of
triggers.
Analysis of the events passing the trigger proceeds in three
steps: event reconstruction, background rejection, and spectrum
fitting.
In the reconstruction step, the energy, time, and flight direction
of the charged track and photon are calculated.
Any additional photon energy not associated with the primary photon
is also recorded.
A kinematic fit to the hypothesis is applied to the charged
track and the photon.
Since there are four constraints (conservation of momentum and energy) and
three unmeasured quantities (momentum of the neutrino), the kinematics
are over-constrained and non- events should have a bad fit .
Additionally, the kinematic fit yields measurements of and
with better resolution than the raw quantities.
These are the variables that are used in the final spectrum fits.
The two main types of background that need to be rejected are
accompanied by an accidental photon and ()
or () where one of the photons from the decay satisfies the photon requirement and the other photon is undetected.
The +accidental background can be suppressed in two independent
ways: by requiring a tight time coincidence between the muon and the
photon and by examining the kinematics of the decay.
Since the accidental photon is randomly oriented relative to the
muon, the cut on the of the kinematic fit to the
hypothesis is especially effective against this background.
Both and background can also be rejected in two
independent ways: vetoing on any additional photon energy in the event
and by the kinematics of the decay.
The requirement that the charged track energy be above the endpoint
( MeV) is especially effective against this type of background.
Since both types of background can be rejected by two independent methods,
the total rejection of all cuts for each background
may be calculated as the product of the rejections of the two methods.
This allows a calculation of expected background based solely on the
data, thus lowering the estimated systematic error.
In the final signal region defined by MeV and
MeV, the expected background (with statistical error)
from the +accidental source is 79.4 4.8 events.
The and backgrounds are treated together and give a
total expected background of 25.2 3.8 events.
Figure 3(a) shows the final spectrum of events with
the final signal region in the upper right corner delineated by the solid line.
The number of events in this region is 2693, the vast majority of which are
.
As a simple way of testing whether the events are consistent with
being only IB, we examine the distribution of the opening angle
between the muon and the photon ().
Figure 3(b) shows this distribution for
background-subtracted data.
Superimposed on the data are Monte Carlo distributions for IB and
components of .
When only an IB component is allowed, the quality of the fit is very poor
(= 300, with 48 degrees of freedom).
When an contribution is allowed, a much better fit is obtained
(= 58)
[14],
clearly indicating that a structure dependent component is present.
The fit is incomplete, however, because it does not include the
effects of the other components (, , ).
To include these effects, we generate
Monte Carlo distributions with SD and INT components weighted by the form
factors and normalized to the IB component.
In Figure 4, we plot the between
the vs. histogram of this Monte Carlo sample and
that observed in data (after background subtraction) as a function of the form factors.
The minimum is 75 with 69 degrees of freedom.
The best fit values are
where the errors are statistical.
The minimum ’s found in the regions where and where
differ by only 0.2.
We thus have no information about the sign of and can
only measure its absolute value.
The result corresponds to a branching ratio
of BR() .
The largest systematic errors associated with the form factor measurements come
from possible distortions of the spectrum induced by differences between
the true detector and the Monte Carlo simulation.
The two largest sources of distortion are
non-linearity in the measurement of the photon energy and
uncertainty in the thickness of the individual RS scintillator layers.
For , these two sources lead to uncertainties of 0.0095 and 0.0054,
respectively.
For , they are 0.028 and 0.033.
The systematic errors due to uncertainty in the level of background present
in the final sample are estimated in the data-based background studies
described above.
They are found to be very small, totalling 0.0007 for and 0.0097 for
.
Even a much enhanced background level would have only a small effect on the
measurements.
Adding the individual errors in quadrature, we find a total
systematic error of 0.011 for
and 0.044 for
As a check on possible systematic errors, the branching ratio for
the IB component has also been extracted.
This was accomplished by normalizing to a sample of decays that
was taken simultaneously with the data.
For MeV and
MeV, we find BR(IB), in good agreement with the theoretical value for this
kinematic region, .
Other checks included changing the binning of the
vs. histogram and varying the cut.
While both of these checks were limited by statistics, neither showed a
systematic trend as the parameters were varied.
Therefore, no systematic error is associated with these effects.
As mentioned above, the form factors and have, to this point,
been considered independent of .
To assess the effect of including dependence, we assume the
following form factor form:
We take GeV (the mass) and GeV (the mass)
and refit the measured spectrum in terms of the parameters
and .
The best fit parameters are:
The corresponding branching ratio is .
Although the value of differs somewhat from that
obtained assuming independence, the associated branching ratio
changes only slightly.
Furthermore, the minimum of the fit is very insensitive to
and , so we are unable to measure them and cannot offer
evidence of dependence.
In conclusion, we have observed a structure dependent
component in the decay .
Under the assumption of independence, the associated
form factors are
Since the measurement of is not significantly different from
zero, we add statistical and systematic errors in quadrature and
calculate the 90% confidence level:
The measurement is consistent with the
previous result on , but disagrees with
the ChPT prediction by about two standard deviations.
This is perhaps not surprising since at
higher order in ChPT, kaon form factors are expected to differ from
those of the pion
[15].
The calculation has been done for pions
[16], but not yet for kaons.
The limit on is consistent with ChPT
and is significantly better than any previously obtained from kaon decay.
A more detailed description of the analysis can be found
in reference [17].
We gratefully acknowledge the dedicated effort of the technical
staff supporting this experiment and of the Brookhaven AGS
Department. This research was supported in part by the
U.S. Department of Energy under Contracts No. DE-AC02-98CH10886,
W-7405-ENG-36, and grant DE-FG02-91ER40671, by the Ministry of
Education, Science, Sports and Culture of Japan
through the Japan-U.S. Cooperative Research Program
in High Energy Physics and under the Grant-in-Aids for
Scientific Research, for Encouragement of Young Scientists and for
JSPS Fellows,
and by the Natural
Sciences and Engineering Research Council and the National Research
Council of Canada.
REFERENCES
[1] Deceased.
[2] Now at KEK.
[3] Now at BNL.
[4] D.E. Neville, Phys. Rev. 124, 2037 (1961);
A.Q. Sarker, Phys. Rev. 173 1749 (1968); H. Namaizawa, Prog. Theor.
Phys. 39, 860 (1968);
R. Rockmore, Phys. Rev. 177, 2573 (1969);
N.J. Carron and R. L. Schult, Phys. Rev. D1, 3171 (1970);
M.G. Smoes, Nucl. Phys. B20, 237 (1970);
D. Yu. Bardin and S.M. Bilen’kii, Yad. Fiz. 16, 557 (1972)
[Sov. J. Nucl. Phys. 16, 311 (1973)];
D. Yu. Bardin and E.A. Ivanov, Fiz. Elem. Chast. Atom. Yadra.
M 726 (1976) [Sov. J. Part. Nucl. Phys. 7,286 (1976)];
K.A. Milton and W.W. Wada, Phys. Lett. 98B, 367 (1981).
[5] S.G. Brown and S.A. Bludman, Phys. Rev. 136, 1160
(1964); J.N. Huang and C.Y. Lee, Phys. Rev. D27, 2227 (1983).
See Also P. De Baenst and J Pestieau, Nuovo Cim. 53A, 407 (1968)
and D. Bryman, P. Depommier and C. Leroy, Phys. Rep. 88, 151 (1982).
[6] J. Bijnens, G. Ecker and J.Gasser, Nucl. Phys. B396,
81 (1993); J. Bijnens et al., “Semileptonic Kaon Decays”, 2nd DAPHNE Physics Handbook, 315 (1994).
[7]We use the convention of the Particle Data Group[8],
where and are dimensionless and larger by a
factor of than in many theoretical papers and where a minus sign
precedes the interference term, thus changing their sign.
[8] C. Caso et al.,
Eur. Phys. J. C3, 1 (1998).
[9]At in ChPT, these form factors are closely
related to those of .
Thus, the vector form factor is predicted via CVC from the lifetime to
be and the axial form factor from the measured in
, .
[10] Y. Akiba et al., Phys. Rev. D32, 2911 (1985).
[11] J. Heintze et al., Nucl. Phys. B149, 365 (1979).
[12] C.H. Chen, G.Q. Geng, and C.C. Lih, Phys. Rev. D56,
6856 (1997); G-H. Wu and J.N. Ng, Phys. Rev. D55, 2806 (1997);
M. Kobayashi, T-T. Lin, and Y. Okada, Prog. Theor. Phys. 95, 361 (1996);
C.Q. Geng and S.K. Lee, Phys. Rev. D51, 99 (1995).
[13] M.S. Atiya et al., Nucl. Inst. Meth. A321, 129
(1992);
S. Adler et al., Phys. Rev. Lett. 79, 2204 (1997).
[14] The best-fit branching ratio in the
fit is
.
[15]
L. Amettler, J. Bijnens, A. Bramon, F. Cornet,
Phys. Lett. B303, 140 (1993).
[16]
J. Bijnens and P. Talavera,
Nucl. Phys. B489,387 (1997).
[17] M.R. Convery,
First Measurement of Structure Dependent ,
Princeton University Ph.D. thesis, 1996.
FIG. 1.: Spectral shape functions
for IB, , and components of .
The normalizations are arbitrary, and the scale on the
plot is logarithmic.
The component is not shown because
it peaks at low muon momentum and has negligible effect
on the current analysis.
FIG. 2.:
Side-view (a) and end-view (b) of
upper half of the E787 detector.
FIG. 3.:
(a) Spectrum of events passing all but the final kinematic cut.
At this point, nearly all events are except those in the
region MeV and MeV, where background
from and is concentrated.
The IB component of is concentrated at MeV.
The box marks the final cut of MeV and MeV,
within which the component is enhanced.
(b) Counts vs. and various fits as described in text.
FIG. 4.:
contours for the fit
to the vs. distribution.
(a) Contours for all plausible
values of the form factors. Each contour represents 50 units of .
(b) Near a minimum.
In this plot, each contour corresponds to one unit of .
The one-standard-deviation uncertainties
for and
are also shown.