A Review of Mixing: Past, Present and Future
Abstract
We review the experimental status of mixing. After a brief historical overview, current studies of the time dependence of oscillations are described, with an emphasis on the different experimental techniques used by the ALEPH, CDF, DELPHI, OPAL, and SLD Collaborations. To conclude, the outlook for future experiments is presented.
1 Introduction
In analogy to the system, the system consists of and flavor eigenstates, which are superpositions of heavy and light mass eigenstates and . Due to the difference in mass and width, the mass eigenstates evolve differently as a function of time, resulting in time-dependent flavor oscillations with a frequency equal the mass difference . As a consequence, an initially pure state may be found to decay as or at a later time with a probability density equal to or . (Here we have taken since in the Standard Model.)
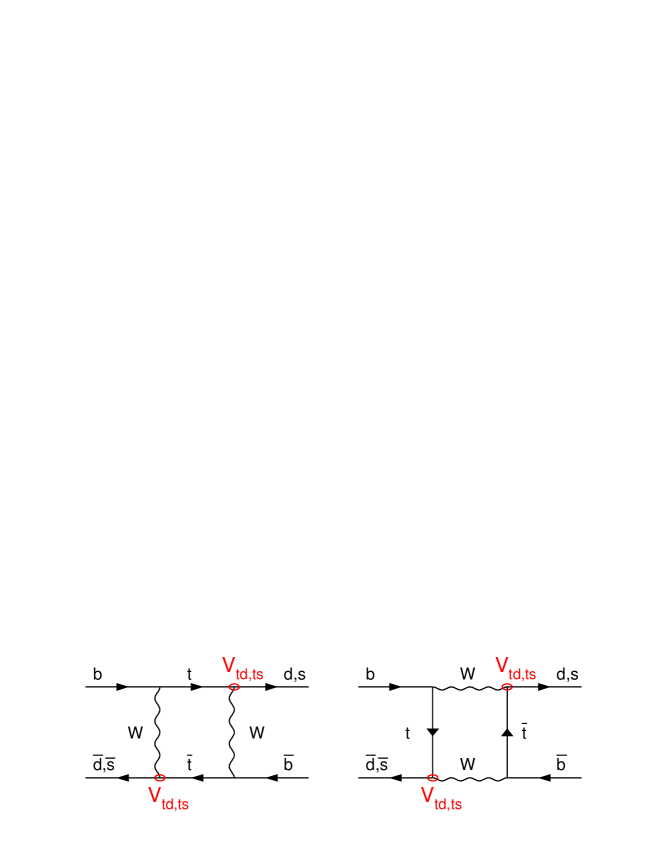
The oscillation frequency ( and for and ) can be computed via the second order box diagrams that induce transitions, see Fig. 1.
Calculations yield[1]
| (1) |
where is the Fermi constant, is the hadron mass, is the top quark mass, is the boson mass, is the Inami-Lim function,[2] and is a perturbative QCD parameter. The “bag” parameter and the decay constant parameterize hadronic matrix elements. Therefore, a measurement of the () oscillation frequency allows the CKM matrix element () to be determined. However, Lattice QCD calculations[3] of the product are plagued by an uncertainty of 20-25%. This uncertainty limits the precision of the extraction of from the fairly precise measured value[4] of the oscillation frequency ps-1. Theoretical uncertainties are significantly reduced in the ratio between and oscillation frequencies:[3]
| (2) |
Invoking CKM unitarity to obtain from the measured value for , one can then extract with good precision.
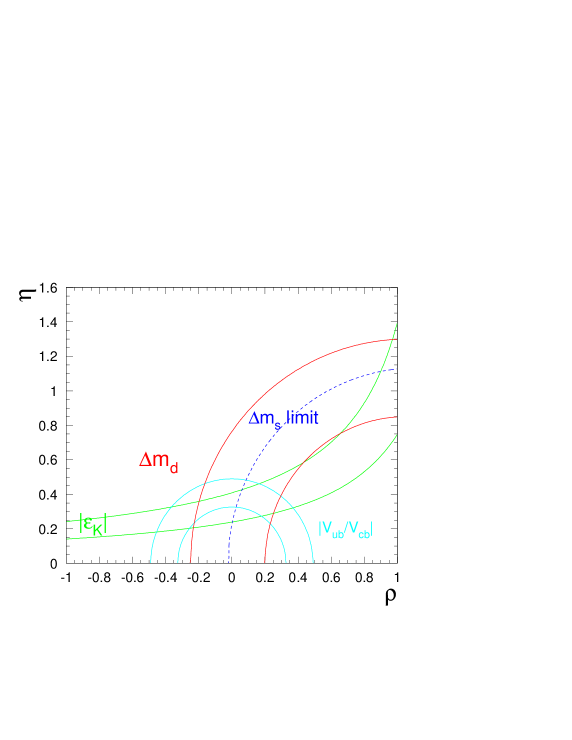
Determination of the CKM element is of great importance since it is sensitive to the CP violating phase in the Standard Model. In the Wolfenstein parameterization of the CKM matrix, and . The parameters and are well-known but and are not. A non-vanishing value for implies the existence of CP violation in weak decays. The impact of and measurements on the knowledge of the fundamental parameters and is presented in Fig. 2, along with the constraints from the measurement of CP violation in the system () and the measurement of transitions (). From the above parameterization, it is clear that oscillations are very fast: , which is of order 20. Resolving these rapid oscillations thus poses a serious experimental challenge.
2 Past
The first evidence for mixing was reported by UA1 in 1987 with a study of like-sign muon pairs produced in collisions.[5] The rate for like-sign pairs was found to exceed the expected background and was thus interpreted as evidence (2.9 ) for mixing. Later in the same year, conclusive evidence was presented by ARGUS in a study of like-sign dileptons produced by annihilation at the resonance.[6] ARGUS determined the time-integrated mixing probability to be . Such a large mixing probability came as a surprise and indicated that the top quark mass had to be very large.
Further studies of like-sign dilepton events produced in annihilation at the and resonances, as well as in collisions, confirmed the large rate of mixing. In 1993, the world averages were[7] () and (), where represents the average mixing probability over the different types of hadrons produced in decays, , where and are the fractions of and in the selected sample, respectively. Combining these two results, a lower limit on the oscillation frequency was obtained:[7] at 90% C.L.
In 1994, ALEPH extended the like-sign dilepton technique by incorporating the proper decay time to investigate the time dependence of mixing for the first time. Using a sample of 1 million hadronic decays, a direct limit of (95% C.L.) was obtained.[8] Shortly after, OPAL improved the limit to in a similar study based on 1.5 million decays.[9] These initial studies were limited mostly by the low efficiency of the dilepton event selection. Analyses were later improved by incorporating new vertex selection and tagging algorithms, as described in the next section.
3 Present
Studies of time-dependent oscillations require three ingredients: (i) reconstruction of the decay proper time, (ii) determination of the or flavor at production, and (iii) determination of the flavor at decay. Decays for which the production and decay flavors are different are tagged as “mixed”, otherwise they are tagged as “unmixed”. The significance for a oscillation signal can be approximated by[10]
| (3) |
where is the total number of decays selected, is the probability to incorrectly tag a decay as mixed or unmixed (i.e. the mistag rate) and is the proper time resolution. The proper time resolution depends on both the decay length resolution and the momentum resolution according to . The ability to resolve rapid oscillations thus requires excellent decay length and momentum resolution, and benefits from having a low mistag rate and a high purity.
Tagging of the production flavor is performed by combining several techniques. The most powerful technique exploits the large polarized forward-backward asymmetry of decays (available at SLD only). In this case, a left- (right-) handed incident electron tags the forward hemisphere quark as a () quark. Other tags used by most experiments rely on charge information from the hemisphere opposite that of the decay candidate (i.e. the hemisphere expected to contain the other hadron in the event): (i) charge of lepton from the direct transition , (ii) momentum-weighted jet charge, (iii) secondary vertex charge, and (iv) charge of kaon from the dominant decay transition . Information from the same hemisphere is also used: (i) unweighted (or weighted) jet charge, and (ii) charge of fragmentation kaon. The different tags are combined to provide effective mistag rates of for LEP experiments and up to for SLD.
The various analyses differ mostly in the way decay candidates are reconstructed, which in turn affects the quality of the decay flavor tag and the purity. Analyses can be grouped in three main categories: inclusive, semi-exclusive, and fully exclusive. Inclusive methods have the advantage of large statistics but suffer from low purity, whereas more exclusive methods yield small sample sizes but benefit from a much increased sensitivity per event.
3.1 Inclusive Methods
Inclusive reconstruction of semileptonic decays has been investigated by ALEPH, DELPHI, OPAL, and SLD. The method typically relies on the selection of identified leptons ( or ) with sufficiently large momentum transverse to the jet (the minimum is usually 1 GeV/c) in order to reduce the contribution from cascade decays (). Direct leptons from transitions contribute of all selected leptons. As a result, the decay flavor tag is very clean. The charm decay vertex is reconstructed topologically and the resultant “D” track is intersected with the lepton trajectory to define the decay point.
This method benefits from high statistics and a low mistag rate for the decay flavor tag but suffers from a low purity (typically 10-15%). The sensitivity of the method is enhanced by estimating the mistag rates, the purity and the proper time resolution event by event. For example, the most sensitive analysis by ALEPH selects 33023 events, with an estimated purity of 10.4% (close to the production fraction). The sample is divided into 11 subsamples with purity varying between 5% and 24%, depending upon the charm vertex track multiplicity, the charge and momentum of tracks in the vertex, as well as the presence of identified kaons in the vertex.
SLD has devised novel inclusive methods relying on the excellent tracking resolution provided by its CCD pixel vertex detector. In particular, the lepton+D vertex analysis achieves a decay length resolution m (60% fraction) and m (40%). The Charge Dipole analysis attempts to reconstruct the charged track topology of decays by reconstructing both secondary (“B”) and tertiary (“D”) vertices. The charge difference between the B and D vertices tags the decay flavor ( for and for ) with a mistag rate of 21%. This rate is considerably larger than that achieved with semileptonic analyses but it is compensated by the increase in statistics due to the fully inclusive selection.
3.2 Semi-Exclusive Methods
Semi-exclusive methods enhance the sensitivity to oscillations mostly by improving the purity and, to a lesser extent, the proper time resolution. This, however, comes at the cost of much lower efficiency. ALEPH, CDF, and DELPHI perform partial reconstruction in the modes and , where represents any charged hadron and the decay is either fully or partially reconstructed in the modes , etc.
The most sensitive single analysis performed by DELPHI selects 436 events. Despite the low statistics the analysis is competitive due to its high purity, estimated to be , and its good decay length and momentum resolution, m (82% fraction) and m (16%), (82% fraction) and (16%).
Analyses reconstructing final states benefit from increased statistics but their overall sensitivity is somewhat reduced due to lower purity and worse resolution.
3.3 Exclusive Methods
DELPHI has performed an exploratory analysis in which the decays are fully reconstructed in the modes , and , where the and decays are fully reconstructed. The analysis selects 44 candidates with an estimated purity of approximately 50% and an excellent decay length resolution of m (58% fraction) and m (42%). The uncertainty in momentum is essentially negligible and thus the oscillation amplitude is not damped at large proper time. Despite a high sensitivity per event, the analysis is limited by the available statistics. Nevertheless, it is clearly the method of choice for future studies of mixing at hadron colliders (see Sec. 4).
3.4 World Average
The fit for the oscillation frequency is performed using the amplitude method.[10] In this method, the unmixed (mixed) probability density is expressed as . A fit is then performed to determine the oscillation amplitude “” at a series of fixed frequencies. Amplitude values of are expected for frequencies sufficiently different from the true oscillation frequency and a value of is expected at the true frequency. The amplitude method is thus similar to a normalized Fourier transform.
The measured amplitude at for the various analyses is shown in Fig. 3.

Also shown is the sensitivity of each analysis to set a 95% C.L. lower limit on . These analyses have been combined,[4] taking correlated systematic uncertainties into account and the resulting world average amplitude spectrum is shown in Fig. 4. Mixing (A=1) is excluded for at 95% C.L., a limit close to the expected sensitivity of 14.5 (obtained by setting the measured amplitude to zero).
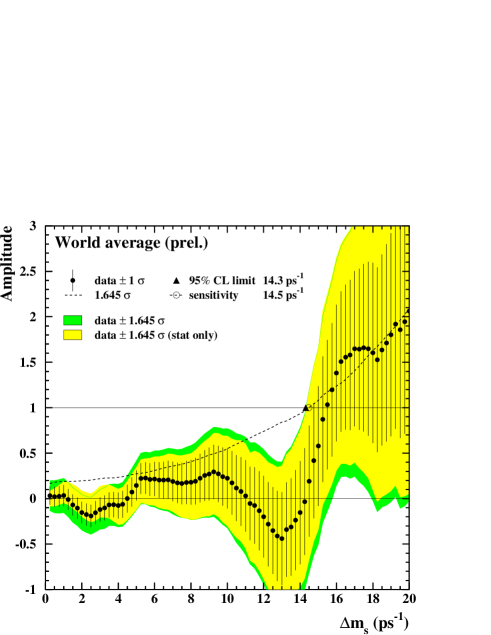
Beyond that limit, the uncertainties become too large (due to the limited proper time resolution) to discriminate between mixing and no mixing.
4 Future
In the near future, ALEPH, DELPHI, OPAL, and SLD expect to further improve their sensitivity by adding new analysis techniques and refining existing analyses. Beyond LEP and SLD, future experiments at hadron machines are expected to bring the study of oscillations to a new level. By exploiting the tremendous cross section for hadrons at those machines and designing new trigger schemes aimed at identifying secondary vertices, HERA-B expects to observe a signal for up to , whereas CDF, BTeV, and LHC-b expect to observe a signal for up to about 40 , 40 , and 48 , respectively. If a signal is found, the statistical precision on is predicted to be excellent (e.g., LHC-b expects to achieve a precision better than 0.1%).
Acknowledgements
I wish to thank the following people for their help: G. Blaylock, R. Forty, R. Hawkings, M. Paulini, P. Roudeau, O. Schneider, and A .Stocchi.
References
- [1] A.J.Buras, W.Slominski, and H.Steger, \Journal\NPB3453691984.
- [2] T.Inami & C.S.Lim, Prog. Theor. Phys. 65, 297 (1981).
- [3] T. Draper, Nucl. Phys. Proc. Suppl. 73, 43 (1999).
- [4] B Oscillations Working Group, CERN-EP preprint, in preparation; see also http://www.cern.ch/LEPBOSC/.
- [5] C. Albajar et al., \Journal\PLB1862471987.
- [6] H. Albrecht et al., \Journal\PLB1922451987.
- [7] H.-G. Moser, CERN-PPE-93-164, September 1993.
- [8] D. Buskulic et al., \Journal\PLB3224411994.
- [9] R. Akers et al., \Journal\ZPC665551995.
- [10] H.-G. Moser & A. Roussarie, \Journal\NIMA3844911997.