Charged Pion Energy Reconstruction in the ATLAS Barrel Calorimeter
M. Bosman
Universitat Autònoma de Barcelona
Institut de Física d’Altes Energies
Barcelona, Spain
Y. Kulchitsky
JINR, Dubna, Russia
&
Institute of Physics,
National Academy of Sciences, Minsk, Belarus
M. Nessi
CERN, Geneva, Switzerland
Abstract
The intrinsic performance of the ATLAS barrel and extended barrel calorimeters for the measurement of charged pions is presented. Pion energy scans ( and GeV) at two pseudo-rapidity points ( and ) and pseudorapidity scans () with pions of constant transverse energy ( and GeV) are analysed. A simple approach, that accounts in first order for non-compensation and dead material effects, is used for the pion energy reconstruction. The intrinsic performances of the calorimeter are studied: resolution, linearity, effect of dead material, tails in the energy distribution. The effect of electronic noise, cell energy cuts and restricted cone size are investigated.
1 ATLAS Calorimetry
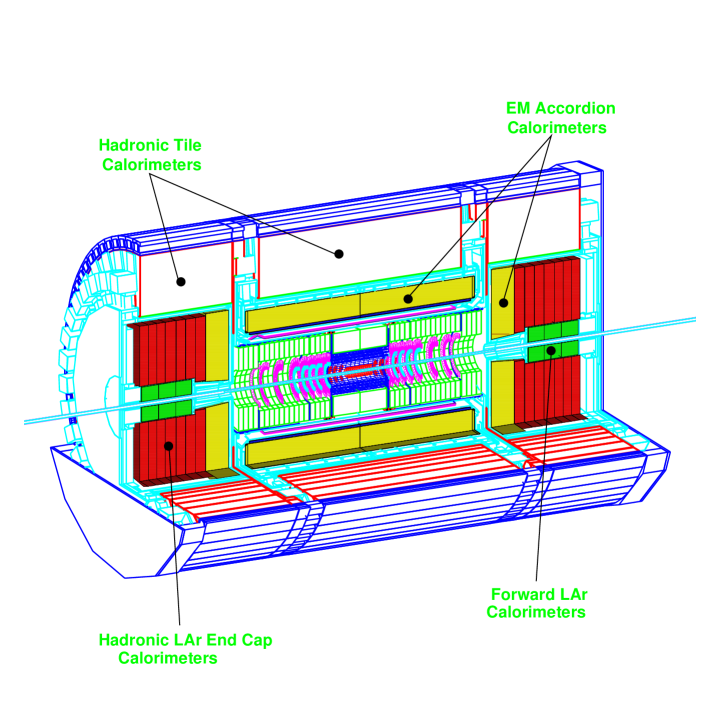
A view of the ATLAS calorimeters [1] is presented in Figure 1. The calorimetry consists of an electromagnetic (EM) calorimeter covering the pseudorapidity region , a hadronic barrel calorimeter covering , hadronic end-cap calorimeters covering , and forward calorimeters covering .
The EM calorimeter is a lead/liquid-argon (LAr) detector with accordion geometry [2]. Over the pseudorapidity range , it is preceded by a presampler detector, installed immediately behind the cryostat cold wall, and used to correct for the energy lost in the material upstream of the calorimeter.
The hadronic calorimetry of ATLAS, presented in Figure 1, consists of three main devices. In the barrel region () there is the scintillating Tile Calorimeter [3]. The Hadronic End-cap LAr Calorimeter (HEC) extends up to . The range is covered by the high density Forward Calorimeter (FCAL). Up to the basic granularity of the hadron calorimeters is . This region is used for precise measurements of the energy and angles of jets. In the region , the basic granularity is approximately .
A more detailed description of all ATLAS calorimeters is given in the Calorimeter TDRs ([1], [2] and [3]).
The performance of the barrel and extended barrel sections of the ATLAS hadronic calorimeter for the measurement of charged pion energy is studied. The intrinsic energy resolution, the effects of dead material, electronic noise and limited cone size are discussed.
2 Energy Resolution
In the barrel region, the response of the calorimeter was studied at two pseudorapidity values: (central barrel) and (extended barrel). First, the energy sampled in the different calorimeter compartments is converted to the total deposited energy using the electromagnetic energy scale (EM scale). The intrinsic performance of the calorimeter is studied: the energy considered is not restricted to a cone and electronic noise is not added. These effects are discussed later in Section 4. The algorithm to reconstruct the pion energy is similar to the ”Benchmark Method” used to analyse the combined LAr-Tile test beam data [4]
| (1) |
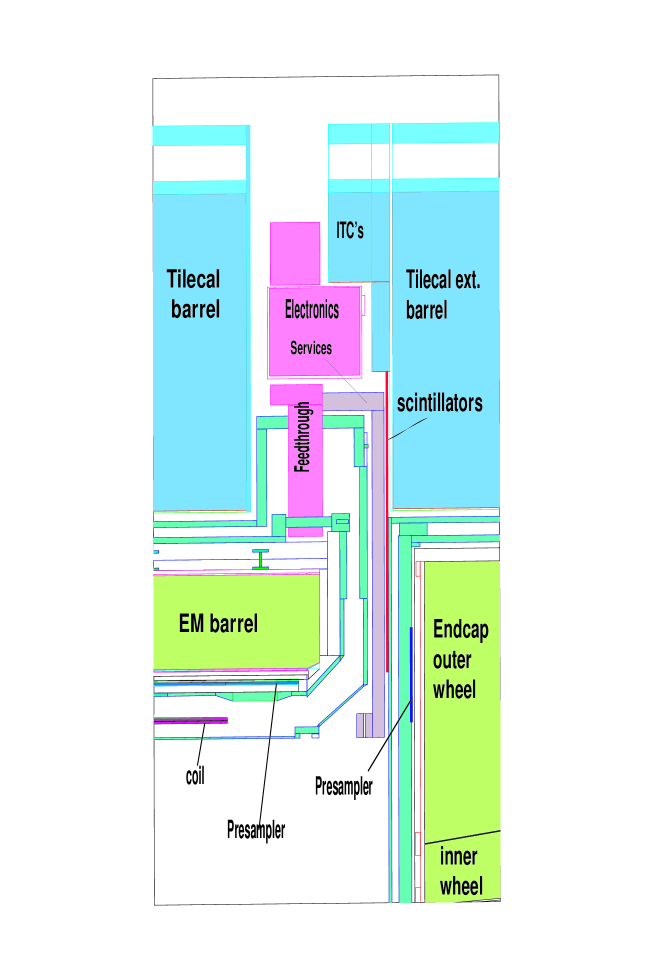
The coefficients and take into account the different response of the EM and Hadronic Calorimeters to the pion energy. The quadratic term provides an additional first order correction for non-compensation (the coefficient is negative, it suppresses the signal for events with a large fraction of electromagnetic energy). The term estimates the energy loss in the cryostat wall separating the LAr and Tile Calorimeters. In the central barrel, the energy is taken from the geometric mean of the energies in the last compartment of the LAr EM barrel () and the first compartment of the Tile barrel calorimeter (; whereas in the extended barrel the energy is taken from the geometric mean of the energies in the outer wheel of the EM end-cap and the first compartment of the Tile extended barrel calorimeter. The term corrects for the energy loss in the dead material in the vertical gap between the Tile central and extended barrels. It is sampled by the two Intermediate Tile Calorimeter (ITC) modules (see Figure 2). The last term corrects for the energy loss in the barrel and end-cap vertical cryostat walls (see Figure 2).
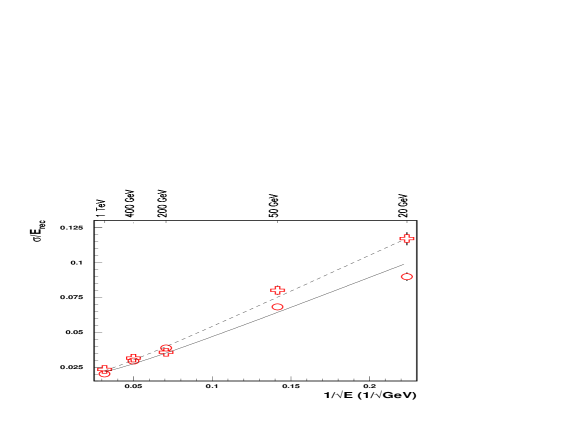
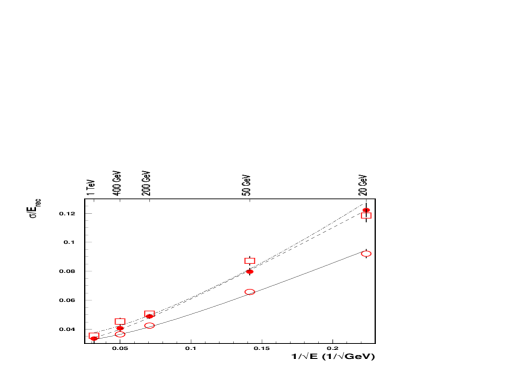
The response and the energy resolution for pions in the energy range from to at and 1.3 are shown in Figures 3 and 4. The open crosses show the results when the coefficients of Equation (1) are independent of energy. With the simple ”Benchmark Method”, the effect of non-compensation is not fully corrected for and there is a residual non-linearity of the pion response of the order of between 20 GeV and 1 TeV. The test beam data show a 10% residual non-linearity between 20 and 300 GeV when using the same reconstruction method [4], reflecting the fact that G-CALOR [5] predicts a lower degree of non-compensation and may not describe correctly the energy dependence of the fraction of electromagnetic energy produced in the pion interaction. The energy dependence of the resolution is fitted with the two-term formula
| (2) |
where the sampling term is given in and the constant term in . Although the resolutions obtained for low-energy pions are similar in both cases, at high energy there is some longitudinal leakage in the central barrel, yielding a resolution at 1 TeV of 3% instead of the 2% obtained in the extended barrel. When energy dependent parameters are applied (solid dots), the linearity of the response is restored 111The 1% residual non-linearity at 20 GeV results from the fact that the coefficients were obtained by minimizing the expression without the addition of a linear term with a Lagrange multiplier. and the resolution improved. The results are presented in Table 1:
| () | () | |
| 0.3 | ||
| 1.3 | ||
3 Pseudorapidity Scan
A pseudorapidity scan with pions of constant transverse energy and 50 GeV was carried out to check that the linearity of the response can be maintained across the pseudorapidity range covered by the barrel and the extended barrel, and that no significant tail appears in the line shape. The algorithm, characterised by Equation (1), with energy dependent parameters was applied. The parameters were adjusted independently for the six sets of pion data, each one covering an interval of 0.4 in pseudorapidity.
The energy resolutions obtained for the two scans are shown in Figure 5. The solid lines show the energy resolution corresponding to Equation for GeV and for GeV. This performance allows to fulfil the goal for the jet energy resolution of the ATLAS hadronic calorimetry in the region of .
In the region of the cracks between the calorimeters, from about to , where the amount of dead material is the largest, the resolution is somewhat worse.
Figure 6 shows the linearity of the response across . The fitted mean is plotted for each interval of 0.05 in . The RMS of the mean is 1.1% for GeV and 2.0% for GeV.
In addition, the tails of the distributions of the reconstructed energy were investigated. Figure 7 shows the events with a pion response more than three standard deviations away from the mean. No significant tails are present: the fraction of events in the tails does not exceed 1 – 2%. A few events out of a total of 5000 events per energy scan, mostly from the sample of pions of GeV, deposit relatively little energy. These correspond to pions decaying to muons before reaching the calorimeter.
4 Effects of Electronic Noise and Cone Size
The results presented so far were obtained without any restriction on the pion reconstruction volume. These results characterise the intrinsic performance of the calorimeters. The presence of electronic noise does not allow integration over a too wide region, therefore the measurement of the pion energy must be restricted to a cone
| (3) |
A compromise has to be found between the pion energy lost outside of this cone and the noise included inside. The optimum varies as a function of pseudorapidity, since the showers have a width which is characterised by the polar angle whereas the calorimeter cells subtend intervals of constant pseudorapidity. Hence, at higher values of pseudorapidity, the showers extend laterally over more cells.
For a cone of (), the noise is above 3 GeV (1.5 GeV). Digital filtering [6] allows noise suppression (approximately by a factor 1.6). But even this level of noise is large and is comparable to the intrinsic resolution of the calorimeters for pions with energy of a few tens of GeV. A smaller cone of is preferable from this point of view; after digital filtering, noise can be kept around 1 GeV in the barrel region and below 3 GeV in the pseudorapidity region covered by the extended barrel.
The response and the energy resolution in the barrel region are presented in Figures 8 and 9 as a function of the cone size used for the pion energy reconstruction. Energy losses outside a cone noticeably increase with decreasing cone size, especially for 50 GeV pions. The energy resolution also becomes worse, but it is still acceptable for the cone of .
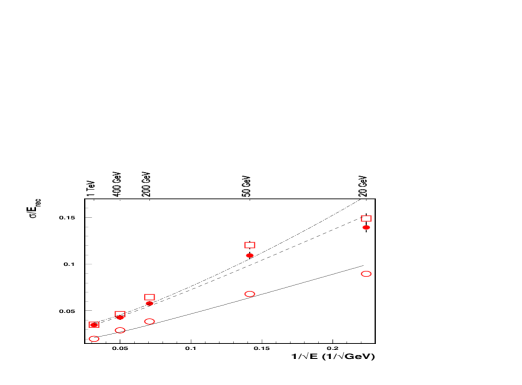
Selecting cells with energy deposition above a certain threshold decreases the noise contribution. A study to optimise the cone size and the noise cut was performed in the barrel region. A -noise applied to the calorimeter cells within a cone of leads to the best energy resolution. In Figure 10, the energy dependency of the resolution is plotted for two pseudorapidities: and . The energy dependence of the resolution can be parametrised by the equation 2 with an additional noise term:
| (4) |
where is given in . The results of the fit with the formula of Equation 4 are presented in Table 2.
5 Conclusions
The response of the barrel and extended barrel region of the ATLAS calorimeter system to single charge pions was investigated using full simulation. Pion energy scans from GeV to GeV and pseudo rapidity scans with pions of constant transverse energy ( and GeV) have been analysed. For the pion energy reconstruction, the ”Benchmark approach” was used: it provides a first order correction for non-compensation effects and accounts for the effect of the dead material by using the ITC’s and scintillators to sample the energy loss or interpolating between the energy deposited in adjacent calorimeter layers.
Energy and rapidity dependent and independent calibrations have been considered. The best results are obtained with energy and rapidity dependent parameters. The effect of electronic noise has been studied: cone size and cell energy cuts have been optimised. The energy dependence of the resolution can be parameterized as: at and at . The larger constant term at can be explained by the longitudinal leakage from calorimeters in this region. The resolution, obtained for the pseudorapidity scans, is represented by: for GeV, for GeV, in the full range, except from about to , where the resolution is deteriorated by the energy loss in the dead material although no significant tails in the energy spectrum appears.
Acknowledgements
The authors are grateful to Andrei Kiryunin for fruitful discussions.
References
- [1] ATLAS Collaboration, Calorimeter Performance Technical Design Report, ATLAS TDR 1, CERN/LHCC 96-40 (1996).
- [2] ATLAS Collaboration, Liquid Argon Calorimeter Technical Design Report, ATLAS TDR 2, CERN/LHCC 96-41 (1996).
- [3] ATLAS Collaboration, Tile Calorimeter Technical Design Report, ATLAS TDR 3, CERN/LHCC 96-42 (1996).
- [4] ATLAS Collaboration (TILECAL), Z. Ajaltouni et al., CERN-PPE-96-178 (1996) 28 p., CERN, Geneva, Switzerland; Nucl. Instrum. Meth. A387 (1997) 333-351.
- [5] T.A. Gabriel and C. Zeitnitz, Nucl. Inst. Meth. A349 (1994) 106.
- [6] W.E. Cleland and E.G. Stern, Nucl. Inst. Meth. A338 (1994) 467.
 |
 |
 |
 |
 |
 |
 |
 |
 |
 |
 |
 |
 |
 |
 |
 |