Low energy atmospheric muon neutrinos in MACRO
Abstract
We present the measurement of two event samples induced by atmospheric of average energy . In the first sample, the neutrino interacts inside the MACRO detector producing an upward-going muon leaving the apparatus. The ratio of the number of observed to expected events is with an angular distribution similar to that expected from the Bartol atmospheric neutrino flux. The second is a mixed sample of internally produced downward-going muons and externally produced upward-going muons stopping inside the detector. These two subsamples are selected by topological criteria; the lack of timing information makes it impossible to distinguish stopping from downgoing muons. The ratio of the number of observed to expected events is . Using the ratio of the two subsamples (for which most theoretical uncertainties cancel) we can test the pathlength dependence of the oscillation hypothesis. The probability of agreement with the no-oscillation hypothesis is .
The deviations of our observations from the expectations has a preferred interpretation in terms of oscillations with maximal mixing and . These parameters are in agreement with our results from upward throughgoing muons, induced by of much higher energies.
The results from several underground detectors which measure the flux of atmospheric neutrinos give strong indication that ’s oscillate into neutrinos of another type [1, 2, 3]. Fully-contained and partially-contained neutrino-induced events observed in underground detectors come from neutrinos of energy . The flux of atmospheric neutrinos of several tens of can be inferred from the measurement of neutrino-induced upward-going muons that traverse the entire detector (up-throughgoing muons). The hypothesis of neutrino oscillations, with best-fit parameters and in the range of a few times 10-3 eV2, can explain the observed anomalies both in the ratio of contained to events (Super-K, Soudan 2) and in the zenith angle distribution of up-throughgoing muons (MACRO, Super-K).
The MACRO detector measures both the high energy (median energy ) and few energy atmospheric neutrino fluxes. In Ref. [3, 4] the interpretation of the data in terms of oscillations came from a deficit and from an anomalous zenith angle distribution of the observed up-throughgoing muons originating from interactions in the rock below the detector. Here we report on the measurement of the flux of lower energy ) atmospheric neutrinos through the detection of interactions inside the apparatus (yielding partially contained upgoing and downgoing muons) and by the detection of externally produced upward-going muons stopping inside the detector [5].
MACRO [6] is a large area, modular tracking detector located in Hall B of the Gran Sasso Underground Laboratory in Italy, with an average rock overburden of 3700 hg/cm2. It is a rectangular box, 76.6 m 12 m 9.3 m, divided longitudinally into six supermodules and vertically into a lower part (4.8 m high) and an upper part (4.5 m high). The active detection elements are planes of streamer tubes for tracking and liquid scintillation counters for fast timing. The lower half of the detector is filled with streamer tube planes alternating with trays of crushed rock, which provide most of the 5.3 target mass for partially-contained neutrino interactions. The upper part is hollow and contains the electronics racks and work areas. There are 10 horizontal streamer tube planes in the bottom half of the detector, and 4 planes on the top, all with wire and 27∘ stereo strip readouts. Six vertical planes of streamer tubes cover each side of the detector. The intrinsic angular resolution for muons is between 0.1∘ and 1.0∘ depending on the track length. The scintillator system consists of three widely-separated layers of horizontal boxes, and on each vertical side of the detector a layer of vertical boxes inserted between the streamer tubes. The time (position) resolution for muons in a scintillator box is about 500 ps ( cm). The direction of the muons passing across MACRO is determined by the time-of-flight between two layers of scintillation counters.
The results presented in this letter come from 4.1 live years of data taking with the full detector, from April 1994 to February 1999.

About downgoing muons were collected, and were used to monitor the detector efficiency, the running conditions and the acceptance. The trigger rate due to downgoing muons is . The trigger efficiency for each scintillation counter and for the streamer tubes was monitored over the data taking period using the downgoing muons.
Two samples of atmospheric muon neutrinos in the few- energy range are measured. In the first sample (up partially-contained or =Internal Upgoing events) there are (mainly) events induced by charged current (CC) interactions of upgoing inside the lower part of MACRO. An upgoing muon is produced, which crosses two scintillation layers (Fig. 1), so that the measurement of the direction is made through time-of-flight.
The second sample is a mix of upgoing and downgoing events. The partially contained downgoing events (down partially-contained or =Internal Downgoing ) are induced by downgoing , interacting in the lower part of MACRO. The upgoing stopping events ( = Upward Going Stopping muons) are induced by interactions of upgoing below the detector yielding an upgoing muon which stops inside the detector. Both the down partially-contained and the upgoing stop events cross only the bottom layer of liquid scintillation counters (see Fig. 1) and are identified by means of topological criteria. The lack of timing information makes it impossible to distinguish between the two subsamples. Fig. 2 shows the parent neutrino energy distribution from a Monte Carlo calculation for the three event topologies detectable in MACRO. The energy spectrum and the median energy of the two samples presented in this letter are almost the same.

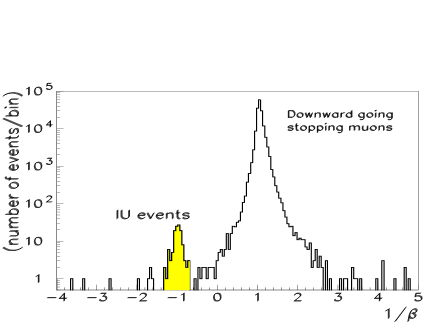
The identification of events is based on topological criteria and time-of-flight measurements. The main requirement is the presence of at least two hit scintillator clusters, respectively in the center layer and in the upper part of the apparatus (see Fig. 1). This is the expected topology for a neutrino interacting in the lower detector and producing an upward-going muon with enough energy to exit the apparatus. It is also the topology of the much more numerous downgoing muons stopping in the lower detector. Scintillation timing allows the separation of the two classes of events. Moreover, the scintillators are required to match a streamer tube track reconstructed in space by our standard track-finding algorithms [6]. For candidates, the lowest point of a track (the starting point) must be inside the apparatus as a condition for the containment of the interaction vertex. To reject fake partially-contained events entering from a detector insensitive zone, the extrapolation of the track in the lower part of the detector must geometrically cross and not fire at least one scintillator layer and one streamer tube plane, or at least three planes of streamer tubes. These conditions were tuned on Monte Carlo simulated events, including evaluation of detector inefficiencies. Other cuts are applied to reject background events from downgoing atmospheric muons. They are related to the goodness of the geometrical agreement between scintillator hits and the streamer track, to the proper operation of the scintillation counters and to the quality of the time measurement. The measured distribution after all analysis cuts (including the requirements of vertex containment) is shown in Fig. 3. The measured muon velocity is evaluated with the sign convention that upgoing muons have . A total of 121 events survive in the range , which is taken as the range of signal.
From the time distribution of Fig. 3 one expects some background events; they are mostly due to wrong time measurements or secondary particle hits, yielding an almost flat distribution. The fit of the distribution in the range to a gaussian plus a straight line gives an estimated background of 5 events in the signal region. After background subtraction, we have 116 up partially-contained events.
The identification of events is based on topological criteria. The candidates have a track starting (ending) in the lower apparatus, and crossing the bottom detector face. The track must also be located or oriented in such a way that it could not have entered or exited undetected through insensitive zones in the apparatus. Events with scintillator hits outside the bottom layer, or with the reconstructed track pointing to a detector insensitive zone between modules, are rejected. The standard muon tracking procedure [6] is based on at least four aligned hits in the streamer tubes. This corresponds to a minimum traversed detector thickness (standard sample). A dedicated retracking procedure was applied to all remaining events. The retracking procedure requires at least three streamer tube hits (), aligned with respect to a fired scintillation counter in the bottom layer. The number of retracked events is (to be compared with the standard muon tracks); these events follow the same analysis as the standard sample.
After the software cuts, 879 events survive. Some of them are tracked incorrectly (mostly by the retracking), or are bending downgoing muons, entering from a detector insensitive zone. Due to the bending, only a fraction of the streamer tube hits are used by the tracking algorithms. In order to reject these fake candidates, we made a double scan with the MACRO Event Display[6]. To eliminate any bias from the scan procedure, and to evaluate the absolute and relative scanning efficiencies, Monte Carlo (MC) simulated events (described below) were randomly injected into the data sample before the scanning stage. Two physicists independently scanned the merged sample. At the end of the scan, 200 events in the real data (106 candidates are retracked events) are accepted as upgoing stopping or partially contained downgoing muons. 97% of the real events selected by one physicist were also selected by the other.
Downgoing muons which pass near or through the detector may produce low-energy, upgoing particles, which could simulate neutrino-induced upgoing muons if the downgoing muon misses the detector. This background has been evaluated using a full simulation, based on our measurements [7]. The background is events. A second background source could arise from atmospheric muons and detector inefficiency. Using a simulated sample of atmospheric muons, which includes measured detector inefficiencies, no events were selected by the above described procedure. After background subtraction, 193 events represent the down partially-contained plus upgoing stopping signal.
The expected number of neutrino-induced events was estimated from GMACRO [6], a GEANT-based [8] full MC detector simulation. The and interaction rates have been computed using the atmospheric neutrino flux of the Bartol group [9] and the neutrino cross sections of Ref. [10]. In this cross-section model, the contributions of the exclusive channels of lowest multiplicity (quasi-elastic and single pion production) are calculated separately from deep inelastic scattering (DIS). The DIS contribution to the N cross section was computed using the GRV-LO-94 [11] parton distribution functions. Using these neutrino fluxes and cross sections for , we expect a total () interaction rate of and . Two simulated samples have been generated, because of the different vertex locations for the and the events; the simulated events were processed with the same analysis chain as the data.
For the events, a sample of interactions inside the apparatus was generated (equivalent to years live time). The simulation indicates (see Table 1) that of detected events come from charged current (CC) interactions, from CC and the remaining fraction from neutral current (NC) interactions. Due to detector inefficiencies and analysis algorithm failures, some neutrino-induced events originating in the rock surrounding the detector are expected to contribute to the selected sample of up partially-contained events (upward-throughgoing ’s appearing as partially-contained). The vertex containment requirements reduce this background to about , evaluated using a simulated sample of up throughgoing muons [3]. The fully-automated selection gives a total number of 202 expected events in the event signal region, for of live-time .
For the events, neutrino interactions were simulated in a larger volume (including the experimental hall, the detector and the surrounding rock). The generated events correspond to a live time of . The dimensions of the interaction volume (with of rock below the detector, and a total rock mass of plus of the apparatus itself) were chosen to reduce to less than the number of -induced stopping muons produced outside that volume. The 2199 events which survived the software selection for the were merged with the real events which passed the same software selection, and visually scanned. After the scan procedure 2074 (=94.3%) of the simulated and reconstructed events were accepted, together with the 200 real events. The expected rate is 273 events in live-time. In Table I we give the main features of the and simulated samples (expected rate, percentage of CC interactions, median parent neutrino energy, and fraction of events induced by upgoing neutrinos).
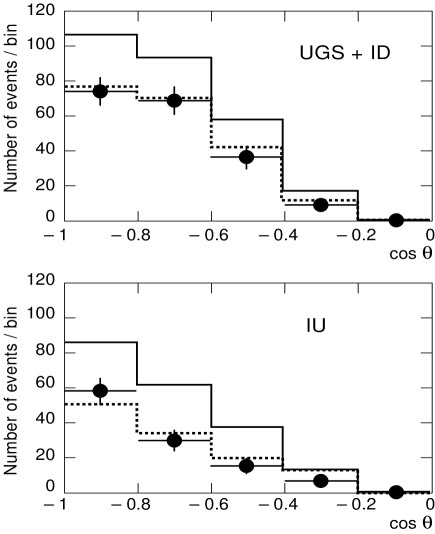
The number of detected events in the 4.1 live-time is 116, while the expected number is 202. The ratio of the measured to the expected events is . For the sample, 193 events are detected while 273 are expected. The ratio is . Each data set is (within errors) consistent with a constant deficit (43% for the sample, 29% for the ID+UGS) in all zenith bins compared to the Monte Carlo expectations assuming no oscillations. Fig. 4 shows the zenith angle distributions for the two measured data sets and for the Monte Carlo simulations. Due to the analisys cuts and to the apparatus acceptance, there are no events in the last bin of the two distributions. The expectations are affected by a systematic theoretical error due to the uncertainties regarding the atmospheric neutrino flux and the neutrino cross sections. At present there is no unique and reliable estimate of the total theoretical uncertainty for the rate calculations. Each experimental group, and for each event category, has its own way to estimate it. For this analysis we conservatively estimate 20% for the flux and 15% for the cross section, which add in quadrature to an error of 25%. For our high energy events [3] we quoted 17%, while in the recent SuperKamiokande [12] analysis of neutrino-induced stopping muons 22% was quoted .
Our measured value of is quite far from its expected value of unity. If we ignored theoretical errors (i.e. if we assumed the flux and cross section as we modeled them were accurate), an experiment with our statistical and experimental uncertainties would only fluctuate so far from unity with probability . However, if we take the theoretical error into account, the probability becomes . also differs from unity, though not as significantly as .
If the observed deficit were due only to an overall theoretical overestimate of the neutrino flux or cross sections, one would expect (small differences would remain due to residual geomagnetic effects). Furthermore, the theoretical uncertainties largely cancel if the ratio between the measured number of events is compared with the expectation. The partial error cancellation arises from the almost identical energy spectra of parent neutrinos for the two samples of events; we evaluated the remaining error as 5%. The experimental systematic uncertainty for the ratio is estimated at 6%. The measured ratio is , while the expectation without oscillations is . The probability to obtain a ratio so far from the expected one is 5%, almost independent of the neutrino flux and neutrino cross sections used for the predictions.
We investigated if the observed discrepancies between data and expectations could be explained by possible systematic effects. The detector mass is known to . The uncertainty for the detector acceptance was estimated by comparing the shape of the zenith distribution of downward-going muons stopping inside the detector with a MC expectation based on the known rock overburden: the two distributions agree within . Other uncertainties arise from the live-time estimate (), the effective containment of the interaction vertex depending on the simulation of the detector response to internal neutrino interactions () and the background subtraction (). Adding all these contributions in quadrature yields our quoted experimental systematic uncertainty of , too small to account for the observed discrepancy.
The number of expected events was also evaluated using the NEUGEN neutrino event generator [13] (developed by the Soudan and MINOS collaborations) as input to our MC simulations. The NEUGEN generator predicts fewer (ID+UGS) events than our default generator [10], well within the estimated systematic uncertainty for neutrino cross sections ().
Our data disfavor the no-oscillations hypothesis regardless of overall normalization; they are consistent with neutrino oscillations ( disappearance) with maximal mixing and . As a “test point”, we use the best-fit parameters from our high-energy analyses [3, 14], and . The predicted numbers of events and the angular distributions are indicated by the dashed histograms in Fig. 4; they are in good agreement with the measured data.
For , upgoing neutrinos (which induce and events), which travel thousands of kilometers through the Earth, are reduced by . Almost no reduction is expected for downgoing partially-contained muons. In this scenario, and for a pure CC interaction sample, the expected event rate is 1/2 of the and 3/4 of the predictions without oscillations. The predicted reduction for upgoing is less than 1/2 because of the and NC event contaminations. Our data disfavor , for which the events are also reduced; both the and event rates are of the no-oscillations expectation. We also disfavor , for which the shape of the angular distributions (Fig. 4) is modified.
Assuming oscillations (with the “test point” parameters) 115 up partially-contained and 202 down partially-contained plus upgoing stopping events are expected. For the events, the reduction from the no oscillations hypothesis is 0.57, to be compared with the measured value of . For the events, it is 0.76, to be compared with . The quoted numbers use our default normalization. Recent flux calculations [15] suggest that the Bartol flux which we use may be too high (though within the quoted theoretical error). As far as the event rates are concerned, a lower normalization of the flux can still be partially compensated at low energies by different interaction cross sections for neutrinos.
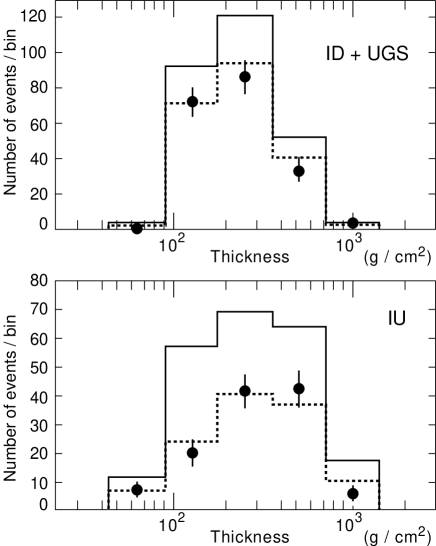
The event distributions as a function of the muon pathlength inside the detector have also been studied, as an independent consistency check. In Fig. 5 the data (black points) are compared with the MC expectation (solid lines for no neutrino oscillations; dashed lines for oscillations at our test point). The shapes are similar, and the data prefer the reduced normalization of the oscillation prediction.
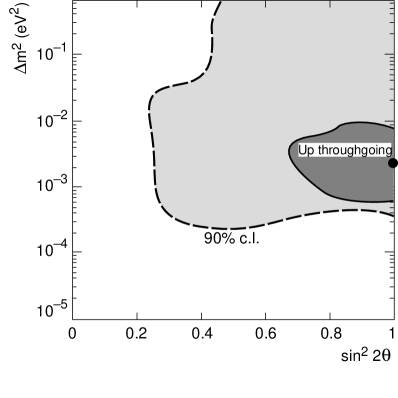
We estimated the most likely values of and using a method for data and Monte Carlo for the data of Fig. 4. The was computed with ten degrees of freedom: the histograms ( bins, normalized so as to contain only distribution shape information), the ratio and the overall normalization. The statistical and systematic errors are added in quadrature; the systematic uncertainty is 10% in each bin of the angular distributions, 5% for the ratio, and 25% for the normalization. Fig. 6 shows the 90% confidence level region, based on the application of the MC prescriptions of Ref. [16] on a grid. The expected flux for a given point of in the grid is obtained by weighting each simulated event with its surviving probability in that bin. The maximum of the probability (97%) occurs at ; this probability is almost constant in the interval . In the region of the maximum, the flux normalization factor is in both data sets ( i.e. the data are 2% higher than the oscillated predictions with our normalization).
In conclusion, we presented measurements of two samples of events induced by relatively low-energy neutrinos () interacting in MACRO or in the surrounding rock. The neutrinos originate from cosmic ray interactions in the upper atmosphere above the detector (downgoing events) or up to away on the opposite side of the Earth (upgoing events). The ratio of the number of observed to expected events (no oscillations) is for the events and for the . Within statistics, the observed deficits are uniform over the zenith angle. From the ratio of to , the probability that there is an overall reduction in the number of neutrino-induced muons is 5%. The hypothesis of muon neutrino oscillations explains the different deficits in and events with higher probability. The large theoretical uncertainties for the neutrino flux and cross sections is dominant in each data set; the ratio of the two low energy samples is dominated by statistical uncertainties. The regions with and are allowed at C.L. The best region corresponds to maximal mixing and . This result confirms the scenario proposed by the measurement of higher-energy neutrino-induced muons by MACRO [3, 14], as well as by other experiments [1, 2], all of which favor the oscillation hypothesis with maximal mixing and of a few times .
| Rate | CC | |||
|---|---|---|---|---|
| () | (%) | (GeV) | (%) | |
| IU | 49.3 | 87 | 4.2 | 94 |
| ID+UGS | 66.7 | 87 | 3.5 | 51 |
We acknowledge the support of the staff of the Gran Sasso Laboratory and of the Institutions participating in the experiment. We thank the Istituto Nazionale di Fisica Nucleare (INFN), the U.S. Department of Energy and the U.S. National Science Foundation for their support. We thank INFN, FAI, ICTP (Trieste), NATO and WorldLab for providing fellowships and grants for non-Italian citizens.
REFERENCES
- [1] SuperKamiokande Collaboration, Y. Fukuda et al., Phys. Rev. Lett. 81 (1998) 1562.
- [2] Soudan 2 Collaboration, W.W.M. Allison et al., Phys. Lett. B449, (1999) 137.
- [3] MACRO Collaboration, M. Ambrosio et al., Phys. Lett. B434 (1998)451.
- [4] MACRO Collaboration, M.Ambrosio et al, Phys. Lett. B357 (1995) 481.
- [5] Preliminary results were presented at the conferences/workshops of: Alcalà de Henares 1998, hep-ex/9808001; Vulcano 1998, hep-ex/9809003; Takayama 1998, hep-ex/9810008; DPF 1999, hep-ex/9903030; La Thuile 1999, hep-ex/9906019; ICRC 1999, INFN/AE-99/10(1999).
- [6] MACRO Collaboration, S. Ahlen et al., Nucl. Instr. and Meth. A324 (1993) 337.
- [7] MACRO Collaboration, M. Ambrosio et al., Astroparticle Physics 9 (1998) 105
- [8] R. Brun et al., CERN report DD/EE84-1 (1987).
- [9] V. Agrawal et al., Phys. Rev. D53 (1996) 1314.
- [10] P. Lipari et al., Phys. Rev. Lett.74 (1995) 4384.
- [11] M. Glück et al., Z. Phys. C67 (1995) 433.
- [12] SuperKamiokande Collaboration, Y.Fukuda et al., Neutrino-induced upward stopping muons in Super-Kamiokande, hep-ex 9908049-v3 (1-Dec-1999).
- [13] Private communication from the MINOS collaboration; see also H.M. Gallagher, Neutrino Oscillation Searches with the Soudan 2 Detector, Ph.D. thesis, University of Minnesota (1996).
- [14] MACRO Collaboration, (Neutrino oscillations at high energies by MACRO), INFN/AE-99/09. hep-ex 9905025.
- [15] G. Battistoni et al., hep-ph 9907408, to be published in Astroparticle Physics.
- [16] G.Feldman and R.Cousins, Phys. Rev. D57 (1998)3873.