A partial wave analysis of the system produced in charge exchange collisions
Abstract
A partial wave analysis of the system produced in the charge exchange reaction: at an incident momentum of is presented as a function of invariant mass, , and momentum transfer squared, , from the incident to the outgoing system. For small values of , the -wave intensity shows a broad enhancement at low with a sharp dip in the vicinity of the . A dip is also observed in the vicinity of the . There is rapid variation of the to relative phase difference in these mass regions. For large values of , the appears as a bump. The , observed in the D-waves, is produced dominantly by -exchange at low values of and -exchange at higher values of .
13.25.Jx, 14.40.Cs
I Introduction
This paper reports on a high-statistics partial wave analysis (PWA) of the system produced in the charge exchange reaction: at an incident momentum of using data taken by experiment E852 at Brookhaven National Lab (BNL). The PWA was performed over the mass range from near threshold () to as high as in mass bins and in various bins in momentum-transfer-squared .
The mass and dependence of production in - induced reactions with one pion exchange (OPE) provides information on the process , involving the scattering of the lightest hadrons [1, 2, 3, 4, 5, 6, 7]. The extraction of amplitudes is, however, complicated by the presence of production mechanisms other than OPE [7, 8]. The and -dependence of the partial wave amplitudes and their relative phases, the focus of this paper, provide information on these mechanisms and the necessary input for future scattering studies.
The study of the system also bears on current issues in the spectroscopy of conventional mesons and non- mesons such as glueballs or mesonic molecules. In particular, the isoscalar scalar and tensor sectors have more states than can be accommodated within the conventional model. A recent review of light meson spectroscopy [9] includes a summary of the current experimental situation in these sectors. Non- candidates include the poorly understood and the glueball candidates and , all of which couple to the system [10]. Information about the masses,widths, and decay modes of these states, along with knowledge of their production mechanisms, as revealed by their dependences, will help in unraveling their substructure [11, 12, 13, 14, 15, 16]. A complete understanding of these states requires corresponding information from and final states as well. This paper presents information which may be used in such a program.
The of the system must have J even with both P and C positive. The isospin must also be even or for . The system is thus particularly attractive for investigation of scalar and tensor states as the PWA is simplified without the presence of odd angular momenta.
The reaction has been studied in experiments with incident momenta of [17], [18], [19] and [20]. The combined information from these experiments can be used to provide information on how cross sections of produced states and relative ratios of partial waves depend on center-of-mass energy.
This paper is organized as follows: The experimental overview is presented in Section 2. Event reconstruction and data selection are described in Section 3, where the general features of the distributions in and are also discussed. The details of the PWA formalism and results are given in Section 4. In Section 5 Regge-models are fitted to the results from Section 4. The conclusions are summarized in Section 6.
II Experimental Overview
The E852 apparatus[21] was built around and included the Multi-Particle Spectrometer (MPS) at BNL. The data used for the analysis reported in this paper were collected in 1994 and 1995 using a beam of negatively charged particles of momentum . A 30-cm liquid hydrogen target was surrounded by a cylindrical drift chamber [22] and an array of thallium-doped CsI crystals [23] arranged in a barrel, all located inside the MPS dipole magnet. Drift chambers were used to track charged particles downstream of the target. Two proportional wire chambers (PWC’s), downstream of the target, were used in requiring specific charged particle multiplicities in the event trigger. A 3000-element lead glass detector (LGD) [24] measured the energies and positions of photons in the forward direction. The dimensions of the LGD matched the downstream aperture of the MPS magnet. Photons missing the LGD were detected by the CsI array or by a lead/scintillator sandwich array (DEA) arranged in a picture frame downstream of the target with an aperture to allow for the passage of charged particles.
The first level trigger required that the unscattered or elastically scattered beam not enter an arrangement of two small beam-veto scintillation counters located in front of the LGD. The next level of trigger required that there be no signal in the DEA and no charged particles recorded in the cylindrical drift chamber surrounding the target or in the PWC’s (an all-neutral trigger). In the 1994 run, all layers of the cylindrical drift chamber were used in the trigger requirement, whereas in the 1995 run, only the outer layer was used. A common off-line analysis criterion required no hits in the cylindrical drift chamber. The final trigger requirement was a minimum deposition of electromagnetic energy in the LGD.
The LGD is central to this analysis and it is described in detail in reference [24]. The LGD was initially calibrated by moving each module into a monoenergetic electron beam. Further calibration was performed by adjusting the calibration constant for each module until the width of the and peaks in the effective mass distribution was minimized. The calibration constants were also used for a trigger processor which did a digital calculation of energy deposited in the LGD and the effective mass of photons striking the LGD. A laser-based monitoring system allowed for tracking the gains of individual modules.
Studies were made of various algorithms for finding cluster of energies deposited by photons including issues of photon-to-photon separation and position finding resolution. These are also described in reference [24].
III Event Reconstruction and Data Selection
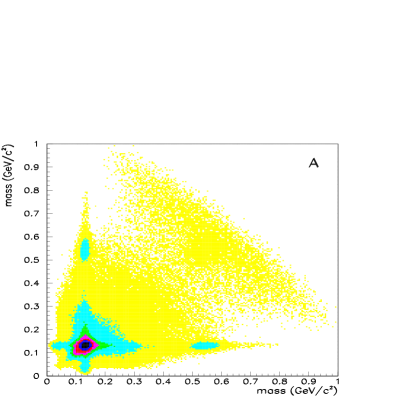
The combined data sets taken in 1994 and 1995 contain approximately 70 million all-neutral triggered events. Of these events, approximately 13 million were found to have four photons in the LGD. The plot of di-photon effective masses for all possible pairings of photons is shown in the scatterplot of figure 1(a) and the projection is shown in figure 1(b). Events consistent with the production of two ’s dominate the scatterplot. The mass resolution is 17 . The sample of 847,460 events was selected from the 13 million four photon events by imposing various analysis criteria. It was required that no charged particles were registered in the MPS drift chambers or the cylindrical drift chamber surrounding the liquid hydrogen target. Any event with a photon within of the center of the beam hole or the outer edge of the LGD was removed. The returned from kinematic fitting to the reaction hypothesis was required to be less than 9.8 (95% C.L. for a three-constraint fit). A further demand was that none of the other final state hypotheses considered (, ) had a better . The final criterion was that the CsI detector registered less than 20 MeV, a cut which eliminated events with low-energy ’s. The mass resolution improves from 24 to 16 at the mass of the after kinematic fitting.
Background studies were also carried out. By selecting events in a given four photon effective mass region and fitting the associated scatter plot of di-photon effective mass pairings (similar to figure 1), the background of non-events under the signal was found to be very small. Typical signal to noise ratios determined by these studies are in the range of 50:1. Monte Carlo studies indicate that combinatoric background from mis-pairing the reconstructed photons is a few percent below and non-existent at higher masses. These studies are described in more detail in reference [25].
The distribution in missing-mass-squared, recoiling against the four photons, for events with a successful kinematic fit to the reaction is shown in figure 2. The missing-mass-squared is determined from photon position and energy information before kinematic fitting and the distribution peaks near the square of the neutron mass. The distribution in effective mass is shown in figure 3. The spectrum is dominated by the resonance and a broad enhancement at low mass (from threshold to about ). There is also a small signal present, despite the requirement that the deposited energy in the CsI detector not exceed . This CsI energy cut reduces a substantial fraction of events but other reactions producing can avoid deposition of energy in the CsI detector. By correlating the observed yields of and mesons, for samples with and without the CsI detector energy cuts, with cross sections for production and associated production () measured in other experiments, we estimate an overall CsI detector inefficiency of . These studies also indicate that the background level of non-neutron events under the is approximately . Another feature of the spectrum is the dip at , which will be seen to be due to the interference of a narrow resonance, the , with a broad enhancement.
The distribution in , shown in figure 3, is not characterized by a single exponential, suggesting more than one production mechanism. The curve is a fit of this distribution to a sum of two exponentials: where and . Based on this structure, we initially examine the effective mass spectra in four bins in as shown in figure 4. The -dependence of the , , and partial waves is later investigated in a set of partial wave fits more finely binned in .
An inspection of figure 4 reveals striking differences in the mass spectra associated with the four bins in . For example, the low-mass structure which dominates in figure 4a is much less prominent in figure 4d. The dip associated with the resonance in figure 4a becomes a bump in figure 4d. These and other features are explored in more detail below in the discussion of the PWA results.
IV Partial Wave Analysis
Partial wave analysis is used to extract production amplitudes (partial waves) from the observed decay angular distributions of the di-pion system. A process such as , dominated by -channel meson exchange, is simplest to analyze in the Gottfried-Jackson reference frame. The Gottfried-Jackson frame is defined as a right-handed coordinate system in the center of mass of the produced di-pion system with the defined by the beam particle momentum and the perpendicular to the plane defined by the beam and recoil neutron momenta. The decay angles () are determined for one of the produced momenta. At fixed beam momentum, an event is fully specified by . The data are binned in and and the production amplitudes, and their relative phases, are extracted from the accumulated angular distributions using an extended maximum likelihood fit to the distributions in (,) [26]. The naming convention for the partial waves is summarized in Table I.
The explicit form of the angular distribution fitted to the data in a given mass and momentum transfer range in this analysis is given by
| (1) | |||||
| (2) |
where are the associated Legendre polynomials [26].
As summarized in Table I, the wave is produced by the exchange of a particle with natural parity (). For production of a system, the dominant natural parity exchange particle is the [27]. The , , and waves are produced by the exchange of a particle with unnatural parity (). Again, for production, the dominant unnatural parity exchange particles are the and the [27].
A Ambiguities
There are multiple discrete sets of partial wave amplitudes which can give rise to exactly the same angular distribution [26]. It can be shown that in a partial wave fit with only and partial waves there are four sets of ambiguous partial wave amplitudes. The four sets can be divided into two groups with different partial wave intensities. Additionally, within each group, there is a sign ambiguity in the phases between the amplitudes.
Normally there are two ambiguities; if one wave in each naturality is fixed a priori, e.g. set real or to some complex value for dynamical reasons, there is still an overall sign ambiguity. However, even this sign ambiguity could be fixed by the requirement, for example, of a resonant behavior in one of the waves.
In general, there is an eightfold ambiguity for a system containing L=0, 2 and 4. However, these ambiguities necessarily entail nonzero and waves. In this paper we have assumed that these are negligibly small and searched for ambiguities with nonzero wave. We find no such ambiguities in our data.
In the analysis of the system, the physical solution can be selected by a combination of physical arguments (which will be given below) and the requirement that solutions be smoothly connected as a function of mass. This selection of the physical solution applies simultaneously to all intensities and phases. In what follows, the physical solution is plotted with solid symbols. The other solutions are plotted with open symbols and are presented for completeness.
B Partial Wave Fits
1 Results for
The results of the partial wave decomposition are shown in figures 5 and 6. The partial wave intensities are shown in figure 5 and the phase differences in figure 6. The phase difference plots are shown above masses of 0.8 . Below that value, where one of the waves is very small, phase difference information is unreliable. As discussed in Section IV A, there is a two-fold ambiguity in the intensities. The threshold behavior (-wave dominance) and the resonant behavior of the are used to select the physical solution. Furthermore, since the resonant structures of both the and partial waves are due to the , the relative phase between the and partial waves should be constant and near radians, according to the phase convention of [26]. These assumptions allow the physical solution at low mass to be connected with the solutions at higher mass. Above approximately , the solutions become degenerate. The spin-4 partial wave is not included in the fit below .
There are a number of key features observed in the physical solution. There is at least one broad enhancement in the -wave intensity and a sharp dip in the -wave intensity near accompanied by rapid phase variation in the relative phase. There also exists a dip in the -wave intensity near accompanied by rapid phase variation in the relative phase. The is observed in the , and partial wave intensities, and the bump observed in the partial wave near 2.0 is consistent with the . Finally, the -wave intensity is larger than the -wave intensity or the -wave intensity, consistent with the expectation that OPE should favor production of an m=0 wave for this low- region.
A background term was not included in the PWA fits presented in this paper. A background term was included in some earlier fits where it was found that below about 1.0 it cannot be distinguished from the dominant wave and above 1.0 , the fit forces the background term to zero.
2 Results for
The results of the partial wave analysis (Figures 7 and 8) in this region are qualitatively similar to the results in the region. The same techniques are used to select the physical solution as in the previous region in . The -wave intensity contains at least one broad object and two dips. The is observed in all -waves. An enhancement near 2.0 is again observed in the partial wave. More detailed comparisons with the results from the region reveal the following differences: The ratio of the -wave intensity to the -wave intensity is smaller at larger and the ratio of the -wave intensity to both the -wave and -wave intensities is smaller at larger . The ratio of the -wave intensity to -wave intensity does not change suggesting that the and the are produced by the same mechanism.
3 Results for
The change in slope for the -distribution as seen in figure 3, indicates a change in production mechanism. This is reflected in the partial wave analysis as well (Figures 9 and 10). For this region, the partial wave is not required for an adequate description of the observed angular distributions and is therefore not included here or in the next higher region. The -wave intensity has a different shape compared to that at smaller values of . The -wave intensity is approximately one-third as large as the -wave intensity whereas at smaller momentum transfer it was approximately one-tenth as large.
4 Results for
The partial wave analysis results in the region (Figures 11 and 12) are significantly different from results at smaller . The bump observed in the mass plot (figure 4d) near is found in the -wave intensity. The partial wave is dominant (as opposed to the partial wave), indicating a shift from unnatural parity exchange processes at small to production via natural parity exchange at large .
5 Fine Bin Fits
The statistics of this experiment are sufficient to allow the region to be analyzed in finer bins, nine in all, for masses up to approximately . The -dependence of the -wave intensity may be summarized by noting that the ratio of the maxima in the intensities at approximately and decreases with increasing , and the ratio of height of maximum intensity at approximately to value of the intensity measured at decreases.
The lineshape of the in the -wave intensity is largely independent of . The relative phase is dependent. The lineshape of the -wave is also independent of . More details of the dependence of the partial waves follow.
The intensities of the individual partial-waves and phase differences as a function of mass for the nine bins in for as well as for the -bins presented in this paper are available on the World Wide Web [28].
C Model Dependent Fits of the - Distributions
The integrals of fitted relativistic Breit-Wigner functions over the peak regions of the and -waves as a function of are shown in Figure 13. The dependences of these intensities on are fitted to functions given by Regge-exchange models. At low-, the unnatural parity exchange partial wave is expected to be dominated by OPE. The Reggeized form for this contribution is given by
| (3) |
In this expression, the factor is due to helicity-flip in the pion-nucleon coupling, and the polynomial dependence on arises from the coupling to at the production vertex. The particular form of this dependence is due to the angular momentum barrier factor proportional to with and being the magnitude of the 3-momentum of the exchanged particle in the rest frame (Gottfried-Jackson frame), given by .
The slope, , in the OPE form is . The systematic uncertainty in the slope of the Regge trajectory is . As shown by Irving and Michael [8] the natural parity exchange -wave is dominated by absorption of the pion exchange and may be parameterized in terms of a Regge cut in the nucleon helicity-flip amplitude
| (4) |
The nucleon-flip and non-flip exchange is then given by,
| (5) |
respectively, with the parameters and , , , and from [8] and , the beam momentum for these data. The -wave intensity is then fitted to
| (6) |
For both forms the fitted functions are averaged over the bins shown in the plots. The plotted curves are calculated from the models without averaging.
In figure 14 the peak value of the -wave intensity near , the value of the -wave intensity at and the peak value of the -wave intensity at approximately as a function of are shown. A one-pion-exchange form similar to Equation 3, but with the factor removed, is overlayed on these distributions. The Regge trajectory slope and exponential slope are fixed to the values found for the -wave fit, and a one parameter fit is used to set the normalization. At small values of the OPE form qualitatively agrees with the data. The excess of events at higher in (b) and (c) is consistent with the existence of additional production mechanisms that are less strongly biased toward small momentum-transfer-squared production than is OPE.
V Conclusions
A partial wave analysis was carried out on a sample of 847,460 events of the reaction collected by experiment E852. The PWA was performed in -wide bins in di-pion mass () and momentum-transfer-squared () from the incident to the outgoing system. Coarse and fine binning in were used. Numerical values for the partial wave intensities and phases as a function of di-pion mass, for coarse and fine bins in , are available on the World Wide Web [28]. The meson is found to be produced by unnatural parity exchange at small values of and natural parity exchange at large values of . The dependences of -wave and -wave intensities are consistent with Regge-exchange models. An enhancement in the wave consistent with the meson is observed in unnatural parity exchange at small momentum transfer. The shape of the -wave intensity has a strong momentum transfer dependence. The presence of dips in the -wave intensity near and , accompanied by rapid phase variations relative to the -wave is consistent with similar observations reported in reference [20] and in centrally produced systems in 450 collisions [29]. The latter claims evidence for the and . At large momentum transfer, the meson is observed as a bump in the -wave intensity. The -wave intensity in the peak near is well-described by OPE. It should also be noted that the model of Anisovich et al [11, 12, 13] predicts the presence of a dip in the distribution for this mass region near [30]. In direct contradiction, no such dip is observed in this analysis. At higher masses the -wave is adequately described by OPE only at small values of .
VI Acknowledgements
We wish to thank the members of the MPS group at BNL as well as the staffs of the AGS, of BNL and of the various colaborating institutions. This work was supported in part by the U. S. Department of Energy, the National Science Foundation and the Russian State Committee for Science and Technology.
REFERENCES
- [1] G. Grayer et al, Nucl. Phys. B75, 189 (1974).
- [2] W. Hoogland et al, Nucl. Phys. B126, 109 (1977).
- [3] P. K. Williams, editor. “ Scattering (1973)”, APS, New York, 1973.
- [4] P. Estabrooks and A. D. Martin, Nucl. Phys. B79 301 (1974).
- [5] P. Estabrooks and A. D. Martin, Nucl. Phys. B95, 322 (1975).
- [6] M. Harada et al, Phys. Rev. D54(3), 1991 (1996).
- [7] R. Kaminski, L. Lesniak, K. Rybicki, Z. Phys. C 74, 79 (1997).
- [8] A. C. Irving and C. Michel, Nucl. Phys. B82, 282 (1974).
- [9] S. Godfrey and J. Napolitano, Rev. Mod. Phys. 71 (1999).
- [10] P. Minkowski and W. Ochs, Eur. Phys. J. C9, 283 (1999). This paper includes earlier data from experiment E852 which are superseded by the data presented in this paper.
- [11] V. V. Anisovich, Yu. Prokoshkin, A. Sarantsev, Phys. Lett. 389B, 388 (1996).
- [12] V. V. Anisovich et al, LANL preprint hep-ph/9711319 (1997).
- [13] A. V. Anisovich, V. V. Anisovich, A. V. Sarantsev, Phys. Lett. 395B, 123 (1997); Z. Physik A359, 173 (1997).
- [14] K. L. Au, D. Morgan and M. R. Pennington, Phys. Rev. D35, 1633 (1987).
- [15] M. R. Pennington, LANL preprint hep-ph/9905241 (1999).
- [16] E. van Beveren and G. Rupp, LANL preprint hep-ph/9912332 (1999).
- [17] S. Fukui et al, Phys. Lett. B202, 441 (1988).
- [18] W. D. Apel et al, Nucl. Phys. B201, 197 (1982).
- [19] D. Alde et al, Z. Phys. C 66, 375 (1995).
- [20] D. Alde et al, Eur. Phys. J. A3 361 (1998).
- [21] S. Teige et al, Phys. Rev. D59, 1 (1999).
- [22] Z. Bar-Yam et al, Nucl. Instrum. Meth. A386, 235 (1997).
- [23] T. Adams et al, Nucl. Instrum. Meth. A368, 617 (1996).
- [24] R. R. Crittenden et al, Nucl. Instrum. Meth. A387, 377 (1997).
- [25] J. Gunter, Ph.D. thesis, Indiana University, 1997.
- [26] S. U. Chung, Phys. Rev. D 56, 7299 (1997).
- [27] A. C. Irving and R. P. Worden, Phys. Rep. 34(3), 117 (1977).
- [28] The results of PWA fits presented in this paper, partial wave intensities and phases as a function of mass, for various bins in are located here: http://dustbunny.physics.indiana.edu/pi0pi0pwa/.
- [29] D. Barberis et al, Phys. Lett. B453 325 (1999).
- [30] N. N. Achasov and G. N. Shestakov, Phys. Rev. D58, 54011 (1998).
 |
 |

 |
 |
 |
 |
 |
 |
 |
 |
 |
 |
 |
 |
 |
 |
 |
 |
 |
 |
 |
 |
 |
 |
 |
 |
 |
|
 |
 |
 |
 |
 |
 |
 |
|
 |
 |
 |
 |
 |
 |
 |
 |
 |
 |
 |
| Partial wave | L | Naturality of the exchange particle | |
|---|---|---|---|
| 0 | 0 | unnatural | |
| 2 | 0 | unnatural | |
| 2 | 1 | unnatural | |
| 4 | 0 | unnatural | |
| 2 | 1 | natural |