Benefits of joint LIGO – Virgo coincidence searches for burst and inspiral signals
Abstract
We examine the benefits of performing a joint LIGO–Virgo search for transient signals. We do this by adding burst and inspiral signals to 24 hours of simulated detector data. We find significant advantages to performing a joint coincidence analysis, above either a LIGO only or Virgo only search. These include an increased detection efficiency, at a fixed false alarm rate, to both burst and inspiral events and an ability to reconstruct the sky location of a signal.
1 Introduction
The first generation of gravitational wave interferometric detectors are approaching their design sensitivities [1, 2, 3, 4]. Once fully commissioned, they will provide unprecedented sensitivity to gravitational waves in the frequency range between and Hz. The goal of these interferometers is to make the first direct detection of gravitational wave signals. It has long been acknowledged that the chances of detection are increased by making optimal use of data from all available detectors. However, there are many issues to be addressed before this is possible. First, we must resolve various technical issues associated with analyzing data from several detectors with different sensitivities, hardware configurations and sampling rates. This has been addressed in joint searches of LIGO–TAMA coincident data [5, 6], and previous comparisons of the LIGO and Virgo burst and inspiral search pipelines [7, 8]. In addition, we must understand how to ‘optimally’ combine the data and results from several different detectors. In this paper, we perform a study using simulated data to compare different strategies of combining results from searches of LIGO and Virgo data.
There are numerous advantages to performing a joint search. First, by requiring a signal to be observed in several detectors in coincidence we can work at a far lower false alarm rate than is practical using a single detector. Futhermore, if we make use of several detectors, it is possible to recover the sky location and polarization of the signal. We can increase the amount of data available for analysis by performing a search whenever at least two detectors (in a network of three or more) are operational. Also, due to the different alignments of the detectors, their sensitivity to different parts of the sky varies. Thus, by requiring a signal to be observed in a subset of the detectors, we can improve our sky coverage. Finally, a signal seen in several widely separated detectors making use of different hardware and analysis algorithms decreases the chance of it being due to any systematic error or bias. As is apparent from above, some of the possible benefits of a multi-detector search are mutually exclusive. If we require a coincidence in all available detectors, we will have the lowest possible false alarm rate, but at the same time we will actually decrease our sensitivity as any signal which is poorly aligned for one of the detectors will be missed in coincidence. Some of the advantages listed above arise from using the ‘and’ of all available detectors, while others come from the ‘or’ combination. Obviously, we must find a balance between these two competing regimes.
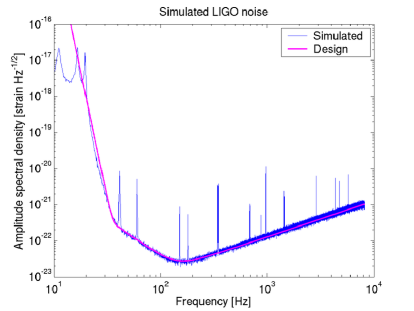
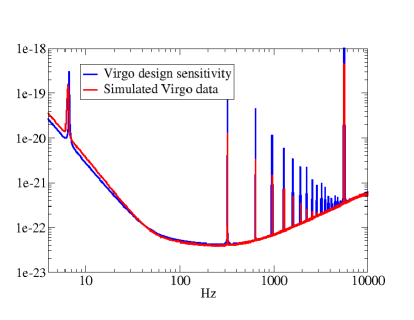
In this paper, we address the question of how to best combine the available data from the LIGO and Virgo interferometers. We explore this using 24 hours of simulated data for three detectors: the Virgo detector (V1) and the two 4 km LIGO detectors, one at Livingtson (L1) and the other at Hanford (H1). The noise spectra and design sensitivities of the LIGO and Virgo detectors are shown in Figures 2 and 2 respectively. Into these data, we inject gravitational wave signals from a variety of burst and inspiral signals and compare different ‘and’/‘or’ combinations of searches of the three detectors.
In the discussion above, and throughout the paper, we focus only on a coincidence analysis. More specifically, data from each of the detectors is analyzed independently for candidate events. Subsequently, the candidates from each of the single detectors are searched for coincidences in time (and possibly other parameters). There are other approaches which involve a coherent combination of the interferometers’ data streams. These coherent analyses tend to be computationally costly, and consequently their use may well be restricted to follow-up analyses of candidates found in an event-based coincidence search. The implementation and testing of coherent search algorithms is a current research priority, and will be addressed in future publications.
2 Burst
Burst search algorithms are designed to identify short duration, unmodelled gravitational wave burst signals in the detector’s data stream. There are many different methods of searching for such unmodelled bursts in the data. Several of these have been independently implemented by the LIGO and Virgo collaborations, and a first comparison of the various methods was made in [7]. In this paper, we will extend that work by examining various methods of combining results from independent burst searches on the data from the three detectors H1, L1 and V1. In particular, we will focus on the benefits of a multi-detector and multi-site coincidence search, including the ability to reconstruct the sky location of a signal observed in all three detectors.
2.1 Injections
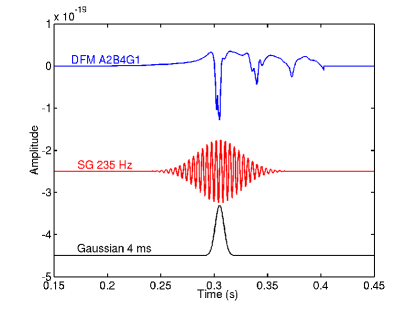
In order to test the efficiency of various search methods, as well as the benefits of a coincidence analysis, it is necessary to add burst signals to the simulated data streams of the detectors. In this study, we inject six different burst signals into the data. These consist of two Sine Gaussian signals, one at a frequency of 235 Hz and , the second with a frequency of 820 Hz and ; two Gaussian signals with widths of 1 and 4 milliseconds; and two supernova core collapse waveforms, A1B2G1 and A2B4G1, from the catalog of Dimmelmeier, Font and Mueller [9]. The waveform families are illustrated in Figure 3. By using a broad set of waveforms for injection, we hope to obtain a coarse coverage of the space of possible astrophysical waveforms.
We perform burst injections from the direction of the galactic center. The injections are linearly polarized with uniformly distributed polarization angle. We must also specify the amplitude of the waveforms. However, these burst waveforms, with the exception of the supernova core collapse simulation, cannot be normalized to a specific astrophysical distance. Instead, we choose a normalization for each waveform derived from the detectors’ sensitivities. The response of an interferometric detector to a gravitational wave depends upon the sky location and polarization of the signal. Thus, signals from the galactic center with the same intrinsic magnitude will appear in the data stream of the detector with different amplitudes, which are dependent on polarization and (time dependent) sky location of the source. We fix the intrinsic amplitude of each waveform by requiring that there is exactly one injection during the 24 hour data sample with a signal to noise ratio (SNR) of 10 or greater in all three detectors. For the supernova core collapse sources, this normalization corresponds to distances of 4.8 kpc and 3.6 kpc for the A1B2G1 and A2B4G1 simulations respectively.
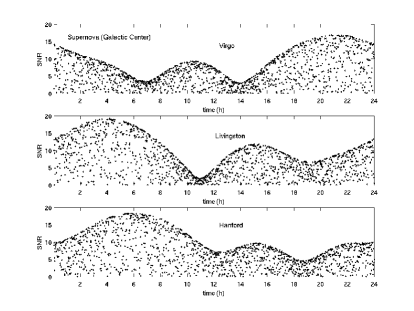
The signal to noise ratio of the injections in each of the three detectors is shown in Figure 4. The detectors’ varying sensitivity to galactocentric sources over the course of the day modulates the SNR of the simulated singals. The LIGO detectors at Livingston and Hanford were designed to have similar orientations, although they cannot be identical since the detectors are separated by 3000 km. Their similar orientations give similar directional responses to gravitational radiation. Consequently, the SNR distributions of the injections in H1 and L1 over the course of the day are similar, but by no means identical. In particular, both detectors suffer a decrease in sensitivity to sources from the galactic center at around 11 and 19 hours. The sensitivity of the Virgo detector to signals from the galactic center is very different from the LIGO detectors. For example, it has a peak in sensitivity at 11 hours when the LIGO detectors are less sensitive.
2.2 Single interferometer analysis
Broadly speaking, burst search algorithms can be characterized as time domain searches, time/frequency domain searches or correlators. In this comparison, we use seven different search algorithms distributed between these three classes. We use two time domain methods, the Mean Filter (MF) and Alternative Linear Filter (ALF). These identify times at which the character of the detector data changes. The time-frequency methods, PowerFilter and Q-transform, identify areas in the time-frequency plane with excess power. Finally, correlators match filter the data using a specific family of waveforms. The Peak Correlator (PC) uses gaussian templates, the Exponential Gaussian Correlator (EGC) uses sine gaussians, and the Frequency Domain Adaptive Wiener Filter (FDAWF) algorithm uses Gaussian, zero phase templates. Details of these methods and additional references are given in Ref. [7].
We use all of the methods described above to search for the six different sets of injected waveforms described in Section 2.1. For each algorithm and each waveform, we calculate the detection efficiency, which is the percentage of injected signals successfully detected. To make the results comparable, all searches are performed with a fixed single-detector false alarm threshold of 0.1 Hz. The results from the different injected waveforms are comparable, although different search algorithms are better suited to detecting, and consequently are more sensitive to, different injected waveforms. A full comparison of the results from different search algorithms and injected waveforms will be presented in a future publication [10]. To simplify the presentation in this paper we will restrict our attention to one waveform, the supernova core collapse waveform A2B4G1. For the injected population shown in Figure 4, the search efficiencies for the three detectors are given in Table 1. In the table, we give the maximum efficiency obtained by one of the algorithms, as well as the average of all the search algorithms used. The best efficiency for the three detectors is similar, at around 60%. Additionally, the average efficiency is only a few percent lower than the best, showing that the performance difference between various search algorithms is not too significant.
| H1 | L1 | V1 | |
|---|---|---|---|
| max efficiency | 63% | 60% | 55% |
| mean efficiency | 59% | 56% | 49% |
2.3 Multi-interferometer analysis
A true gravitational wave event will produce a signal in all detectors, the amplitude of which will depend upon the location and polarization of the source relative to the detector. Furthermore, the time at which the signal occurs in different detectors must differ by less than the light travel time between the sites. In contrast, false alarms caused by noise will typically not occur simultaneously in several detectors. By requiring time coincidence between several sites, we should be able to greatly reduce the number of false alarms. However, we will also lose some gravitational wave signals which are poorly aligned, and consequently not detectable above the noise, in one or more of the detectors. The challenge is then to obtain the best possible efficiency at a given false alarm rate. There are two obvious coincidence options — to require a coincident signal in all three detectors, or to require coincidence in only two of them. Here, we will examine which of these gives the better efficiency.
First, we can examine triple coincidences — events which are seen in all three of the Hanford, Livingston and Virgo detectors. The single interferometer false alarm rates and time coincidence windows lead to a triple coincidence false alarm rate of around . At this false alarm rate, the efficiency of the best performing algorithm is 19% while the average is 12%. At first sight, the triple coincidence efficiency seems lower than expected. However, consulting Figure 4 it is clear that there are significant amounts of time when one of the three detectors is poorly aligned for events from the galactic center and hence fairly insensitive to them. So, there will be many events detected in two of the three detectors which are not detected in the third. This argues that we should also look at the two detector results. In order for this to be a fair comparison, we perform a double coincident analysis for each pair of detectors, with the same false alarm rate of . The results are summarized in Table 2.
| HLV | HL | HV | LV | HL HV LV | |
|---|---|---|---|---|---|
| max efficiency | 19% | 41% | 22% | 22% | 60% |
| mean efficiency | 12% | 31% | 13% | 15% | 41% |
The two detector efficiencies are higher than the triple coincidence efficiency, at the chosen false alarm rate. Additionally, the efficiency of the two LIGO detectors is higher than for one LIGO detector with Virgo. This is not surprising given the similar orientations of the LIGO detectors. Alternatively, we can combine the two detector results to obtain an efficiency of 60% for a search which requires an event to be detected in at least two of the three detectors. Note that the false alarm rate of this search may be somewhat higher than the others ( as compared to ). However, we expect that reducing the false alarm rate to would have little to no effect on the efficiency. From this preliminary study, we conclude that the best efficiency can be obtained by requiring an event to be observed in two of the three detectors. This gives us a 60% efficiency to the injected population, in comparison to 41% for the best combination of two detectors (H1-L1) and a 19% triple coincidence detection efficiency. Thus, for this population, a search using a network consisting of Virgo and the LIGO detectors yields a 50% greater efficiency than a LIGO only search.
Finally, it should be noted that the coincidence analysis described above is only the first step towards a network analysis. The optimal network analysis would involve a coherent analysis of the data from all detectors. The application of various coherent methods to this simulated data set, as well as a more detailed description of the coincidence analysis will be presented in a future paper [10].
2.4 Directional Reconstruction
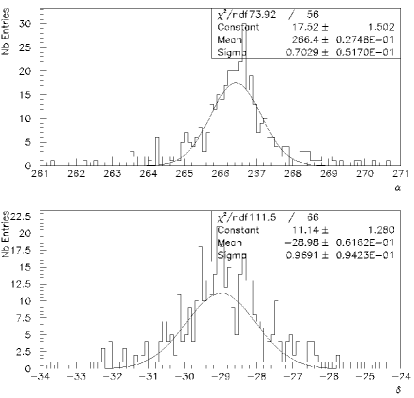
When an event is observed in three detectors, we can determine the sky location using the timing information alone.111Timing information alone actually gives two sky positions. The second location is the reflection of the true location in the plane formed by the three detectors. Here, we simply use the location closest to the injected sky position. The accuracy with which we can determine the sky location is dependent upon the resolution with which the arrival time of the signal can be determined. The arrival time of the signal is defined as the time of the maximal amplitude. For the 1ms Gaussian signals, analyzed with the Peak Correlator, the arrival time can be determined to within 0.3 ms on average (the time accuracy obtained by the Peak Correlator on Gaussian signals can be parametrized as: ). Taking into account the observed SNR and corresponding timing accuracy at each of the sites, we use a minimization technique to determine the sky location [11]. In Figure 5 we show the accuracy with which the sky location can be reconstructed for a 1ms Gaussian signal using the Peak Correlator. The sky location is determined quite accurately — the average reconstructed value agrees with the injected value and there is a one degree standard deviation in both right ascension and declination . For other waveforms, particularly if they are not linearly polarized, our ability to determine the arrival time and hence reconstruct the sky location may vary considerably.
3 Inspiral
Gravitational waves from inspiralling binaries of neutron stars and/or black holes are one of the most promising sources for the LIGO and Virgo detectors. Both the LIGO and Virgo collaborations have implemented inspiral search pipelines, and a first comparison was made in [8]. In this section, as with the previous discussion of burst searches, we will focus on the benefits of a multi-detector and multi-site coincidence analysis. We begin with a description of the inspiral waveforms used in this analysis. Following a brief discussion of the single instrument results, we move on to describe the coincidence analysis and directional reconstruction. In this study, we restrict attention to binary neutron star signals.
3.1 Injections
We can summarize the sensitivity of a detector to inspiral signals from binary neutron star systems with a single number: the observable effective distance, or range. This is defined as the distance at which an inspiral of neutron stars, in the optimal direction and orientation with respect to each detector would produce a signal to noise ratio of 8. The effective distance of a signal is always greater than or equal to the actual distance and on average is about 2.3 times as large as the actual distance. The ratio of effective to actual distance depends upon the location of the source relative to the detector, as well as the orientation (polarization and inclination) of the source.
At design sensitivity the inspiral ranges of the initial LIGO and Virgo detectors are between 30 and 35 Mpc. Consequently, the Virgo cluster, at a distance of 16 Mpc, provides the largest concentration of galaxies containing potential inspiral signals for the first generation of gravitational wave interferometers. In order to examine the benefits of a joint network analysis, we inject inspiral signals from the the M87 galaxy in the Virgo cluster. In addition, we add simulated signals from a somewhat closer galaxy, namely NGC 6744 at 10 Mpc. We inject a total of 144 simulated events into the 24 hours of simulated data, with approximately half of the events coming from each galaxy. During the course of the 24 hours of data, the location of the galaxies relative to the detectors changes, thus allowing us to sample times when various detectors are more and less sensitive to sources from these galaxies. The component masses of the neutron stars in the binary are taken to be between and . Furthermore, the inclincation, polarization and coalescence phases are uniformly distributed among their allowed values.
3.2 Single interferometer analysis
Both the LIGO and Virgo collaborations have implemented inspiral search pipelines. The LIGO pipeline has been used to search for binary inspirals in the data taken during the first two LIGO science runs. Details of the analysis pipeline and searches performed are available in Refs. [12, 13]. The Virgo collaboration has implemented two independent inspiral pipelines. The first is a standard flat search pipeline, “Merlino” [14], while the second is a multiband templated analysis (MBTA). In the multiband approach, the templates are split for efficiency into high and low frequency parts during the search [15]. In [8] we performed a first comparison of the LIGO and MBTA pipelines.
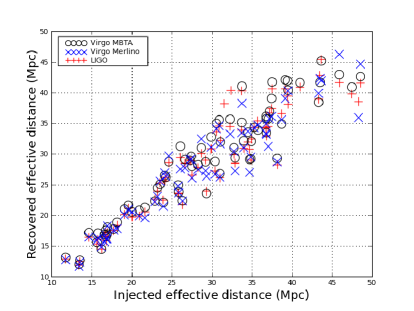
The three pipelines were used to analyze the simulated data from all three detectors. Since all the pipelines perform a matched filtering for a specific waveform, we expect to obtain comparable results from all the pipelines. To verify this, we analyze the 24 hours of simulated data plus injections with each of the three pipelines. To make the results directly comparable we use identical template bank generation parameters and a signal to noise ratio threshold of for all searches. As an example, we look at the recovered effective distance of the simulated events. In Figure 6 we show the injected and recovered effective distances for the three pipelines. The effective distance is well recovered by all pipelines. Indeed, for more distant events, the difference between the values recovered by the three pipelines is often less than the difference between the injected and recovered distances. This is because, at low signal to noise ratio, the noise can have a significant effect on the recovered effective distance. However, as all pipelines filter the same injections and the same noise, we still expect good agreement between pipelines. A more complete comparison of the three pipelines will be presented in [16].
For the inspiral search, we also examine the benefits of a network search. To simplify the presentation, we restrict to one pipeline, namely the MBTA, for the remainder of this paper. Since the results obtained by the three pipelines are similar, our conclusions will not be dependent on the pipeline used. The MBTA single detector efficiencies to the injected signals from the two source galaxies are given in Table 3. The single instrument false alarm rates at an SNR threshold of 6 are around . The efficiency of each of the three detectors is comparable for both galaxies. As expected, the efficiency to injections from NGC 6744 is larger as that galaxy is closer than M87. With the small number of injections performed in this study, the diffferences between interferometers’ efficiencies are not significant.
| H1 | L1 | V1 | |
|---|---|---|---|
| NGC 6744 efficiency | 72% | 69% | 68% |
| M87 efficiency | 52% | 57% | 47% |
3.3 Multi interferometer analysis
The inspiral pipelines can accurately recover several parameters of the injected waveforms, most notably the mass parameters, coalescence time and effective distance (as shown in Fig. 6). Since the effective distance can differ between detectors due to their different orientations, we cannot use it when testing for coincidence. We do require consistency of the coalescence time and mass between signals in the detectors. As with the burst search, this greatly reduces the coincident false alarm rate. However, due to the coincidence test on mass, as well as time, it is difficult to estimate the false alarm rate. In the 24 hours of data searched, we find no triple coincident, and only one double coincident, false alarm.
Next, we examine which combination of detectors gives the best detection efficiency for our given injected population. As with the burst search, we consider the triple coincident search and various two detector coincident searches. The results are given in Table 4. We use an SNR threshold of 6 in all instruments. This leads to the triple coincident search having a substantially lower false alarm rate than the two detector searches.
| HLV | HL | HV | LV | HL HV LV | |
|---|---|---|---|---|---|
| NGC 6744 efficiency | 48% | 65% | 54% | 49% | 72% |
| M87 efficiency | 24% | 42% | 32% | 30% | 56% |
The coincidence results clearly show the benefits of performing a search including all three detectors. The highest efficieny is obtained by requiring a signal to be observed in any two of the three detectors. For the closer NGC 6744 galaxy, the main advantage of adding the Virgo detector to a LIGO only search is the good triple coincident efficiency. Not only is the triple coincident false alarm rate very low, but also with a trigger in three detectors we can reconstruct the sky location of the source.
For signals from M87, the two detector LIGO efficiency is greater than either the H1-V1 or L1-V1 efficiency. This is expected due to the similar orientations of the two LIGO detectors. However, by including Virgo and requiring a coincident trigger in two of the three detectors, we do obtain a 25% increase in efficiency. The M87 galaxy is in the Virgo cluster, which contains a significant fraction of potential binary neutron star inspiral sources for the initial interferometric detectors. A 25% increase in efficiency to these sources significantly increases the chance of making a detection.
3.4 Directional Reconstruction
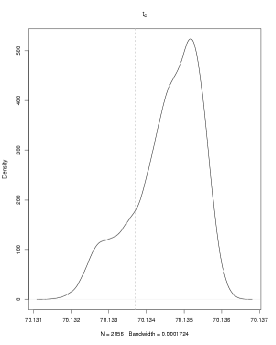
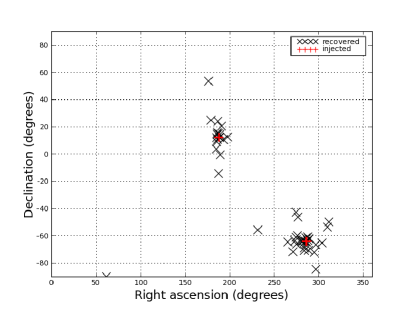
In an inspiral search, the waveform can be parametrized by several variables, among them the coalescence time, location, orientation and mass parameters of the binary system. It is well known that the reconstructed values of these parameters are not independent. For example, a higher mass binary inspiral will traverse the sensitive band of the detectors more rapidly than one of lower mass. Thus, the reconstructed coalescence time and masses of the system will be correlated. These correlations make it difficult to determine the coalescence time with good accuracy. To illustrate this, we use a Markov Chain Monte Carlo analysis [17] to obtain the posterior probability distribution of the various parameters. In Figure 7 we show the distribution of the coalescence time for one of the injections. The width of this distribution is ms. Due to the uncertainty in the coalescence time of the signal we obtain a similar uncertainty in the reconstructed sky location. Figure 8 shows the accuracy with which we can determine the sky location based on our coincidence search. Using this coincidence search, we cannot reconstruct the sky location with sufficient accuracy to determine the galaxy containing the binary.
The coincidence search described above is only the first stage of a network analysis. The complete analysis would involve a coherent search as a follow-up on any interesting candidates obtained from the coincidence stage [18]. In a coherent search, the data from each detector is match filtered against a template with identical mass parameters. By using the same template to filter all the data, the directional reconstruction can be separated from uncertainties in the template mass parameters. Therefore, it is likely that this coherent step would improve our ability to recover the sky location of sources. Details of the coherent search will be included in a future publication [16].
4 Discussion
We have analyzed 24 hours of simulated data for the H1, L1 and V1 detectors. By adding simulated burst and inspiral signals, we have examined the benefits of performing a joint LIGO–Virgo coincidence search for these sources. We find two benefits of a LIGO–Virgo joint search over a LIGO only or Virgo only search. First, use of three detectors substantially increases the efficiency to burst and inspiral signals, at a fixed false alarm rate. This increase is best realized by requiring a signal to be observed in at least two of the three detectors. In addition, we can reconstruct the sky location of those signals which are observed in all three detectors. The accuracy with which the direction can be determined is dependent upon the timing accuracy of the search, with a 0.3 ms timing error leading to approximately a uncertainty in the sky location. The results presented here show that there is significant benefit to performing a joint coincidence search of LIGO and Virgo data.
Acknowledgments
LIGO Laboratory and the LIGO Scientific Collaboration gratefully aknowledge the support of the United States National Science Foundation for the construction and operation of the LIGO Laboratory and for the support of this research.
References
References
-
[1]
B. Abbott et al. (The LIGO Scientific Collaboration),
Nucl. Instrum. methods Phys. Res. A 517, 154 (2004).
- [2] F. Acernese et al. (The Virgo Collaboration), Class. Quantum Grav. 21, S385 (2004).
- [3] B. Willke et al., Class. Quantum Grav. 21, S417 (2004).
- [4] R. Takahashi and the TAMA Collaboration, Class. Quantum Grav. 21, S403 (2004), M. Ando et al., Phys. Lett., 86, 3950 (2001).
- [5] B. Abbott et. al. (the LIGO Scientific Collaboration) and T. Akutsu et. al. (the TAMA Collaboration), ”Upper limits from the LIGO and TAMA detectors on the rate of gravitational-wave bursts,” arXiv:gr-qc/0507081.
- [6] S. Fairhurst and H. Takahashi (for the LIGO Scientific Collaboration and the TAMA Collaboration), Class. Quantum Grav. 22 S1109-S1118 (2005).
- [7] F. Beauville et al. (Joint LIGO/Virgo working group), Class. Quantum Grav. 22 S1293-S1302.
- [8] F. Beauville et al. (Joint LIGO/Virgo working group), Class. Quantum Grav. 22 S1149-S1158 (2005).
- [9] H. Dimmelmeier, J.A. Font, E. Mueller, Astron. Astrophys. 393, 523-542 (2002)
- [10] Joint LIGO/Virgo working group, “Strategy for performing an optimal joint LIGO–Virgo burst analysis”, in preparation.
- [11] F. Cavalier et al. paper in preparation.
- [12] B. Abbott et al., (The LIGO Scientific Collaboration), Phys. Rev. D 69, 122001 (2004) .
- [13] B. Abbott et al., (The LIGO Scientific Collaboration), “Search for gravitational waves from galactic and extra–galactic binary neutron stars”, gr-qc/0505041.
- [14] P. Amico, L. Bosi, C. Cattuto, L. Gammaitoni, F. Marchesoni, M. Punturo, F. Travasso, H. Vocca, Comp. Phys. Comm. 153, 179 (2003).
- [15] F. Marion et al., (The Virgo Collaboration), Proceedings of the Rencontres de Moriond 2003, Gravitational Waves and Experimental Gravity (2004).
- [16] Joint LIGO/Virgo working group, “Strategy for performing an optimal joint LIGO–Virgo inspiral analysis”, in preparation.
- [17] N. Christensen, A. Libson, and R. Meyer, Class. Quantum Grav. 21 317-330 (2004).
- [18] A. Pai, S. Dhurandhar, and S. Bose Phys. Rev. D 64, 042004 (2001)