A first comparison of search methods for gravitational wave bursts using LIGO and Virgo simulated data
Abstract
We present a comparative study of 6 search methods for gravitational wave bursts using simulated LIGO and Virgo noise data. The data’s spectra were chosen to follow the design sensitivity of the two 4km LIGO interferometers and the 3km Virgo interferometer. The searches were applied on replicas of the data sets to which 8 different signals were injected. Three figures of merit were employed in this analysis: (a) Receiver Operator Characteristic curves, (b) necessary signal to noise ratios for the searches to achieve 50 and 90 efficiencies, and (c) variance and bias for the estimation of the arrival time of a gravitational wave burst.
pacs:
04.80.Nn, 07.05.Kf, 02.70.Hm, 95.55.Ym1 Introduction
Progress in the commissioning of the LIGO and Virgo detectors make possible in the near future the opportunity of a joint network analysis. To prepare the ground, gain a better understanding of each other’s analysis and develop common procedures, the LIGO Scientific Collaboration and the Virgo experiment have agreed to pursue a joint search for burst and binary inspiral signals on simulated data [1]. This paper describes the application of burst search algorithms on simulated data to which several classes of candidate signals waveforms were injected. This framework provides the opportunity to (a) compare the performance of time domain and frequency domain methods (b) obtain a detector-independent measure of a method performance (c) test the limit of design sensitivity and (d) study separately the properties of the trigger generation from those of temporal coincidence modules between different interferometers.
Three hours of simulated data have been generated with a spectrum following the target design sensitivity of both the 4km LIGO interferometers, whose sampling frequency = 16384 Hz, and 3km Virgo interferometer, with = Hz (see the inspiral proceedings in this issue for more details [8]).
Three families of signals have been generated and injected onto the simulated noise with a mean Poisson rate equal to one every 60 seconds. Sine Gaussian (SG) and Gaussian (GA) signals were chosen to represent the two general classes of short-lived gravitational wave bursts of narrow-band and broad-band character respectively. SG were chosen with central frequencies = Hz, to probe the best sensitivity region of the spectrum, and 820 Hz, to probe the higher frequency regime. Both of them were tested for quality factors = and 15. GA signals were chosen with duration equal to 1 and 4 milliseconds. Dimmelmeier-Font-Mueller (DFM) supernovae core collapse signals [9] with parameters = = = and = = = were adopted as a more realistic model for gravitational wave bursts. DFM signals also allowed to probe the searches on waveforms with non-minimal time-frequency volume.
The amount of energy in the signal was quantified in terms of the signal to noise ratio () typically used to characterize the performance of a an optimal filter
| (1) |
where is the spectrum of the injected waveform and is the noise power spectral density. The range of tested spanned between 2 and 10 because it roughly corresponds to the transition between not detecting any of the injected signals to detecting all of them for most of the searches involved.
The methods considered can be divided into searches for excess power in the time frequency domain:
-
•
Q-transform (QT)[2], a multiresolution time frequency search for excess power applied on data that are first whitened using a zero phase linear prediction. Equivalent to optimal matched filter for minimum uncertainty waveforms of unknown phase in the whitened data
-
•
S-transform (ST)[3], a search for statistically significant clusters of power in the time frequency map generated using a kernel composed of complex exponentials shaped by Gaussian profiles with width inversely proportional to frequency. The ST first whitened the data and also applied on Virgo data a high pass filter and a line removal.
-
•
Power Filter (PF)[4], a search on whitened data for excess power over different time intervals and set of frequencies
and time domain searches:
-
•
Peak Correlator (PC)[5], a search for peaks of Wiener filtered data with Gaussian templates. PC applies on Virgo data a high pass filter and a line removal filter.
-
•
Mean Filter (MF)[6], search for excess power in moving averages of whitened data over intervals containing from 10 to 200 samples. The MF whitens the data and applies to Virgo data a high pass filter and a line removal.
-
•
Adaptive Linear Filter ALF [7], search for change in slope over moving windows of data over intervals containing from 10 to 300 samples. ALF applies the same whitening high pass filtering and line removal as MF.
The performance of the searches have been investigated by computing (a) the Receiver Operator Characteristic curves (ROCs) for each method, injected waveform, interferometer and (b) computing the necessary for a search to reach an efficiency equal to 50 and 90 for a representative value of the False Alarm Rate (FAR) and (c) assessing the accuracy in the estimate of the arrival peak time of a signal.
In section 2 we describe the analysis pipeline. In section 3 we discuss a selection of the figures of merit generated to compare the searches. In section 4 we summarize the findings of this project and address future directions of the investigation.
2 Analysis Pipeline
Calibrated strain data corresponding to noise and signal from both instruments were made available in the frame format to both the collaborations. Each method has then been applied to noise plus signals for FARs in the range between Hz, which corresponds to roughly one false trigger in three hours, and 0.1Hz, which allowed to have more noise triggers and study the statistical distribution of durations and temporal separation of the triggers. The performance of the searches at higher single interferometer FARs is also relevant for network studies where consistency criteria (for example on the time of arrival and amplitude) can be applied on the triggers giving a lower FAR for consistent events.
Each method computed a start time, a peak time and an end time for each of the events, as well as the efficiencies
in the chosen range of FARs. The searches adopted different procedures to associate triggers with injections and
therefore compute the efficiencies. However methods that use matching windows to identify detected injections with
triggres can freely choose the size of the matching window provided that it is (I) larger than the search time
resolution and (II) the products of the matching window for the false alarm rate and the injection rate are both much
smaller than one. In this analysis: (a) the PF associated to each injected waveform a time interval starting
at the first non zero sample and finishing at the last non zero sample. A detection was claimed when the trigger
interval, as computed by the PF, overlapped with the event interval. (b) For the QT, the interval internally
associated to a trigger needed to overlap with a 0.2 seconds interval centered at the the injection peak time.
(c) For MF, ALF, PC and S the time associated with a trigger needed to be closer to the peak time of the injection
than 20 ms for ALF, MF and S, 50 ms for PC.
As we will see in section 3, were we discuss the accuracy of the peak time estimation, the constraint (I) was respected.
The constraint (II) was also respected. Infact the largest FAR that we study is 0.1Hz
and the largest coincidence window is 0.05 seconds while the injection rate is 1/60 Hz.
This makes the two products of point (II) both smaller than at least 0.01.
3 Data Analysis
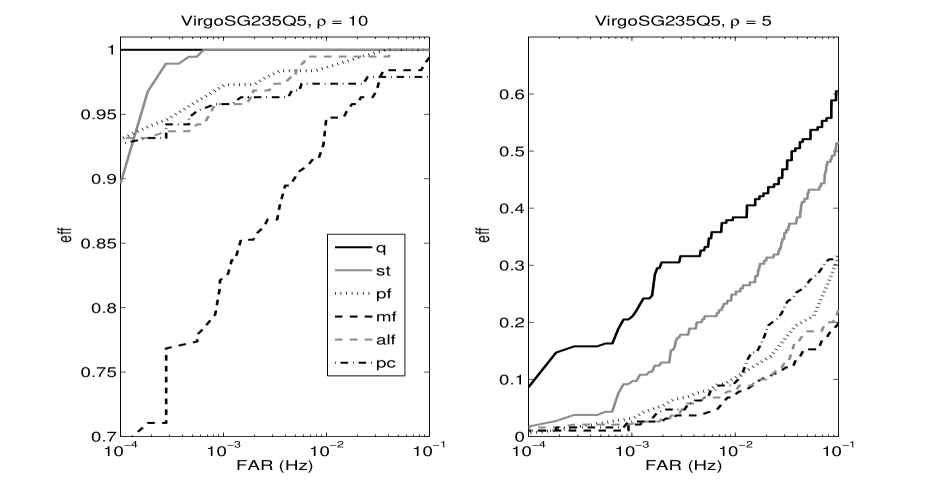
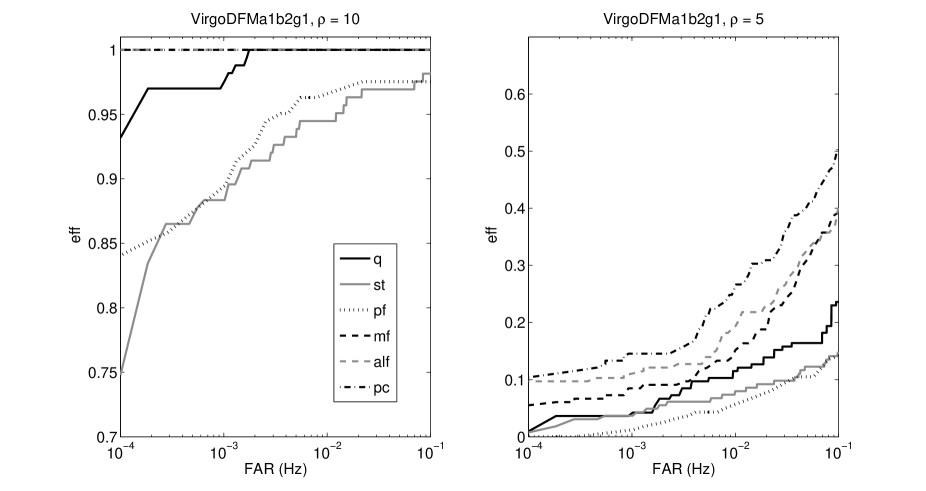
A key element in comparing search methods are ROCs because they allow one to confront the efficiencies in a range of FARs of interest. For example in a single-interferometer experiment the FAR could be chosen by the request of having only less than one noise event over the whole acquisition time. More generally, the largest tolerable single interferometer FAR will depend on the observation time, number of interferometers and consistency requirements between triggers generated from the data belonging to different interferometers. In this perspective as informative figures of merit we first present examples of ROC curves and the necessary to reach 50 and 90 detection efficiencies for FAR = 0.01Hz. Of all the possible parameters on which consistency constraints can be applied, in this study we focused on the trigger peak time, which should be compatible with the travel time between interferometers and the methods errors in the peak time estimation. In the summary tables 1 to 4 some results corresponding to the PC and ST running on SG are not available. They reflect waveforms where the efficiency of the PC was not expected to be significant or the ST had not completed their analysis. We plan to include these results in future publications.
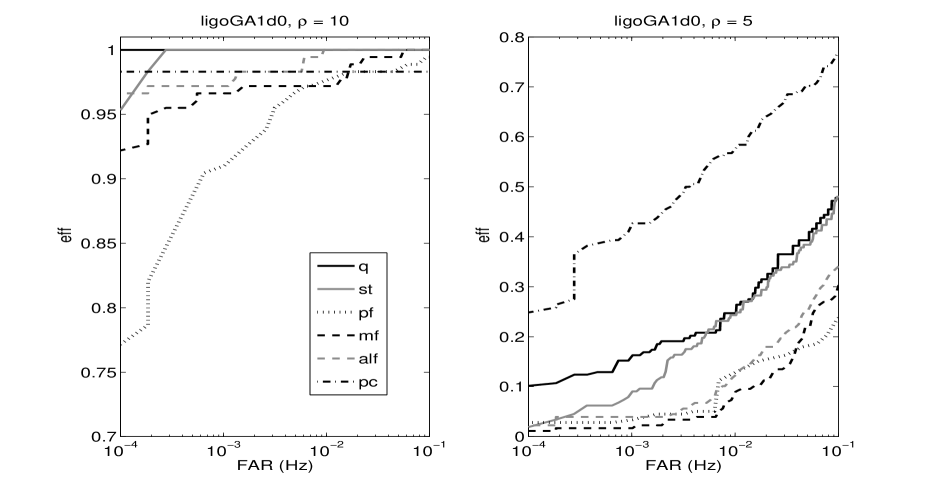
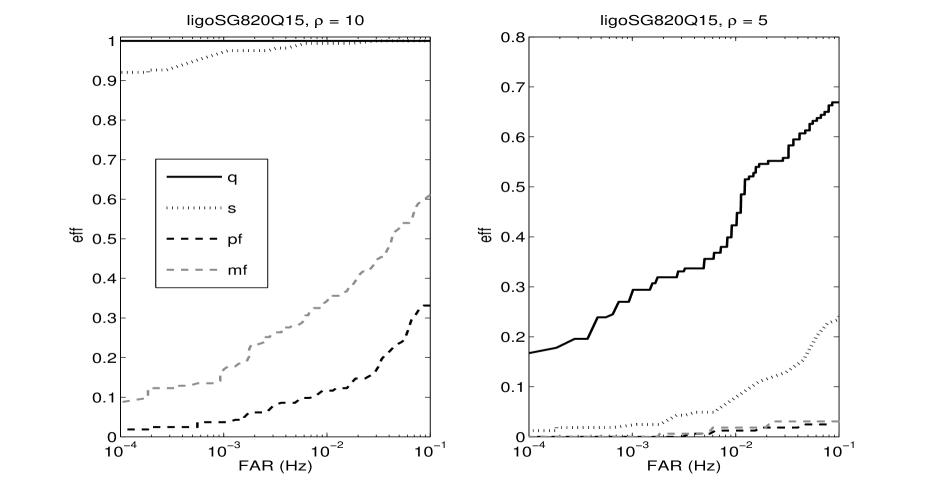
We present representative ROC curves for SG235Q5 and DFMa1b2g1, two values of (10 and 5) on Virgo data in figures 1 and 2, while the ROC curves for SG820Q15 and GA1d0, two values of (10 and 5), on LIGO data in figures 3 and 4. ROCs for the same waveform and different interferometers are not shown since the performance of the methods gave results fairly similar over the two noise spectra. Time domain methods were observed to perform better on GA pulses and DFM supernovae core collapse while time-frequency domain methods had a better performance on the SG signals. The two families of curves corresponding to the two values of of the injected signals also illustrate how the algorithm performance degrades with decreasing . SG results follow intuition since the time frequency tailoring of the QT and ST is close to a matched filter for minimum uncertainty waveforms of unknown phase in the whitened data. A similar line of thought applies to PC which is an optimal filter for GA pulses.
The performance of search is often quantified through the conditions for which, at the given FAR, a search achieves 50 and 90 efficiency. We present these conditions here in terms of since it is the parameter that quantifies the detectability of a signal in optimum filtering. In table 1 and 2 we present these for a FAR = 0.01Hz which would correspond to less than a false event in 3 hours, if a temporal coincidence between Virgo and one LIGO interferometers would be imposed. This is reasonable because if the noise triggers are generated randomly with a Poisson distribution, as is natural to expect for a stationary interferometer, the rate of coincidence can be estimated. The result is roughly given by the product of the two rates by twice the length of the temporal coincidence window, which can be bounded with 50 milliseconds for the searches involved in this study. Explicitly, the values of the necessary are computed in two steps: (a) the efficiencies for a given FAR and different are extracted from the ROC curves and (b) a numerical interpolation is performed with a least square fit that minimizes the free parameters of the asymmetric sigmoid
| (2) |
where corresponds to the value of for which the efficiency = 0,5 is the parameter that describes the asymmetry of the sigmoid (and takes values between -1 and +1) and describes the slope.
| LIGO eff | mf .5 | .9 | alf .5 | .9 | pc .5 | .9 | pf.5 | .9 | s .5 | .9 | q .5 | .9 |
| sg235q5 | 7.5 | 10.2 | 6.4 | 8.2 | 6.1 | 8.4 | 6.8 | 8.8 | 5.2 | 6.3 | 5.1 | 6.4 |
| sg235q15 | 10.9 | 15.5 | 9.2 | 12.6 | NA | NA | 6.3 | 8.5 | 5.4 | 6.7 | 5.1 | 6.5 |
| sg820q5 | 8.7 | 11.7 | 7.4 | 9.5 | NA | NA | 7.6 | 9.9 | NA | NA | 5.2 | 6.6 |
| sg820q15 | 15.4 | 24.4 | 11.1 | 15.4 | NA | NA | 6.8 | 8.5 | NA | NA | 5.1 | 6.3 |
| ga1d0 | 6.6 | 8.6 | 6.3 | 7.9 | 4.9 | 6.2 | 7.1 | 9.1 | 5.5 | 6.8 | 5.5 | 6.7 |
| ga4d0 | 7.5 | 9.6 | 6.4 | 8.1 | 4.9 | 6.0 | 6.8 | 8.6 | 5.9 | 7.4 | 5.6 | 7.0 |
| dfma1b2g1 | 7.3 | 9.3 | 6.7 | 8.6 | 5.1 | 6.4 | 7.8 | 10.1 | 6.9 | 8.4 | 6.5 | 8.2 |
| dfma2b4g1 | 6.9 | 9.2 | 6.6 | 8.6 | 5.8 | 7.5 | 8.0 | 10.3 | 6.6 | 8.2 | 6.4 | 8.0 |
| Virgo eff | mf .5 | .9 | alf .5 | .9 | pc .5 | .9 | pf.5 | .9 | s .5 | .9 | q .5 | .9 |
| sg235q5 | 7.5 | 9.9 | 6.9 | 8.7 | 6.6 | 8.7 | 6.5 | 8.4 | 5.7 | 7.2 | 5.2 | 6.4 |
| sg235q15 | 11.1 | 16.5 | 9.6 | 12.6 | NA | NA | 6.4 | 8.4 | 5.6 | 7.0 | 5.1 | 6.6 |
| sg820q5 | 8.1 | 10.6 | 6.8 | 8.4 | NA | NA | 7.6 | 9.6 | NA | NA | 5.1 | 6.5 |
| sg820q15 | 19.1 | 23.8 | 9.9 | 13.6 | NA | NA | 7.3 | 9.4 | NA | NA | 5.3 | 6.8 |
| ga1d0 | 5.8 | 7.6 | 5.6 | 7.1 | 4.9 | 6.0 | 7.2 | 9.1 | 5.6 | 7.0 | 5.9 | 7.5 |
| ga4d0 | 6.2 | 7.8 | 5.3 | 6.7 | 5.2 | 6.1 | 8.7 | 11.7 | 5.4 | 6.8 | 7.0 | 9.1 |
| dfma1b2g1 | 6.1 | 7.7 | 5.9 | 7.5 | 5.6 | 6.9 | 7.7 | 9.4 | 5.7 | 7.2 | 6.6 | 8.2 |
| dfma2b4g1 | 6.3 | 8.1 | 6.0 | 7.6 | 5.8 | 7.5 | 8.3 | 10.9 | 5.5 | 6.9 | 6.8 | 8.8 |
It is interesting to notice from table 1 and 2 that ST and QT which are both based on a multiresolution decomposition of the time frequency plane, have similar necessary to obtain the 50 and 90 efficiencies. Time domain methods similarly to the ROC curves require higher than for SG that for GA and DFM waveforms.
The accuracy of the estimate of the arrival time of a pulse determines how strict can be time consistency cuts typically involved in the post processing of the triggers and the angular resolution of a network of detectors. Explicitly, in order to identify the direction of arrival of a gravitational wave, the error in the peak time estimation needs to be much smaller than the travel times between LIGO interferometers ( 10 milliseconds) and between Virgo and one of the LIGO interferometers ( 20 milliseconds). A more quantitative analysis of the angular resolution is the goal of an ongoing project of this collaboration.
We present this information here in terms of the standard deviation and bias, both in milliseconds,
| (3) |
of the estimate of the peak arrival time with respect to the peak time of the injections for = 10 and FAR = 0.1Hz (which provides the largest statistics among the FARs we studied).
| standard-d | mf | alf | pc | pf | s | q |
| sg235q5 ligo | 1.4 | 1.2 | 1.2 | 21.7 | 0.7 | 0.7 |
| sg235q5 virgo | 1.5 | 1.3 | 1.3 | 13.8 | 0.8 | 0.9 |
| sg235q15 ligo | 4.1 | 4.2 | NA | 15.2 | 1.7 | 1.9 |
| sg235q15 virgo | 4.9 | 5.2 | NA | 11.7 | 2.0 | 2.5 |
| sg820q5 ligo | 0.4 | 0.4 | NA | 15.9 | NA | 0.2 |
| sg820q5 virgo | 0.4 | 0.3 | NA | 16.9 | NA | 0.2 |
| sg820q15 ligo | 1.3 | 1.3 | NA | 19.1 | NA | 0.6 |
| sg820q15 virgo | 8.4 | 3.3 | NA | 14.5 | NA | 0.7 |
| ga1d0 ligo | 1.2 | 1.6 | 0.1 | 15.5 | 0.7 | 0.7 |
| ga1d0 virgo | 1.2 | 0.6 | 0.1 | 16.4 | 0.8 | 0.8 |
| ga4d0 ligo | 1.6 | 3.5 | 0.3 | 15.5 | 5.8 | 1.5 |
| ga4d0 virgo | 2.5 | 1.6 | 0.3 | 12.3 | 1.4 | 1.9 |
| dfma1b2g1 ligo | 0.3 | 1.0 | 0 | 23.0 | 1.4 | 0.7 |
| dfma1b2g1 virgo | 0.3 | 0 | 0 | 15.2 | 0.4 | 0.2 |
| dfma2b4g1 ligo | 1.7 | 2.8 | 1.0 | 18.1 | 2.6 | 2.2 |
| dfma2b4g1 virgo | 2.5 | 0.3 | 0.2 | 18.1 | 2.5 | 1.4 |
| bias | mf | alf | pc | pf | s | q |
| sg235q5 ligo | 1.8 | 0.2 | 0.2 | -5.0 | 1.7 | -0.1 |
| sg235q5 virgo | 0.7 | -0.5 | -0.5 | -3.9 | 0.4 | -0.1 |
| sg235q15 ligo | 1.9 | 0.3 | NA | -5.8 | 1.5 | -0.2 |
| sg235q15 virgo | 0.6 | -0.1 | NA | -9.5 | 0.5 | 0 |
| sg820q5 ligo | 0.1 | -0.4 | NA | -7.2 | NA | 0 |
| sg820q5 virgo | 0.1 | -0.4 | NA | -5.1 | NA | 0 |
| sg820q15 ligo | 0.3 | -0.4 | NA | -4.8 | NA | -0.1 |
| sg820q15 virgo | 1.1 | 0 | NA | -5.1 | NA | 0 |
| ga1d0 ligo | 1.2 | 3.3 | 0 | -0.4 | 3.7 | 0 |
| ga1d0 virgo | -0.7 | 2.3 | 0 | 0.7 | 1.6 | -0.1 |
| ga4d0 ligo | 3.3 | 8.0 | 0 | 4.4 | 2.9 | 0 |
| ga4d0 virgo | -0.2 | 3.3 | 0 | -3.6 | 0 | -0.2 |
| dfma1b2g1 ligo | -0.2 | 0.6 | -0.1 | -8.6 | 1.5 | 0.2 |
| dfma1b2g1 virgo | -0.4 | 0 | -0.1 | -6.1 | 0 | -0.1 |
| dfma2b4g1 ligo | 2.4 | 4.4 | -1.0 | 4.6 | 4.6 | -0.9 |
| dfma2b4g1 virgo | -2.8 | 2.0 | -1.3 | -1.0 | 2.6 | -1.6 |
The accuracy of the searches appears to be similar between LIGO and Virgo data. Most of the methods can be used for a directional search on most the waveforms since the time accuracy is typically smaller than the travel time between the interferometers. It is also worth notice that the feasibility of directional searches rapidly degrades with decreasing and that, if a method shows a systematic negative bias, this can be usually easily corrected.
4 Conclusions
The main motivation of this work was to prepare the ground to
joint searches of gravitational burst signals between the LIGO and Virgo interferometers.
In particular in this work we built a joint framework where
we learned how to exchange interferometer data, trigger files and analyze each other’s data.
We also gained a deeper understanding of the operational properties of our burst
searches. This analysis showed that the performance of time domain and frequency domain methods
have different strengths on different kinds of waveforms. The performance of the searches was
fairly stable shifting between LIGO and Virgo data. The study of the
arrival time estimation accuracy showed that most of the methods can be employed in directional
searches if the is high enough and gave an indication of how stringent can be temporal
consistency cuts between different interferometers. If a combination of the methods had to be
applied on real data it would need to be studied as a search in itself.
In particular more extensive studies would be necessary to verify if the ROC curve of the combination
of methods stands above the ROCs of the single searches.
The next steps of this work are to extend this comparisons on directional searches
to be performed on simulated data corresponding to an network of 3 interferometers,
investigate more the usefulness of combination of methods and explore the use of consistency
criteria other than the arrival time. It is also in the plans to expand the number of searches
involved in the study.
LIGO Laboratory and the LIGO Scientific Collaboration gratefully
acknowledge the support of the United States National Science Foundation for the construction and operation of the LIGO Laboratory and for the support of this research.
References
References
-
[1]
Proposal for joint LIGO-Virgo data analysis, LIGO-T040137-08-Z and VIRGO-PLA-DIR-1000-201(2004)
-
[2]
S. Chatterji, L. Blackburn, G.Martin, and E. Katsavounidis, CQG 21, 2004
-
[3]
A.C. Clapson et al., these proceedings.
-
[4]
GM Guidi et al., CQG 21(5), 815, 2004.
-
[5]
N. Arnaud et al.Phys. Rev. D59, 082002 (1999)
-
[6]
T. Pradier et al. Phys. Rev. D63, 042002 (2001)
-
[7]
N. Arnaud et al. Phys. Rev. D67, 062004 (2003)
-
[8]
A.C. Clapson et al., these proceedings.
-
[9]
H. Dimmelmeier, J. Font and E. Mueller, AA, 393 (2002), 523-542.