Send correspondence to A. Freise, E-mail: andreas.freise@ego-gw.it
Status of VIRGO*
Abstract
The French-Italian interferometric gravitational wave detector VIRGO is currently being commissioned. Its principal instrument is a Michelson interferometer with 3 km long optical cavities in the arms and a power-recycling mirror. This paper gives an overview of the present status of the system. We report on the presently attained sensitivity and the system’s performance during the recent commissioning runs.
After a sequence of intermediate stages, the interferometer is now being used in the so-called recombined configuration. The input laser beam is spatially filtered by a 144 m long input mode-cleaner before being injected to the main interferometer. The main optics are suspended from so-called superattenuators, which provide an excellent seismic isolation. The two 3 km long Fabry-Perot arm cavities are kept in resonance with the laser light, and the Michelson interferometer is held on the dark fringe. An automatic mirror alignment system based on the Anderson technique has been implemented for the arm cavities. The light leaving the dark port contains the gravitational wave signal; this light is filtered by an output mode-cleaner before being detected by a photo detector. This setup is the last step on the way to the final configuration, which will include power recycling.
keywords:
gravitational wave detector, VIRGO, interferometer∗ Presented by A. Freise for the VIRGO Collaboration.
1 INTRODUCTION
The French-Italian collaboration VIRGO [1] has built a large-scale interferometric gravitational-wave detector near Pisa, Italy. The main instrument is a Michelson interferometer (MI) with 3 km long Fabry-Perot cavities in its arms. A passing gravitational wave can be detected as a change in the relative length between a set of free falling test masses. High-quality optics are suspended to act as quasi-free test masses at the end of the Michelson interferometer arms so that a gravitational wave, passing perpendicular to the detector, will be detected in the interferometer signal. The Fabry-Perot cavities in the arms enhance the light power and thus increase the optical gain of the interferometer.
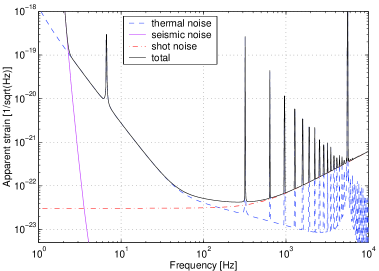
In order to reach the extreme sensitivity required for detecting gravitational waves (see Figure 1), the VIRGO detector uses special techniques to minimise the coupling of noise into the interferometric signal. The large optics (mirrors and beam splitters) are super-polished fused silica pieces with very low absorption and scattering. They are located in an ultra-high vacuum system and suspended from a sophisticated seismic isolation system. The laser light is stabilised in frequency and spatially filtered by a 144 m long suspended mode cleaner.
The end of the construction phase was marked by the installation of the last test mass in June 2003. Between 2002 and 2003, the central interferometer (CITF) [9] was commissioned, and in 2003 the commissioning of the VIRGO detector was finally started. Step by step the various subsystems are being implemented and tested. In fact, then the two 3 km long arm cavities were put into operation and then combined to the large-scale Michelson interferometer. To date the system is run in the so-called recombined configuration, which is the last milestone before the detector will reach its final configuration including power recycling.
The first scientific data-taking periods are planned for 2005. At that point VIRGO will join LIGO, TAMA and GEO 600 [2, 3, 4] in the existing network of interferometric detectors.
In this paper, the status of the detector will be presented with special emphasis on its performance during the recent data-taking periods.
2 Optical Layout
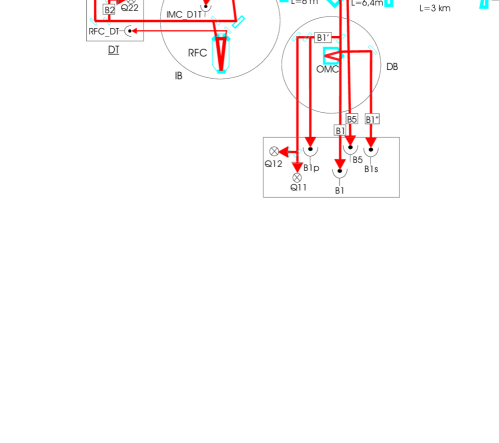
Figure 2 shows a simplified optical layout of the VIRGO interferometer in its final configuration. The laser light, 20 W @1064nm provided by an injection-locked master-slave solid state laser (Nd:YAG), enters the vacuum system at the injection bench (IB). The beam is spatially filtered by a 144 m long input mode-cleaner cavity (IMC) before being injected into the main interferometer.
The laser frequency is pre-stabilised using the IMC cavity as a reference. The low-frequency stability is achieved by an additional control system that stabilises the IMC length below 15 Hz to the length of a so-called reference cavity (RFC). The RFC is a 30 cm long rigid triangular cavity suspended in vacuum; it consists of ULE, a material with a very low thermal expansion coefficient.
A beam with 10 W of power enters the Michelson interferometer through the power-recycling mirror. It is split into two beams that are injected into the 3 km long arm cavities. Together with the MI (which is held on the dark fringe) the power-recycling mirror forms a Fabry-Perot-like cavity in which the light power is resonantly enhanced. The optical (recycling) gain of this cavity is 50, which leads to 500 W of light at the beam splitter; the bandwidth (FWHM) of the Phys. Rev. C (PRC) is designed to be Hz.
The finesse of the arm cavities is approximately 50; this yields a circulating light power of 8 kW. The MI is held on the dark fringe, and the gravitational wave signal is expected in the beam from the dark port, which is leaving the vacuum via the so-called detection bench (DB). The detection bench is a suspended optical bench accommodating several optical components. The main beam is passed through an output mode cleaner (OMC), a 2.5 cm long rigid cavity.
To achieve a shot noise limited sensitivity, the main output beam is detected by a group of 16 InGaAs photo diodes. For control purposes, other photo diodes are also used. Useful signals are obtained by detecting the light in the transmission of the arm cavities and in reflection of the Phys. Rev. C, as well as detecting the reflection at the secondary surface of the beam splitter and the light reflected by the OMC.
3 Commissioning of the VIRGO detector
The commissioning period is divided into three main phases with different detector setups: in phase A the two arm cavities are used separately, whereas in phase B the arm cavities and the beam splitter are controlled to hold the Michelson on the dark fringe; this is the so-called recombined configuration. In both phases the power-recycling mirror is kept misaligned. In phase C the Phys. Rev. C will also be aligned to reach the final VIRGO configuration. According to plan, the commissioning is to be finished by the end of this year with the detector in its final configuration.
The go-ahead for the commissioning of the detector was given by the alignment of the IMC output beam through the 3 km long arms in September 2003. In October the north arm cavity was locked, i.e. the cavity length was actively controlled to be resonant with the input laser frequency. A stable operation of the control was achieved at the first trial using a lock acquisition algorithm and loop filter that were previously tested with a SIESTA111SIESTA is a time-domain simulation developed in the VIRGO collaboration, able to model the optical and mechanical properties of the interferometer as well as control loops. simulation.
The west arm cavity became available (i.e. the optics were aligned and locally controlled) in November 2003, and the first longitudinal lock was achieved in late December. In the meantime, the automatic alignment of the mirrors of the north arm had been implemented, so that in January 2004, the automatic alignment control could be started for the first time on one of the long cavities.
In February the first lock of the recombined interferometer could be demonstrated. It turned out that some of the control signals were polluted by offsets that depend on the alignment of the main optics. Consequently the work on the recombined interferometer was stopped in order to implement the automatic alignment of the west arm cavity, which was finished in April 2004. At the same time the second stage of frequency stabilisation (see Section 6) had been implemented, and its first successful operation was demonstrated in March 2004.
We have now completed phase B: the arm cavities can be controlled independently in all degrees of freedom, and the recombined configuration has been successfully tested and is currently used to characterise the optical setup. Currently the light power of the IMC output beam is 8 W. The detector is used without recycling, i. e. the power-recycling mirror is misaligned by several mrads and merely attenuates the transmitted light (). This yields a light power at the beam splitter of W and approximately 10 W of light circulating in the arm cavities.
Approximately every two months a short period of continuous data taking, a so-called commissioning run is scheduled. The data show the progress of the commissioning of the instrument and the effects of the detector evolution on the detector sensitivity.
The following runs have been performed so far:
-
•
C1: 14.–17. November 2003, north arm cavity longitudinally controlled
-
•
C2: 20.–23. February 2004, north arm cavity with longitudinal and angular control
-
•
C3: 23.–27. April 2004, two configurations: a) north arm as in C2 plus a second stage of laser frequency stabilisation, and b) the recombined interferometer (no automatic alignment nor second stage of frequency stabilisation)
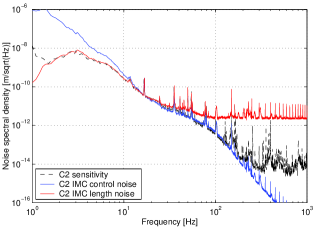
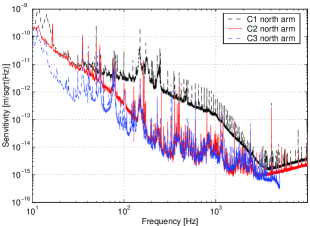
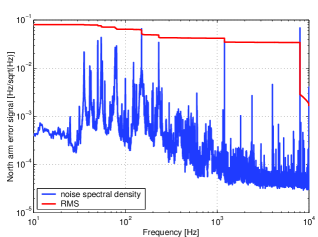
Figure 3 shows the displacement sensitivity of the detector during these three runs. Compared to the final detector the intermediate optical setups are more sensitive to frequency noise, so that this noise limits the current sensitivity over a wide frequency range. In addition, the electronic noise (or sensor noise) is larger than the shot noise because of the low circulating light power without recycling. The C1 sensitivity has been found to be limited by laser frequency noise from 7 Hz to 4 kHz and by electronic noise for higher frequencies. Therefore, the main goal between C1 and C2 was to reduce the laser frequency noise in the measurement band ( Hz). By reducing the bandwidth of IMC control loops (local control, automatic alignment, length control) the frequency noise could be reduced in the range Hz by slightly enhancing it for lower frequencies. One can see the result in the improved sensitivity in C2, which is still mainly limited by laser frequency noise (from 2 Hz to 200 Hz) as explained in Figure 4. For frequencies from 200 Hz to a few kHz the noise could not be clearly identified yet. Its origins are partly seismic noise near the injection system and mechanic vibrations by vacuum pumps. Very likely this noise couples into the main output also through the laser frequency. Two different configurations were used during C3. At first only the north arm was controlled, but with a second stage of frequency stabilisation. For a single cavity this frequency stabilisation yields in principle no sensitivity improvement; the slight improvement as seen in Figure 3 is simply due to a lower bandwidth of the RFC loop (see below for description of the frequency stabilisation control).
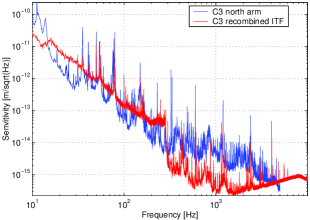
It is interesting to compare the two sensitivity curves referring to the C3 run. The recombined interferometer has an intrinsically higher rejection of frequency noise. This can be seen in the better sensitivity at high frequencies. At frequencies below 300 Hz, electronic noise is limiting the sensitivity. This noise is re-injected by the arm cavity controls, which, in this run, used preliminary sensor signals.
In the following, we will give an overview of the main subsystems, with emphasis on the improvements achieved so far during the commissioning.
4 Control and data acquisition
The control of the main optical components is mainly performed by two digital control systems: for each suspension a digital signal processor with a sampling of 16 bits at 20 kHz (DSP) is used to read the local sensors (for example, accelerometers, LVDTs, optical lever signals) and generate the correction signals for the local control and the inertial damping. In addition, the so-called Global Control (GC) [5] is used to read photo diode signals and generate global correction signals (for example the differential motion of the cavities). The correction signals are sent to the DSP of the respective suspensions via a digital optical link (DOL). The DSP finally sends them to the appropriate actuator.
The data acquisition chain was successfully tested during the commissioning runs. The current data rate is 7 Mbytes/s of compressed data.
5 Suspensions
While the VIRGO detector uses an optical layout similar to that of other interferometric detectors, it aims at achieving very high sensitivities down to low frequencies (>10 Hz). This is possible due to a sophisticated suspension system for the main optical components, the superattenuator (SA) [6]. This suspension system resides in up to 9 m tall vacuum chambers and is composed of several filter stages. The mirror and a reference mass each are suspended by two steel wires from a so-called marionette. Longitudinal forces to the mirror can be applied via coil-magnet actuators, with the magnets attached to the mirror surface and the coils being supported by the reference mass. In addition, coil-magnet actuators at the marionette level can be used to apply forces in longitudinal and angular directions.
The topmost filter is rigidly connected to a ring that rests on three legs forming an inverted pendulum. This pendulum has a very low horizontal resonance frequency (40 mHz). While providing a good attenuation of seismic noise already at low frequencies, it also allows to move the top point of the suspension by up to 20 mm using very small forces.
At the resonance frequencies of the various isolation stages, the seismic motion is actually enhanced. Therefore, active controls are used to damp the mirror motion at these frequencies (DC to approximately 5 Hz). The control is split into two parts: the inertial damping [7] (ID) and the local control [8] (LC). The ID is a control system that uses three linear variable differential transformers (LVDTs) and three accelerometers located on the upper mechanical filter. The actuation is performed via three coil-magnet actuators also located on the same mechanical filter.
The LC can control the mirror in three degrees of freedom: the displacement along the optical axis (), the angular rotation around the vertical axis (), and the rotation around the horizontal axis perpendicular to the beam (). The feedback for angular control is applied only via the coil-magnet actuators on the marionette, whereas longitudinal feedback can be sent to the marionette, to the reference mass actuators and to the top stage of the inverted pendulum (see below).
The excellent passive seismic isolation of the SA was characterised during the commissioning of the CITF [9]. Measurement of the seismic attenuation yielded a factor of at 4 Hz as an upper limit. The RMS motion of the mirror was measured to be below 1 m and 1 rad for longitudinal and angular displacement respectively.
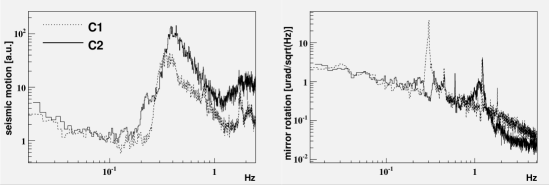
During the commissioning the control loops of the ID and LC were optimised for better performance. Figure 5 shows a comparison of two data stretches recorded during the C1 and C2 runs: during both runs the seismic noise was enhanced due to a storm, especially around 300–500 mHz, by a factor of approximately 50. The C1 data show that this noise is visible as a large motion of the mirrors at 300 mHz, associated with an angular resonance of the payload. Consequently the filters of the control were adjusted and in C2 the large seismic noise could successfully be damped.
The earth tides cause a slow regular elongation of the arm cavities of m amplitude (peak-to-peak). The dynamic range of the coil-magnet actuators at the mirror level (used for longitudinal feedback) is just m. To achieve continuous stable operation one has to increase the dynamic range of the control. During the CITF a hierarchical feedback system was tested, which sent low-frequency feedback (bandwidth 70 mHz) to the top stage of the suspension. It has been shown that this not only provides a compensation for the earth tides but also reduces the RMS of the correction signals by one order of magnitude [10].
During the last commissioning runs this tidal control was not available so that a regular manual adjustment of the top stage was performed by operators. Recently a first implementation of the tidal control was demonstrated on one arm and will be used in the future as standard configuration.
6 Frequency Stabilisation
The extreme sensitivity needed for the detection of gravitational waves requires a sophisticated laser stabilisation. For example, the typical frequency noise of the principal laser source is given with 1 kHz at 10 Hz. In order to reach the desired sensitivity of VIRGO this frequency noise has to be reduced to Hz (at the beam splitter). Such large suppression can only be achieved by an active stabilisation.
The laser source is an injection-locked master-slave system that can deliver 20 W of continuous power at 1064 nm. The laser light is modulated in phase at a frequency of 14 MHz before it enters the vacuum. The laser frequency is then stabilised to the length of the IMC up to a Fourier frequency of 270 kHz using a standard Pound-Drever-Hall (PDH) scheme. The bandwidth of this control loop is limited by the FSR of the IMC at MHz. As the optical components of the IMC are suspended in vacuum this control provides an excellent stability at high frequencies. In order to reduce the low-frequency fluctuations, 0.1% of the light impinging on the IMC is split off and injected into the RFC. Another PDH loop is used to control the length of the IMC with respect to the length of the RFC, for frequencies below 15 Hz. Thus the laser frequency inherits the good DC stability of the RFC. The pre-stabilisation was successfully implemented and tested during the commissioning of the CITF [9].
The combination of two control loops as described in the previous paragraph performs the laser pre-stabilisation needed during the lock acquisition of the main interferometer. As soon as the interferometer is locked in all longitudinal degrees of freedom the laser frequency will be further controlled to be resonant inside the Phys. Rev. C.
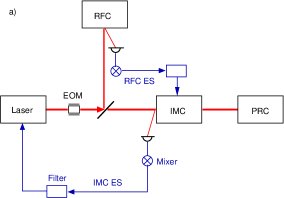
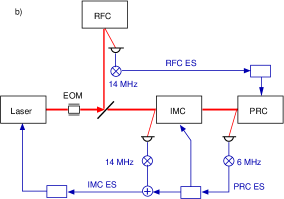
The layout of the control system is shown in Figure 6. A second phase modulation at MHz (the frequency is tuned to be resonant in the IMC) is applied to the laser light. The laser frequency is first stabilised to the IMC as before. The PDH error signal obtained with the light reflected from the power-recycling mirror is added into the error point of the IMC-loop (bandwidth 1 kHz). In addition, the same signal is applied to the length of the IMC (bandwidth 200 Hz). This guarantees that the laser frequency and the length of the IMC follow the length of the recycling cavity, which, due to its greater length, provides a better relative stability for Fourier frequencies above the internal resonances of the mirror suspensions. The incorporation of this error signal is called second stage of frequency stabilisation (SSFS). The control signal derived from the reference cavity can no longer be applied to the IMC and is fed back to the length of the PRC.
The SSFS was implemented in a preliminary configuration in early 2004. Instead of the PRC, which is not yet available, the north arm cavity (NA) was used. The NA has a simpler optical transfer function than the PRC, and, in addition, the injected power in this setup is lower than with recycling (due to the attenuation of the misaligned PR). Nevertheless, it can be used to test the performance of the designed control system. The first four days of the C3 run were dedicated to test the SSFS: The west arm cavity was not used and the laser was locked to the NA using diode B1 (see Figure 2) for the NA error signal (NA ES). This signal was then used exactly as shown for PRC ES in Figure 6 and the low-frequency control signal from the RFC was fed back to the NE mirror.
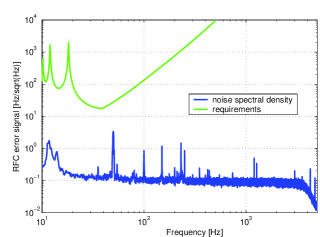
The system worked reliably during the run, with the longest continuous operation of 32 hours. Figure 7 shows the in-loop frequency noise (i.e. the error signals of the RFC and of the NA) during the run. The RFC loop is already implemented in its final configuration and the noise is well below the requirements. The NA error signal is higher than the requirements (approximately Hz) because the lock of the laser to the NA uses only a simple filter. The final control loop will have more gain, and the current measurements expect us to achieve the required frequency stabilisation.
7 Recombined Interferometer
In the recombined configuration both arm cavities are longitudinally locked at resonance, the Michelson interferometer is held on the dark fringe, and the PR mirror is strongly misaligned. This mode can be used for various states of the other subsystems, i.e. the frequency stabilisation, the automatic alignment and the OMC. Although the MI in the recombined configuration does not provide a very sensitive detector, it is a final step on the way to the detector with recycling. It allows to characterise the optical signals so that the proper control system for the recycled interferometer can be derived.
Three longitudinal degrees of freedom have to be controlled. Several methods are available to derive the necessary control signals from the various available photo diodes (see Figure 2). By demodulating the photo current of B1, B1p, B2, B5, B7 and B8 at 6 MHz one can extract error signals that are proportional to one or a combination of longitudinal degrees of freedom. In addition to the suitable control signals a proper sequence for the lock acquisition has to be found.
During the C3 run the following control scheme was used: first the two arm cavities are independently locked to the pre-stabilised laser. The error signal for the NA is obtained from B5, and the error signal for the WA from B8. Both signals are linearised by dividing them by the respective cavity power (detected on B7 and B8 respectively). This method extends the linear range of the error signal by a factor of 10. The correction signal is fed back to the respective end mirrors. The MI dark fringe lock is switched on; the error signal is generated by demodulating the signal from the dark fringe (B1) at 6 MHz; it also contains the gravitational wave signal. In this case the OMC was not locked but held on or close to a resonance by hand. The correction signal is applied to the beam splitter. All three loops use the same filter with a bandwidth of 50 Hz. The locking accuracy (of the MI control) that can be achieved with the current control scheme has been estimated from the measured data to be mRMS, assuming that the SSFS will improve the frequency stability as expected. This accuracy is already close to the requirements for the final setup, in which the accuracy will be improved considerably by the high optical gain.
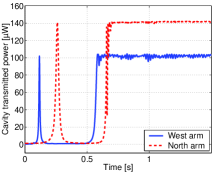
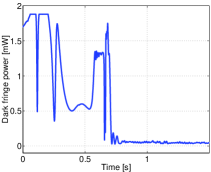
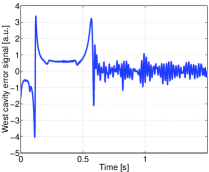
The lock acquisition using this sequence is very reliable. Figure 8 shows a time stretch of a lock acquisition event. Statistic tests have shown that a successful acquisition of lock could be achieved on every fringe. During the C3 run the recombined interferometer could be locked continuously for several hours, limited by drifts of the mirror alignment because the WA automatic alignment was not yet implemented. The error signal for the MI control suffers from offsets which are introduced by misaligned optics. Therefore, the automatic alignment must be implemented to achieve a stable long-term operation of the recombined interferometer.
During C3 a different loop filter for the arm cavity control was also tested. This filter has a steep roll-off at 300 Hz in order to avoid re-injecting electronic noise at higher frequencies. The fourth plot in Figure 3 shows the corresponding improvement in sensitivity when this filter is used.
8 Automatic Alignment
The optics of the Michelson interferometer and of the cavities have to be well-aligned with respect to each other and with respect to the incoming beam to reach their high optical qualities.
To guarantee a stable long-term operation and a high sensitivity the angular degrees of freedom have to be actively controlled. A standard technique for measuring the misalignment of optical components in this type of interferometer is the so-called differential wave-front sensing. It can be used with the light reflected or transmitted by the cavity; the latter, also called Anderson technique [11], is used in VIRGO [12]. The laser light is modulated in phase at a specific RF frequency, such that the sidebands in the first order transverse modes () are resonant in the arm cavities. The transmitted light is detected by split photo detectors, i. e. quadrant diodes (QD) with four independent segments. The photo currents of these QDs are demodulated at the RF frequency to yield signals proportional to the misalignment of the optical components. The two horizontal degrees of freedom (or vertical respectively) can be separated by using two QDs that are positioned to detect the light field at a different Gouy phase. The correction signals are fed back to the coils of the marionette. This, and the low bandwidth of the control loop ( Hz), ensures that the angular control does not introduce noise in the measurement band.
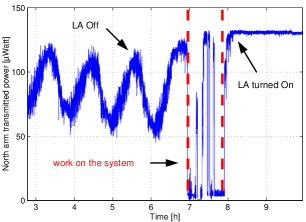
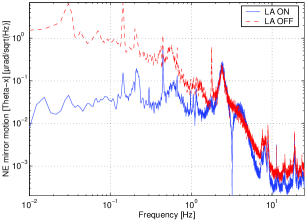
During the C2 run (see Figure 9) the automatic alignment of the north arm cavity was tested with an otherwise unchanged setup. Thus the Anderson technique was demonstrated for the first time in a large-scale interferometer. The presence of the alignment control reduces the power fluctuations in the cavity considerably and allows long continuous operation without manual re-alignment of the optics.
During C3 the automatic alignment of the NA was tested together with the SSFS, and a 32-hour long period of continuous operation shows the reliability also of the alignment control. Recently the automatic alignment was successfully implemented on the west arm. This step completes the automatic alignment for the current interferometer configuration.
9 Output Mode Cleaner
Due to several possible optical defects, like mirror surface deformations, misalignments and radii of curvature mismatch, the interference at the main beam splitter is degraded; as a consequence, a fraction of the light leaves the dark port as higher order TEM modes. This increases the shot-noise level on the main photo detector, and decreases the sensitivity. This problem can be solved with another cavity in front of the photo detector filtering out the higher order modes. This output mode cleaner (OMC) is a short monolithic cavity ( cm) made of silica. It is located on the detection bench (DB) (see Figure 2), and has a finesse of 50 and a large bandwidth of 75 MHz. The cavity is controlled by changing its length via the temperature using a Peltier cell that is connected to the support structure. The error signal is generated by modulating the cavity length at 28 kHz with a piezoelectric actuator. It is difficult for the length control of the OMC to identify the correct mode, i. e. the , since a large amount of light might be in higher modes and the error signal is similar for the resonances of all TEM modes. For this purpose a CCD read-out system is used for analysing the transmitted light of the OMC, and the transmitted mode is identified with a method.
The control and the automatic acquisition of lock of the OMC were already demonstrated successfully during the CITF commissioning; however, in that case the DB was fixed and not in vacuum. During the VIRGO commissioning the OMC control and alignment were updated to work with the DB suspended in vacuum. Due to the vacuum the control via temperature is slower; a lock of the OMC can take 10 to 20 minutes. An automatic alignment system uses two quadrant diodes to automatically center the beam coming from the beam splitter to the OMC by moving two mirrors of a mode-matching telescope in front of the OMC. This method is used when the automatic alignment of the interferometer is engaged, because otherwise the asymmetric shape of the beam impinging on the quadrants creates a false signal.
The OMC was used regularly during the commissioning runs. The lock, once acquired, is very robust. We did not observe any unlock due to the OMC itself. When the main interferometer unlocks (and the IMC stays locked) the OMC temperature is stabilised to the current value so that the OMC lock can be recovered immediately after a re-lock of the interferometer.
The precision of the OMC length control has been measured to be , which is 10 times better than the requirements. During the CITF commissioning the contrast improvement due to the OMC was measured to be of the order of 10.
10 Conclusion
Since the start of the commissioning of the VIRGO detector in September 2003, both 3 km long arm cavities have been put into operation. The longitudinal control, and the automatic alignment have been implemented. In February of this year the Michelson interferometer with the arm cavities has been locked in the recombined configuration.
In addition, the second stage of frequency stabilisation has been implemented and tested, using the north arm cavity. The detection bench with the output mode cleaner was suspended and put in vacuum.
Three commissioning runs, periods of continuous data taking, have been performed to understand the performance of the system. Several upgrades and optimisations of the subsystems, mainly the active control of the IMC, have been carried out to improve the sensitivity and reliability of the detector.
In June the next commissioning run will be used to operate the interferometer in the recombined configuration with automatic alignment in all degrees of freedom and the second stage of frequency stabilisation. This completes the last intermediate phase before moving to the final configuration, including power recycling. By the end of this year the detector should be fully operationable in this configuration.
References
- [1] C. Bradaschia et al., Nuclear Instruments and Methods in Physics Research A 289, 518–525 (1990).
- [2] D. Sigg et al., “Commissioning of the LIGO detectors”, Class.Quant.Grav., 19(7), 1429–1435 (2002).
- [3] M.Ando et al., Current status of TAMA, Class.Quant.Grav. 19(7), 1409–1419,(2002).
- [4] B. Willke et al., The GEO 600 gravitational wave detector, Class.Quant.Grav., 19(7), 1377–1387 (2002).
- [5] F.Cavalier, Le controle global de VIRGO, thèse d’habilitation à diriger des recherches, Université Paris Sud, LAL 01-69 (2001)
- [6] G. Ballardin, et al., "Measurement of the VIRGO superattenuator performance for seismic noise suppression", Rev. Sci. Instrum. 79 9, 3643 (2001).
- [7] G. Losurdo, et al., "Inertial control of the mirror suspensions of the VIRGO interferometer for gravitational wave detection", Rev. Sci. Instrum., 79 9, 3653–3661 (2001).
- [8] F. Acernese, et al., "A local control system for the test masses of the Virgo gravitational wave detector", Astrop. Phys., 20 (6), 617–628 (2004).
- [9] F. Acernese, et al., "The commissioning of the central interferometer of the Virgo gravitational wave detector", Astrop. Phys., 21 (1), 1-22 (2004).
- [10] F. Acernese, et al., "First locking of the Virgo central area interferometer with suspension hierarchical control", Astrop. Phys., 20 (6), 629–640 (2004).
- [11] D. Z. Anderson, “Alignment of resonant optical cavities”, Appl. Opt. 23 2944–2949 (1984).
- [12] D. Babusci, H. Fang, G. Giordano, G. Matone, L. Matone, V. Sannibale, “Alignment procedure for the VIRGO interferometer: experimental results from the Frascati prototype”, Phys. Lett. A 226, 31–40 (1997).