Upper limits on stray force noise for LISA
Abstract
We have developed a torsion pendulum facility for LISA gravitational reference sensor ground testing that allows us to put significant upper limits on residual stray forces exerted by LISA-like position sensors on a representative test mass and to characterize specific sources of disturbances for LISA. We present here the details of the facility, the experimental procedures used to maximize its sensitivity, and the techniques used to characterize the pendulum itself that allowed us to reach a torque sensitivity below 20 fN m from 0.3 to 10 mHz. We also discuss the implications of the obtained results for LISA.
pacs:
04.80Nn, 07.10Pz, 07.87+v1 Introduction
The LISA (Laser Interferometer Space Antenna) sensitivity goal requires that the test masses (nominally 2 kg) are kept in free fall with an acceleration noise below 310-15 ms in the frequency range down to 0.1 mHz [1]. With most environmental noisy forces screened by shielding the test masses in a drag-free satellite, the resulting main source of residual disturbances is the satellite itself. The spacecraft is kept centered about the test mass by a displacement sensor which guides a thruster array. Capacitive position sensors have been developed to meet LISA requirements in terms of displacement sensitivity and residual force noise [2, 3]. In parallel with the planned LTP flight test [4], a torsion pendulum facility has been developed [5, 6] as a precision test-bench for characterizing, on ground, the purity of free fall allowed by LISA gravitational reference sensors.
Significant upper limits of the sensor induced force noise can be placed by suspending a representative hollow test mass inside a LISA-like position sensor and searching for residual forces exerted on the test mass along the torsional degree of freedom down to the level permitted by the pendulum torque noise floor. In order to maximize the apparatus sensitivity as a torque detector it is necessary to isolate it from any environmental effect which could leak into the torsional mode by reducing the coupling to the disturbance and/or the noise level of the disturbance itself.
In this paper we describe in detail the apparatus, focusing on the experimental techniques used to characterize and maximize the sensitivity of the pendulum. As shown in [6], we reached a torque sensitivity below 20 fN m from 0.3 to 10 mHz, within a factor 3 to 5 above the pendulum intrinsic thermal noise across this frequency range. Finally, we discuss the implications of these results for LISA displacement sensor characterization.
2 Details of the torsion pendulum facility
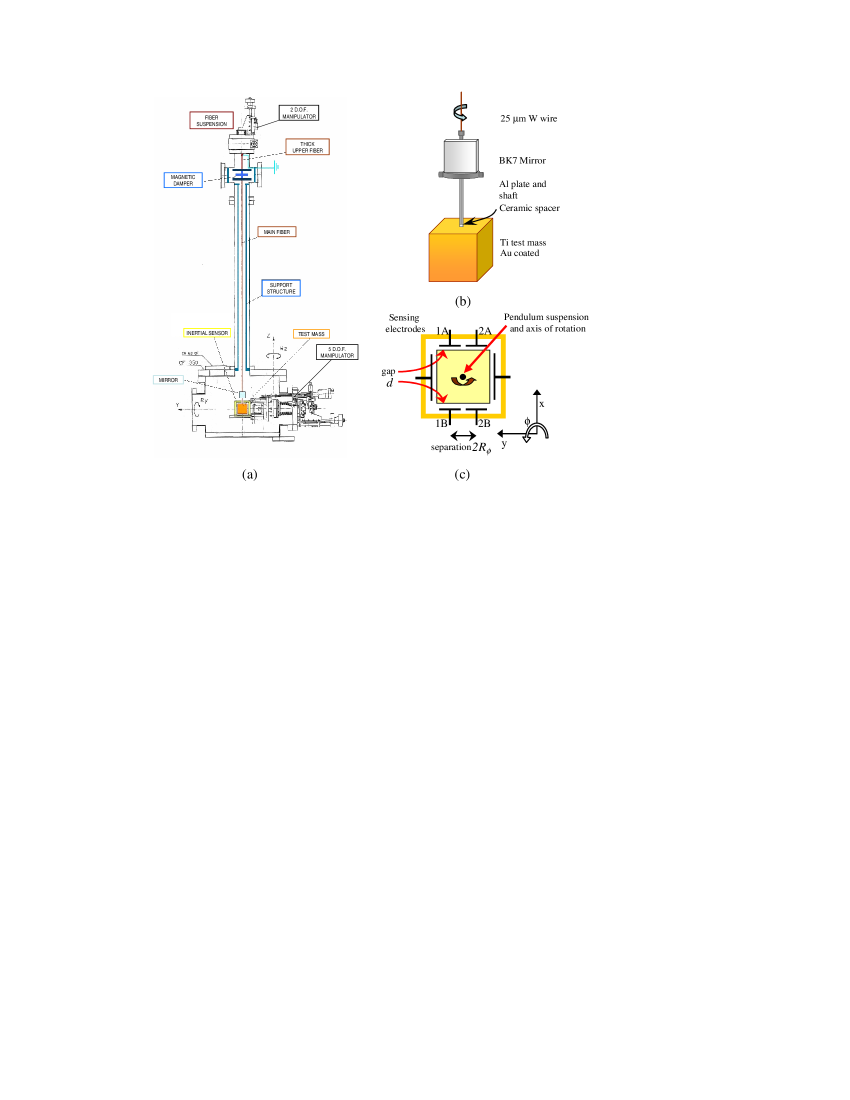
A schematic of the torsion pendulum facility is shown in figure 1a: a vacuum vessel accommodates a prototype sensor surrounding the test mass and its 6-channel capacitive-inductive readout electronics [2, 3]. The chamber is mounted on a platform whose inclination can be adjusted, while the whole facility sits on a concrete slab partially isolated from laboratory floor.
As shown in figure 1b, the torsion pendulum is composed of a hollow gold-coated Ti cube, with = 40 mm sides and 2 mm wall thickness, and a supporting Al bar, on which a stopper plate and optical mirror for independent readout are mounted. The test mass is electrically isolated by a ceramic spacer, while the rest of the pendulum is grounded through the torsion fiber, a Au-coated W wire nominally 25 m thick and 1 m long. The pendulum free torsional period is 515.1 s, with an energy decay time s, corresponding to a quality factor Q 1650.
The torsion pendulum hangs from a magnetic eddy current damper upper stage consisting of a W fiber, with radius m and length 15 cm, supporting an Al disk surrounded by toroidal rare earth magnets. The magnetic damper reduces the swing mode energy decay time to 70 s without affecting the twist mode performance because of the cylindrical symmetry of its design. This double suspension acts as a gimble, ensuring that the main torsion fiber suspension point hangs essentially vertical, while giving a negligible contribution to the torsional mode; it is rotationally much stiffer than the main fiber (the spring constant scales for round fibers).
The capacitive sensor, the Mo-Shapal prototype discussed in [2], can be centered, based on the sensor 6-channel capacitive-inductive readout, around the suspended test mass using a 5 degree of freedom micromanipulator, while the fiber suspension point can be raised in and rotated along . The displacement sensor angular sensitivity, 40 nrad , is dominated by intrinsic thermal noise. The pendulum motion is also monitored by a commercial autocollimator, with 50 nrad resolution for both twist and tilt modes, allowing calibration of the sensor by exciting large twist motion and purposefully tilting the apparatus by a few rad.
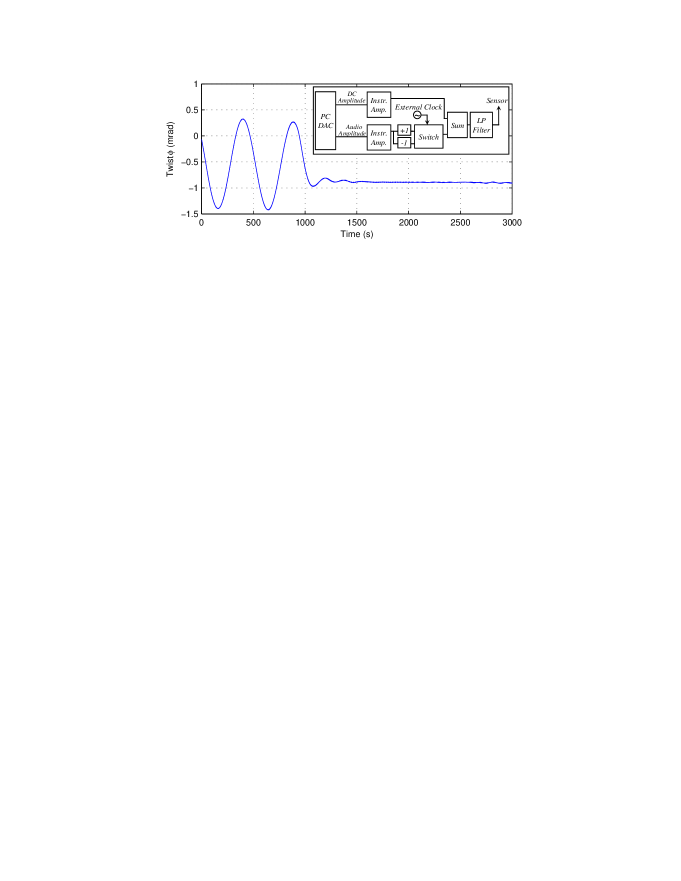
The facility is equipped with home-made electrostatic actuation circuitry that, as proposed for the LISA actuation scheme [3], is integrated with the sensor bridge electronics to apply audio frequency and DC voltages to the sensing electrodes. Audio voltages are used for PID control of the pendulum torsional mode (see figure 2), while DC biases are applied for electrostatic characterization of the sensor electrodes and to measure the test mass charge [6, 7]. It is worth noting that, as required for LISA, the electrostatic actuation circuitry does not add excess noise to the sensor sensitivity.
The pressure is kept below mbar by a vibrationally isolated turbo pump; use of an ion-pump has been avoided to prevent electrical charging of the test mass due to electrons coming from the pump itself. The measured net residual test mass charging rate, +1 per second, was occasionally balanced using electrons emitted by the hot cathode pressure gauge.
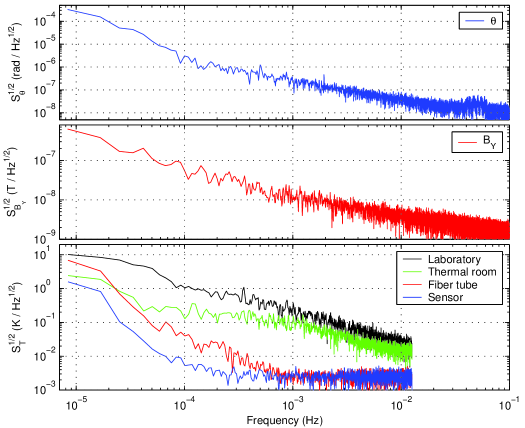
The entire experiment is enclosed in a thermally insulated room, whose temperature is controlled by a constant temperature water bath that stabilizes the air circulating inside a heat exchanger. The torsion fiber tube is covered with an additional layer of thermal shielding, giving higher temperature fluctuation suppression. As shown in figure 3, temperature fluctuations at the fiber tube are suppressed by at least a factor 20 between 0.1 and a few mHz, and by 10 below 0.1 mHz. The system is also useful for low temperature bake-out of the vacuum-chamber (60 ∘C), which reduces the thermally activated fiber drift from 1 mrad/h to 10 rad/h.
The facility is equipped to monitor different environmental variables. The sensor housing, electronics box, vacuum vessel, fiber tube, thermal room, and lab temperature are continuously monitored by Pt100 thermometers. The magnetic field is monitored by a three-axis 10 nT resolution flux-gate magnetometer, placed in the neighborhood of the pendulum. The capacitive sensor itself measures the platform tilt: a tilt of the apparatus along the axis () will cause a translation of the pendulum relative to the sensor along (), determined by the 1 m fiber length, . Most measurements are automated by dedicated software, and all experimental data and possible environmental noise sources are continuously recorded by a (in-house) data acquisition and control system.
3 Environmental disturbances
The torque sensitivity of a torsion pendulum is intrinsically limited by mechanical thermal noise with power spectrum [5, 8] and by the additive noise of the readout , which can be converted in an equivalent torque noise by the pendulum transfer function to give an overall torque sensitivity:
| (1) |
Here the torsion pendulum is characterized by the resonance frequency , the quality factor , the moment of inertia and the torsional spring constant , which for our experiment (see section 2) is 5 nN m/rad.
The pendulum instrumental limit (1), in particular the low frequency thermal noise ( 3 fN m at 1 mHz), puts an intrinsic limit on the resolution with which we can characterize stray forces for LISA. This can be far exceeded, however, by pendulum coupling to environmental noise sources. We address four key disturbance categories:
-
•
coupling to the laboratory floor tilt
-
•
magnetic field noise
-
•
temperature fluctuations
-
•
gravity gradient fluctuations.
The single test mass configuration, with a compact design and hollow test mass, makes the gravity gradient noise negligible. We characterize the other three disturbances by experiments in which the external source was modulated at a high enough level to induce a well resolved signal in the pendulum twist. The coupling to each disturbance term was estimated by the ratio of the induced torque to the magnitude of the input parameter. Monitoring the environmental noise levels under normal operation conditions, as shown in figure 3, permits an estimation of each systematic effect contribution to the overall torque noise, as summarized in figure 4.
3.1 ”Tilt-twist” coupling
Any tilt motion of laboratory floor can induce a torque on the pendulum through several mechanisms. To first order, the torque on the pendulum can be written as , where and are the tilt angles measured by the sensor itself, as discussed in section 2. The tilt-twist mechanisms include any position dependent torque induced by the capacitive sensor, or the known effect of linear cross-coupling of suspension point tilt into pendulum twist [9]. A high immunity from this effect can be gained by making the suspension point as symmetric as possible and employing the upper pendulum stage (see section 1).
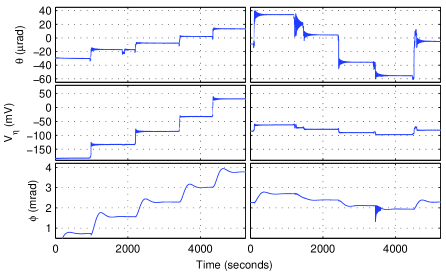
This coupling was measured by purposely tilting the apparatus and measuring the variation of the rotational equilibrium position (see Figure 5). From the DC fiber twist we can evaluate the induced torque to obtain the coupling coefficients and .
The tilt noise along the two horizontal axes was measured by the sensor, and we can estimate the tilt-induced stray torque to be111What we actually measured was the uncalibrated sensor voltage, , and coupling coefficient . However, the absolute angular calibration is not necessary, because .
| (2) |
This contribution, with observed couplings Nm/rad and Nm/rad, combined with measured tilt noise nrad at 1 mHz, is the dominant source of excess noise as shown in figure 4.
The measured tilt-twist coupling is considerably higher than those previously reported [9], and strongly directional along . Its origin is likely to be an electrostatic interaction between the mirror edges (covered by a dielectric coating), and the surrounding grounded surfaces of the end stoppers that prevent the test mass from hitting the capacitive sensor walls. An additional experiment, in which the sensor was translated along and with respect to the pendulum, produced the same coupling coefficients, confirming that the coupling is dominated by the relative pendulum-sensor motion, rather than cross-coupling in the fiber suspension point. In order to suppress this mechanism in future measurements, we are coating the entire pendulum (in particular the dielectric mirror) and all the surrounding surfaces with gold.
3.2 Coupling to magnetic field
The components of the residual magnetic moment of the pendulum in the horizontal plane couple with the local magnetic field to produce a torque ; as a consequence, the magnetic field fluctuations will induce a torque noise of order . In order to suppress this contribution, we used nominally non-magnetic materials for constructing the pendulum, and surrounded the experiment by a double -metal shield. The horizontal components of the magnetic moment were measured applying a = 200 mG sinusoidal magnetic field, generated by external coils. We then observed the coherent torque component in phase with the magnetic field. The measured twist angle was converted into torque to give the magnetic moment components = 120 5 nAm2 and = 40 2 nAm2, which are possibly due to a 1 cm long, 250 m OD steel tube used in the fiber attachment. The magnetic field noise measured along the horizontal axes is of order 20 nT at 1 mHz, inducing a torque noise at the level of several fN . This stray torque contribution, compared with the overall noise in figure 4, is just below the thermal noise level, and it could become a limiting factor once we have reduced the tilt-twist effect. We are thus modifying the fiber attachment point by employing a Cu tube, which is expected to give a smaller magnetic moment.
3.3 Temperature effects
Noise mechanisms arising from laboratory temperature fluctuations include modulation of the a) fiber equilibrium position (a pure “temperature-twist” coupling), b) apparatus tilt due to differential thermal expansion (which couples to pendulum motion as described in section 3.1), and c) gain of the readout electronics. In order to investigate the temperature-twist coupling, we modulated the air temperature inside the thermal enclosure at low frequency (0.5 mHz) while monitoring the coherent response of the pendulum twist. Referenced to the fiber tube temperature, we observed a coupling of 1 mrad/K at the modulation frequency. However, the interpretation of this coupling coefficient is made difficult by the entanglement of the various thermal effects and the different degree of thermal filtering associated with each thermometer. An alternative estimate of the temperature coupling was made by correlating the low-frequency pendulum twist and temperature data during a normal run. This analysis also produced ambiguous results that made impossible the extraction of a set of well-determined coupling coefficients for the individual thermometers.
4 Noise measurements
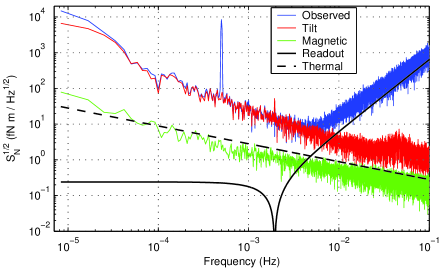
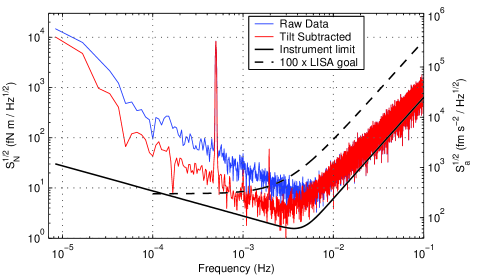
Figure 4 and figure 6 show the typical torque noise level , and the instrumental limit (1). The additive readout noise dominates at frequencies above 5 mHz, where the sensitivity of the apparatus is quickly degraded by the factor in the pendulum transfer function. At mHz frequencies, the torque noise is roughly a factor 10 higher than the thermal noise level. As discussed in the previous section and summarized in figure 4, the excess is dominated by the tilt-twist contribution.
In order to improve our estimate of the low frequency, position-independent random forces introduced by the sensor (based on the study of torques on the suspended test mass), we subtracted the effect of coupling to floor tilt from the raw experimental data. The correction is performed by measuring the components of the tilt, and then converting them into a torque by means of the measured tilt-twist feedthroughs. The instantaneous coupling torque, Fourier transformed into the frequency domain, is then converted into a twist angle through the torsion pendulum transfer function . The calculated twist is converted back into the time domain to be subtracted from the raw angular time series. This does not involve a subtraction of noise spectra, but only a time series subtraction based on calculation of the instantaneous torque. The Fourier transform is used only to convert the calculated torques into twist angles, accounting for the torsion pendulum transfer function. The meaning of the subtraction is also checked by comparing the tilt measured with the sensor with the output of the optical autocollimator, in order to verify that the subtracted signal is a real apparatus tilt motion, rather than a “fake” displacement signal coming from the sensor itself.
The tilt correction procedure, whose results are compared with the raw data in figure 6, leaves a torque noise which is only a factor 3 to 5 over the thermal noise in the mHz region, and in particular below 20 fN m between 0.3 and 10 mHz, with a minimum of 4 fN m at 3 mHz. The excess noise observed below 0.3 mHz is likely dominated by temperature fluctuations, although for the reasons described in section 3.3, we did not perform any subtraction of temperature effects.
5 Force noise for LISA
The torque noise floor of the pendulum can be converted into differential force noise, allowing us to place an upper limit on the stray forces (and accelerations) exerted by the sensor on the suspended test mass. In order to translate the results for the pendulum torque noise into stray acceleration for the envisioned LISA sensors, we should take into account these constraints:
-
•
The torsion pendulum described here was designed to reach high sensitivity for surface forces, which are expected to be the most dangerous and unknown disturbance sources for capacitive LISA gravitational sensors [3]. We employ a hollow test mass, which is largely immune to bulk magnetic or gravitational effects, and allows us to increase the torque sensitivity with a thinner fiber [5].
-
•
The torsion pendulum is highly isolated from net forces, generated, for example, by linear field or temperature gradients [2]. A future pendulum with multiple test masses, displaced from the fiber axis, in order to gain a significant conversion between linear (force) effects and measured angular twist, will be built.
- •
The conversion between the estimated torque noise, , and force, , for the noise sources under consideration involves the definition of an effective armlength , which depends on the nature of the source. For back action forces generated by down conversion of 100 kHz sensor noise mixing with the readout excitation, or by beating between stray DC bias and low frequency voltage noise [3, 7], the only non zero contributions to the instantaneous force on the test mass along and torque around the fiber axis come from the electrodes facing the test mass. Within the infinite wedge approximation we have and , where is the test mass - electrode gap, is the capacitance formed by each electrode with the centered test mass, and (the 1/2 electrodes separation, see figure 1) is the ratio between the dispacement and angular derivative of capacitances. Thus, for these effects related to the readout and actuation circuitry, = 10.25 mm, and the upper limit can be set at 1.5 pm in the frequency range 0.3 to 10 mHz, when referred to a bulk LISA test mass of the same size. For forces generated by any homogeneously distributed forces acting perpendicularly to the test mass surfaces, such as noisy patch charges, the relevant armlength is related to the test mass edge length by 16.3 mm, where the integral is an average square radius, and the factor accounts for the additional torque contributed by the surfaces. For random inelastic molecular impacts, the correct conversion is mm, and the torque noise levels can be converted into a minimum acceleration noise below 200 fm at 3 mHz. As shown in figure 6, this limit corresponds to roughly a factor 70 over the LISA flight goal, and a factor 7 over the LTP flight test goal [4].
6 Conclusions
The experimental campaign we described here was brought to a natural conclusion after six months of continuous operation when the fiber attachment failed. Currently, the apparatus is being enhanced in order to overcome the sources of coupling to the environmental noise sources we singled out during the previous run, including a few functional upgrades. A motorized rotating stage will allow modulation of the sensor rotation angle , thus characterizing the entire spring-like coupling between the test mass and the sensor, including any gravitational contribution. A set of optical fibers carrying UV light will be used to control the test mass charge [10], and a pattern of heat exchangers will be used to investigate thermal-gradient-related effects.
In addition, we are replacing the gold-coated torsion fiber with one of bare W, to increase the quality factor, and thus decrease the thermal noise. In combination with the increased immunity from environmental systematic effects, we will be able to characterize LISA sensors with higher sensitivity.
References
References
- [1] P Bender et al2000 LISA ESA-SCI(2000)11 System and Technology Study Report
- [2] R Dolesi et al2003 Class. Quantum Grav. 20 S99
- [3] W J Weber et al2002 SPIE Proc. 4856 31
- [4] D Bortoluzzi et al2003 Class. Quantum Grav. 20 S89
- [5] M Hueller et al2002 Class. Quantum Grav. 19 1757
- [6] L Carbone et al2003 Phys. Rev. Lett.91 151101
- [7] W J Weber et al, to be published, 2003 Advances in Space Research (Preprint gr-qc/0309067)
- [8] P R Saulson 1990 Phys. Rev. D 42 2437
- [9] G L Smith et al1999 Phys. Rev. D 61 022001
- [10] Y Jafry et al1996 Class. Quantum Grav. 13 A97