Gravitational Wave Detectors: A report from LIGO-land 111This work is supported by the National Science Foundation, with grant PHY-0135389.
Abstract
At the time of this conference, in June 2002, The LIGO Science Collaboration was getting ready to perform its first Science Run, where data will be taken with all three LIGO detectors. We describe here the status of the LIGO detectors as of February 2003, their performance during the “Engineering Run” E7 (Dec 28’01-Jan 14’02) and subsequent Science Runs in 2002/3. We also describe ongoing efforts on data analysis for setting upper limits of different gravitational wave sources.
1 Introduction
The LIGO project has two Observatories, in Hanford, Washington and Livingston, Louisiana; each housing km-long interferometric gravitational wave detectors. There are twin detectors, 4km long each, in Livingston and Hanford; in Hanford the project also has a 2km long detector living in the same vacuum system.
The LIGO Science Collaboration consists now of 33 institutions, from all five continents. There are about 450 collaborators, working on commissioning the present LIGO detectors, preparing for data analysis and testing it on preliminary data, and doing research and development on techniques for improving the detectors in the near future.
As of June 2002, all three LIGO detectors were working in their final configurations, and they were about to start the first Science data taking run. The sensitivity of the detectors was still far from the one ultimately expected, limited by fundamental noise sources. However, the preliminary data provides an opportunity for careful diagnostics of noise sources, and for greasing the wheels of the data analysis machinery that will be used. Some of these techniques were used to analyze the data from the “E7” Engineering Run, from December 28, 2001 to January 14, 2002.
We will describe in this article the basics of the signal detection scheme used in the LIGO detectors, and present preliminary results from the analysis on E7 data.
2 Interferometric gravitational wave detectors
There are now several interferometric gravitational wave detectors expected to begin taking data in the next couple of years: GEO600 [2] is a German-British collaboration; VIRGO [4], a French-Italian collaboration; LIGO[1], an US project where the science is managed by an international collaboration; and TAMA300[3], a Japanese project; ACIGA, an ACIGA, an Australian project. TAMA300 has already been taking data. All of these detectors differ in dimensions, expected sensitivities, and configurations, but they all share the basic idea of using laser optical interferometry, Pond-Drever detection scheme and suspended mirrors to detect the small effects produced by gravitational waves on Earth.
The configuration of the LIGO detectors is that of a power recycled Michelson interferometer with Fabry Perot arms, as described in [1]. The arms of the Michelson interferometer are 4km long, and the optical cavities in each arm have a finesse of about 100. The power recycling cavity has a finesse of 30. The laser used is a 6W NdYag Lightwave NPRO, with a wavelength of 1.064 m. The frequency of the light is first stabilized outside the vacuum system with respect to the length of a reference cavity, and then using a solid pre-mode cleaner. In vacuum, the gaussian beam is further stabilized in spatial mode and frequency stability by a triangular suspended mode cleaner.
A power-recycled, Fabry Perot interferometer has four degrees of freedom that need to be controlled so that the optical cavities are resonant. Two of these are the length of the resonant arms, and the light sensed at the antisymmetric and reflected port is used to generate control signals for the difference and sum of the arm lengths. The signal at the antisymmetric, or “dark” port, which is proportional to the difference of the arm lengths, is the one most sensitive to gravitational waves.
The other two degrees of freedom to be controlled are the recombination at the beamsplitter to keep the antisymmetric port dark, and the length of the recycling cavity to keep the optical cavity resonant. The signals for these degrees of freedom are sensed in a secondary reflection picked off from the beamsplitter mirror, or one of the input test masses in the arm cavities.
In all cases, the signals are first generated using a 25 MHz phase modulation frequency in th e-input laser light, and then demodulating the photocurrents in each of the three sensed beams, using the “Pond-Drever” sensing scheme. The linearity of the signals with respect to the desired degrees of freedom require that the signals are held very close to zero, or oscillating by a small fraction of the wavelength, divided by the cavity finesse, . When this is achieved, it is said f that the interferometer is “locked”.
For the arm length difference, we require the test masses to be held in position to meter within the resonance of the optical cavities. This level of control has now been achieved in all three LIGO detectors. The LIGO detectors are expected to be sensitive to fluctuations in the difference of arm lengths of about m, if happening at frequencies between 50Hz and 4 kHz.
When the suspended mirrors are not being controlled, they are swinging through more than one wavelength, so the signals at the photodiodes are very non-linear. An end-to-end model of the electromagnetic fields was used to interpret the signals at the photodiodes when the interferometer is not locked. Using the results of this modeling, a digital program calculates “on the fly” (at a rate of 16 kHz) the appropriate forces to send to the mirrors and lock the interferometer.
As of June 2002, all three LIGO interferometers can lock in the full recycled mode. However, anthropogenic and natural sources of seismic noise have a big impact on duty cycle. The mirrors are pushed around by coils acting on magnets glued to the mirrors’ back surface; these systems have a small dynamic range and sometimes, they cannot apply the necessary forces to move the mirrors far enough to cancel the motion of the ground. There are massive, passive seismic isolation systems installed in the vacuum system to reduce the seismic noise in the gravitational wave band, however these systems have resonances and in fact amplify the ground motion at some frequencies. The ground motion at low frequencies is largest in the Livingston Observatory, where logging happens nearby. Several active systems are now being used to improve this situation, and a more sophisticated version close to what was planned for Advanced LIGO will be installed in 2003.
3 Data Taking Runs
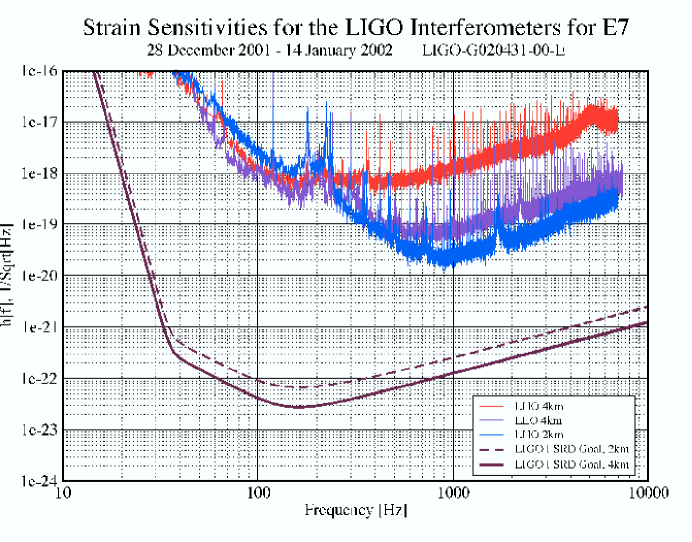
Several “Engineering Runs” were done to assess the performance of the LIGO detectors and test the software tools used for searching gravitational waves. Four groups were created within the LIGO Science Collaboration, each one looking at methods for searching gravitational waves of different kinds: Stochastic Background, Continuous Periodic Waves, Burst Sources and Inspiral Signals. The last Engineering Run before this conference, “E7”, took place between Dec 28, 2001 and January 14, 2002. The three LIGO detectors were in operation, and data was also taken in coincidence with the GEO600 detector in Hannover, Germany, and the ALLEGRO bar detector in Louisiana State University, USA (50 km away from the LIGO Livingston detector). Although the data quality for the interferometric detectors was far from the expected sensitivities when the undergoing commissioning is finished, a lot was learned from this data taking run. The duty cycles measured are detailed in Table 3. The sensitivities of the LIGO detectors are shown in Fig.1.
The LIGO H1 interferometer (4km long in Hanford, Washington), had achieved a stable lock only a few days before the data taking run started, so even though its sensitivity was lagging behind the other LIGO detectors (L1, 4 km long at Livingston, and H2, 2km long at Hanford), it was the first time that all three LIGO detectors were running in coincidence. The 2km Hanford detector, H2, started to suffer problems to stay locked during the latter part of the run, the duty cycle at the end of the run was much smaller than in the beginning. The Livingston detector, L1, was operated in an intermediate configuration, where the arm cavities were “recombined”, but power recycling was not used. This configuration is in principle limited by a worse shot noise limit at high frequencies, since it has less circulating power, but other noise sources were still dominating the noise budget. Some of the known noise sources were spurious forces introduced by angular motion controllers; thermal noise at sensing photodiodes; frequency noise in the input light to the interferometer; acoustic vibrations of input periscopes; etc. All the noise sources dominating the LIGO spectra at the time were identified and suppressed; the sensitivity of all three detectors at the time of writing this article (February 2003), is only a factor of a few to ten times above the design sensitivity, and ten to a hundred times better than the noise figures plotted in Fig1.
Hours of useful locked time and duty cycles of detectors participating in the E7 data taking run. LIGO detectors LIGO and GEO L1 and ALLEGRO Recorded time: 408 hrs 334 hrs 222 hrs Single L1: 249 hrs (62%) L1: 197 hrs (59%) L1: 91 hrs (41%) detectors H1: 231 hrs (57%) H1: 109 hrs (63%) ALLEGRO: 165 hrs (74%) H2: 157 hrs (39%) H2: 109 hrs (32%) GEO: 211 hrs (63%) Coincidence 72 hrs (18%) 26 hrs (8%) 78 hrs (35%)
A figure of merit derived from the noise spectra is the maximum distance from which a signal from an optimally oriented binary neutron star system could be detected with a signal-to-noise ratio of 8. This number varies with the quality of the mirror alignment in the interferometers, but it was in average 0.8 kpc in H1, 3.5 kpc in L1 and 11 kpc in H2.
A significant amount of attention was devoted to looking into auxiliary channels to find correlations with apparent signals in the gravitational wave channels. In L1, it was found that a channel indicating laser amplitude fluctuations showed a a very important correlation with the gw signal; it was consequently used as a “veto” channel. In H2, the detector with best sensitivity, it was found that many time s after locking, and sometimes during locked times, vibrations of the “violin” modes of the suspension wires were excited by the control system. A tool was developed to calculate the power in a small frequency band containing the frequencies of the violin modes, and when this power exceeded certain threshold, the data was considered to be vetoed. The exercise of studying the signals in detail, and finding the origin of the obvious instrumental artifacts, was one of the most useful lessons learned from the E7 data analysis.
The GEO600 detector was also operated in coincidence with the LIGO detectors during E7. It was also operating with a different configuration than designed: it used power recycling but not signal recycling. The GEO detector had the best duty cycle of all interferometers, it improved to an amazing 98-99% by the final days of the run.
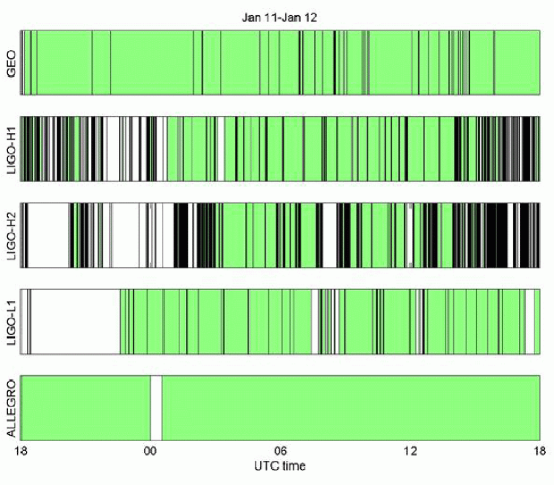
The ALLEGRO resonant detector operated during the last week of E7, from January 7 to January 14. It made use for the first time of its ability to rotate orientations; it started operating aligned with the International Gravitational Event Collaboration (IGEC)[5], then rotated to align the bar with the X-arm of the LIGO Livingston detector on January 11; and then on January 12 to a direction at 45 degrees with both X and Y arms of the LIGO LLO detector. This strategy allows for a comparison of the signals correlations in an ON/OFF state for searches of stochastic background [6] .
A plot of the ON/OFF status of all five detectors participating in E7 is shown in Figure 2.
4 Note added in Proof
At the time of writing this article, data from the first science run (August 23-September 9, 2002) is being analyzed. The S1 run was also in coincidence with GEO, although not with ALLEGRO. The data showed considerably improvement with respect to E7: the LIGO detectors were now sensitive to binary inspiral neutron star systems in the galaxy, at distances between 50 kpc (H2) and 150 kpc (L1). This range allows a fine survey of the galactic source with coincident detectors. There were 96 hours of triple coincidence time, and 131 hours of double coincidence between L1 and H1. The duty cycle was again limited by daytime seismic noise limiting the LIGO Livingston detector locking ability. The analysis done by the four upper limit groups shows very promising results, including the efficient use of two detectors on line for stochastic background, and burst and inspiral sources.
In February 2003, a second Science run, to be 60 days long, has started, again with improved sensitivities with respect to S1: the LIGO Hanford detectors are bot now sensitive to inspiraling binary neutron stars at 600 kpc (H1), 400 kpc (H2) and 1.5 Mpc (L1). With these ranges, the Large Magellanic Cloud can be “seen” with triple coincidence, and for the first time, an interferometric detector will be sensitive to sources in the Andromeda Galaxy.
5 Conclusions
The LIGO interferometers are all operating, with a sensitivity getting closer to the designed one at a fast pace. By the time of the NEB-X conference, an important threshold in operations had been crossed, with data being taken in all three LIGO detectors, in coincidence with GEO and ALLEGRO; and another threshold was being crossed, glancing at Andromeda with a gravitational wave detector for the first time. The rapid progress of the instruments’ performance is promising a good start of a new era of gravitational wave astronomy.
References
- [1] Barish, B. and Weiss, R., Phys. Today 52, 44-50 (1999).
- [2] B Willke et al., Classical and Quantum Gravity 19, 1377 (2002).
- [3] M Ando et al., Classical and Quantum Gravity 19, 1409 (2002).
- [4] F Acernese et al., Classical and Quantum Gravity 19, 1421 (2002).
- [5] Astone et al., (IGEC Collaboration)Methods and Results of the IGEC search for burst gravitational waves in the years 1997-2000, submitted to Phys. Rev. D, available in http://igec.lnl.infn.it/ (2003)
- [6] L.S. Finn, A. Lazzarini, Phys Rev D64,082002 (2001)