Mechanical Loss in Tantala/Silica Dielectric Mirror Coatings
Abstract
Current interferometric gravitational wave detectors use test masses with mirror coatings formed from multiple layers of dielectric materials, most commonly alternating layers of SiO2 (silica) and Ta2O5 (tantala). However, mechanical loss in the Ta2O5/SiO2 coatings may limit the design sensitivity for advanced detectors. We have investigated sources of mechanical loss in the Ta2O5/SiO2 coatings, including loss associated with the coating-substrate interface, with the coating-layer interfaces, and with the bulk material. Our results indicate that the loss is associated with the bulk coating materials and that the loss of Ta2O5 is substantially larger than that of SiO2.
pacs:
04.80.Nn, 95.55.Ym, 62.40.+i, 68.35.GyI Introduction
The sensitivity of designs for advanced interferometric gravitational wave detectors, such as Advanced LIGO (Laser Interferometer Gravitational Wave Observatory), is limited in the frequency range from 10’s to 100’s of Hz by thermal noise from the main test masses and their suspensions AdvDesign . These test masses, which under current design plans will be formed from either fused silica or sapphire, will each be supported using a fused silica suspension, and will have multi-layer, dielectric mirror coatings whitepaper . In the current generation of gravitational wave detectors, the test mass mirror coatings are formed by ion-sputtering alternating layers of silicon dioxide (SiO2) and tantalum pentoxide (Ta2O5). This type of coating was chosen because it can be made highly reflective in a narrow band around 1.064 m, the laser wavelength chosen for LIGO, while having very low absorption and scatter losses CurrentCoatings .
For the past several years, many research groups in the gravitational wave field have been concerned that dielectric coatings could be an important source of thermal noise. This concern was strengthened by Levin’s calculation Levin which indicated that mechanical losses in the mirror surface of a test mass could be much greater than had been generally appreciated. Subsequently, our investigations of mirror coatings showed that multi-layers of Ta2O5/SiO2 and Ta2O5/Al2O3 when applied to fused silica substrates, add significant levels of mechanical loss Crooks ; Harry02 . Using these results and models developed by Nakagawa Nak02 , and Gretarsson Harry02 , we calculated that mechanical loss in the coatings would result in a level of thermal noise which would degrade the design sensitivity of the planned advanced detectors by a significant amount.
In the present study, we have performed a series of experiments to investigate the source of the loss in multi-layer tantala/silica coatings. We hypothesized that the loss would arise primarily either from the coating-substrate interface, from the coating-layer interfaces, from the bulk materials used in the coatings, or possibly from some combination of these sources. We have measured the loss of a series of coatings in which the number and thickness of the coating layers was chosen to test each of these dependencies.
II Design of coating loss study
II.1 Experimental technique
As in our previous experiments Crooks ; Harry02 , we determine the level of mechanical loss associated with a given coating by applying the coating to fused silica substrates and measuring the mechanical losses of a subset of resonant modes of the coated samples.
The mechanical loss, , at a resonant frequency of a sample, is related to the quality factor, of the resonance by . Assuming all other losses to be negligible, the total loss in a coated sample, , is equal to the sum of the intrinsic loss of the substrate plus any loss associated with the coating Crooks ; Harry02 ,
| (1) |
where is the ratio of energy stored in the coating to energy stored in the substrate.
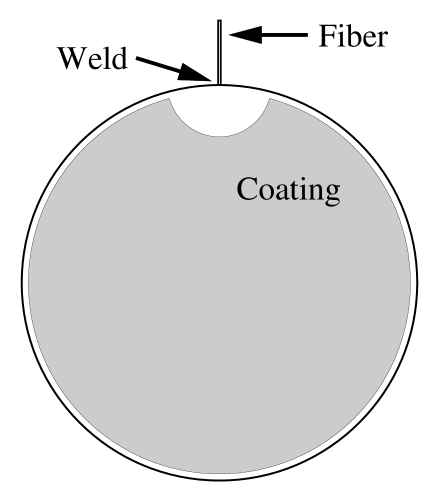
In this study, the substrates were 7.6 cm diameter fused silica disks of two different thicknesses, 2.5 cm and 0.25 cm. The thinner disks had the advantage that the effect from the coating was more pronounced; the coating loss had a greater contribution to the total loss because the energy ratio, , was larger for the thin samples. However suspending these thin samples required the direct welding of a low loss silica suspension to the edge of the fused silica substrates, see Harry02 . To minimize any potential damage to the coatings by direct heat from welding, the coating was masked in a 1 cm radius around the weld, see figure 1. In addition, we used miniature welding torches that allowed the weld area to be sub-millimeter in scale. During welding, the glass cm from the weld remained only warm to the touch, which suggests that there was little to no impact on the coating. Although measurements of the loss factors of the thicker samples were less sensitive to the effects of coating losses, they had the advantage that they could be suspended using thin silk thread, see Crooks , without any risk of physically altering the substrate or the coating.
The use of both techniques allowed a more thorough investigation of mechanical losses in the coating over a wider range of frequencies SneddonRowan .
The substrates were made of Corning 7980 grade 0A fused silica Corning . Their faces were polished to sub-angstrom micro-roughness by Wave Precision Inc. WavePrecision , to emulate the required surface properties of actual test masses. Except where otherwise noted, all the coatings were applied by SMA/Virgo SMA at l’Institut de Physique Nucleaire in Lyon France.
To measure the quality factor of a given mode of a sample, we suspend the sample in vacuum and excite it to resonance using an electrostatic drive. We then remove the excitation signal and record the sample’s motion as it freely rings down. The characteristic decay time, , is the time required for the amplitude of motion to decrease by a factor . The quality factor is then given by . The amplitude of the resonant motion was sensed interferometrically for the thick ( cm) samples, and by polarimetry for the thin ( cm) samples. At the vacuum pressure for the experiment, ( torr), air damping was negligible. Detailed descriptions of these ringdown techniques are given in Crooks and Harry02 respectively.
We performed finite element analysis, with the program ALGOR ALGOR , to model the displacement of each mode of the samples. The relevant energy ratios for the coated samples were then calculated from the displacements Crooks . If the intrinsic mechanical loss of the substrate, , is known (or is insignificant compared to the effective loss from the applied coating), the loss associated with the coating may then be calculated using eqn. 1.
| Sample | Total | Optical Thickness | ||
|---|---|---|---|---|
| Type | Layers | SiO2 | Ta2O5 | Comments |
| A | 0 | 0 | 0 | Annealed only |
| B | 2 | Coated & annealed | ||
| C | 30 | Coated & annealed | ||
| D | 60 | Coated & annealed | ||
| E | 30 | Coated & annealed | ||
| F | 30 | Coated & annealed | ||
II.2 Sequence of coatings studied
We investigated three primary sources of mechanical loss in the coatings, which we postulated to be:
-
•
loss in the coating-substrate interface,
-
•
loss in the interfaces between the multiple coating layers, and
-
•
loss in the bulk coating materials.
To investigate these hypotheses, we designed a set of coatings in which we varied the number and thickness of the coating layers to test for the three dependencies. Table 1 lists the coatings and the substrate treatments investigated. By comparing the measured mechanical loss for sample types B through F, we can test our three hypotheses for the source of the coating loss.
If the dominant source of coating mechanical loss is associated with the coating-substrate interface, then the total loss measured for sample types B -F would be expected to be approximately equal.
On the other hand, the loss may have originated predominantly in the interfaces between the multiple coating layers. In that case the coating loss of sample type D, which has 60 layers, should be twice as large as the loss in sample types C, E and F which have 30 layers.
Finally, the source of dissipation may be intrinsic to the bulk coating material. Under that scenario, the coating loss for sample types C, E, and F should vary with the abundances of the two coating materials.
Clearly there also exists the possibility that the total mechanical loss of the coating is the sum of contributions from a combination of the above mechanisms.
As part of the coating process, samples are heated to a few hundred degrees to reduce residual stresses in the coating. Previous experiments Numata ; Lunin ; Penn have shown that heating uncoated fused silica samples can result in a significant decrease in loss. Coating Type A was not coated but was cleaned and heated to the same elevated temperature as the coated samples to ensure any change in substrate loss was taken into account in our analysis. We will refer to this process as “annealing” even though the samples were not raised to the standard annealing temperatures for fused silica.
| Sample | Butterfly mode | Butterfly mode | Drumhead mode | Coating Thickness | ||||||||
|---|---|---|---|---|---|---|---|---|---|---|---|---|
| Type | Number | (m) | (m) | |||||||||
| A | 1 | 14.7 | N/A | 11.7 | 43.6 | N/A | Uncoated, Annealed at C | |||||
| A | 2 | 10.6 | 42.4 | N/A | 13.9 | 54.0 | N/A | Uncoated, Annealed at C | ||||
| B | 1 | 24.2 | 9.0 | 2.4 | 25.2 | 8.0 | 2.7 | 0.183 | 0.131 | |||
| B | 2 | 6.32 | 5.4 | 4.0 | 7.53 | 6.5 | 3.3 | 6.4 | 3.2 | 0.183 | 0.131 | |
| C | 1 | 18.4 | 0.53 | 2.7 | 20.8 | 0.55 | 2.6 | 2.75 | 1.97 | |||
| C | 2 | 23.1 | 0.53 | 2.7 | 18.6 | 0.54 | 2.6 | 0.43 | 3.1 | 2.75 | 1.97 | |
| D | 1 | 17.3 | 0.49 | 2.9 | 20.4 | 0.55 | 2.6 | 0.44 | 3.1 | 2.75 | 1.97 | |
| D | 2 | 0.54 | 2.6 | 43.6 | 0.51 | 2.8 | 2.75 | 1.97 | ||||
| E | 1 | 42.4 | 0.40 | 3.9 | 54.0 | 0.40 | 3.9 | 0.29 | 5.1 | 1.38 | 2.95 | |
| E | 2 | 22.2 | 0.40 | 3.9 | 20.3 | 0.41 | 3.8 | 1.38 | 2.95 | |||
| F | 1 | 0.75 | 1.8 | 0.72 | 1.8 | 4.13 | 0.983 | |||||
| F | 2 | 1.13 | 1.2 | 0.82 | 1.6 | 0.63 | 2.0 | 4.13 | 0.983 | |||
III Results
III.1 Thin Sample Results
We present below the results of our measurements on the thin samples. We acquired at least five measurements for each mode of a given sample configuration. As is common in experiments, we quote the result of the highest measurement. The reason for this selection process is that systematic errors, which in many experiments can equally increase or decrease one’s measurement, will, with rare exception in our measurements, uniformly degrade the . On the other hand, the statistical errors contribute a uniform, Gaussian background that introduces an error to the fit of . Data that does not exhibit uniform background noise is discarded. These statistical errors are normally much smaller that the systematic fluctuations. Therefore we quote the largest value for our measurements with its associated statistical error.
The suspension system, excitation system, and data analysis routines have all been tested to produce no limiting effect on measurements where the exceeds 80 million. During these measurements, the dimensions of the suspension system and the position of the excitation system were altered with no observed change in the of the sample. Finally these measurements were performed at MIT and at Syracuse University with excellent agreement between the two facilities.
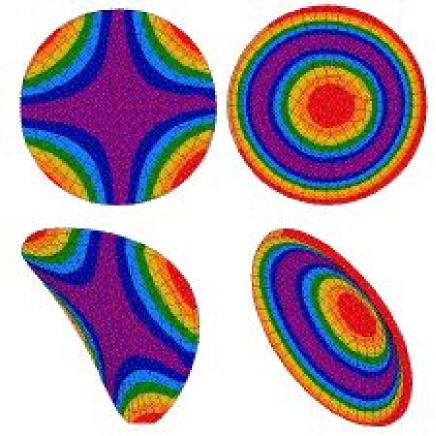
The results are listed by mode in Table 2. The mode shapes are shown in Figure 2. The Butterfly- and Butterfly- modes are the degenerate first mode with a typical resonant frequency of kHz. The additional notation of “” and “” refer to the orientation of the nodal lines. The second mode, known as the drumhead mode, has a typical resonant frequency of kHz.
One immediate observation from the data is that for the coated samples, with the exception of the 2-layer coating, . Typical values for indicate that the loss in the substrate is about 2–3% of and should not significantly affect the results for the coating loss. Moreover, we see that the annealing performed at the end of the coating run dramatically increases the of an uncoated substrate. If we assume that the substrate in a coated sample also experiences the same increase in , then the loss in the substrate is reduced to about 1% of the loss in the coated sample. Thus, for the thin samples, we assume the loss measured in a coated sample is approximately the loss associated with the coating.
| (2) |
To calculate the coating losses we require the fraction of the mode energy stored in the coating. This value is calculated from the displacement values obtained using finite element analysis package, ALGOR ALGOR . This analysis yielded an energy ratio per coating thickness of
Then, given the coating thickness, , we can rewrite the equation for as
| (3) |
The coatings are made such that the first layer applied to the substrate is a tantala layer. We convert a coating’s optical thickness to its physical thickness using the refractive indices and .
Reviewing our results, listed in Table 2, we can test our hypotheses on the source of the coating loss. The first hypothesis was that the coating loss originated in the coating-substrate interface, in which case the loss would be independent of coating thickness. Were this idea true, then coating types B and C, which have 2 and 30 layers respectively, would have similar values for . Instead, for these samples differ by a factor 10, and the coating loss, , which is scaled for coating thickness, is roughly equal for the two coating types. Thus the loss is in the coating, not the coating-substrate interface.
Our second idea was that the coating loss arose in the interfaces between the multiple coating layers. To test this hypothesis we can compare the loss for coating types C and D, which have the same total thickness but 30 and 60 layers respectively. If the loss were dependent on the number of coating interfaces then for coating types C and D would differ by a factor 2. However, coating types C and D have similar values for , indicating that the loss does not depend on the number of coating interfaces.
Finally if the loss originates in the bulk coating material, then we would expect to see a dependence in as the proportions of coating materials are varied in coating types E, C, and F. Indeed does increase with increasing proportions of Ta2O5, indicating that the loss is due to the bulk coating materials.
To separate into the losses for the two coating materials, we must partition the energy in the coating into the amounts stored in its silica and tantala layers. Following an analysis by Landau and Lifshitz LaundauLifshitz , it can be shown that, for Poisson’s ratio, , the energy stored in a coating, , where is Young’s modulus and is the coating thickness. For a multi-layer coating made up of two materials, we may write:
| (4) |
where , and are the Young’s modulus, total thickness and loss angle of the coating material. We use the Young’s moduli of Pa for fused silica and Pa for tantalum pentoxide Martin .
For a thin surface layer, the stress will be predominantly parallel to the surface. In this limit, the total Young’s modulus for the multi-layer coating is given by
| (5) |
Fitting the results for from coating types C, E, and F, we obtain the bulk loss values for silica and tantala
As a final consistency check, we measured two samples with coating type C that were coated by MLD MLD . These measurements yielded for the butterfly mode, and for the drumhead and 2nd butterfly modes. These results are in basic agreement with the samples coated at SMA/Virgo SMA and indicate that the coating loss is associated with the materials and not the coating process or manufacturer.
III.2 Thick Sample Results
III.2.1 Initial observations
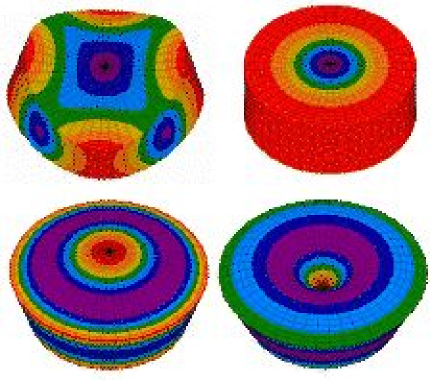
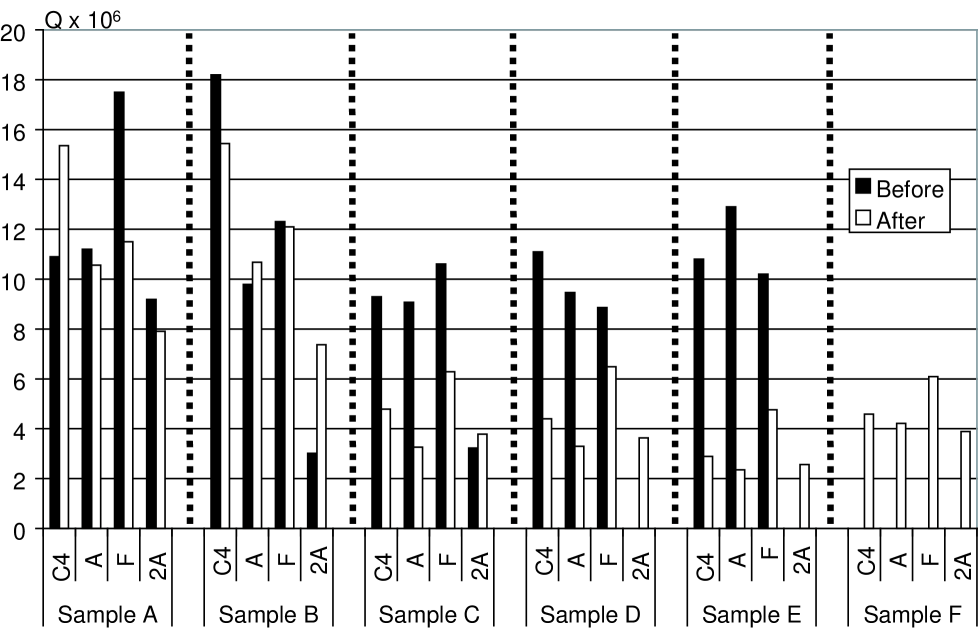
For the thick fused silica samples (7.6 cm cm thick), we measured the factors of 4 modes both before and after each sample was coated or annealed. The results of these measurements are shown in figure 4. The mode shapes, which were calculated using a finite element package ALGOR , are shown in figure 3.
We suspended the thick samples in a loop of silk thread. Each sample was suspended multiple times, with the suspension length varied each time, and the highest factor for each mode was used in our analysis. Previous experiments Braginsky ; Logan ; Rowan have shown that measured factors may be too low if the resonant frequency of a test mass happens to coincide with a resonant frequency of the suspension wires. Using this technique we have shown that suspension losses can be reduced to a negligible level when measuring ’s of the order of a few times Crooks .
Before discussing the quantitative analysis of the results, it is instructive to observe the trends in the data shown in figure 4. Firstly, it can be seen that the factors for sample A, which was annealed, and for sample B, which had a 2-layer coating, were very similar, and that these factors were considerably higher than the other samples which had thicker coatings. This difference indicates that the coating-substrate interface is not the dominant source of mechanical loss.
Secondly, samples C and D, which have the same total coating thickness, but 30 and 60 coating layers respectively, have very similar factors. This result suggests that the individual multi-layer interfaces are not the dominant source of mechanical loss.
Finally, the coatings on samples C, E, and F each have 30 layers and the same total thickness, but vary the proportions of SiO2 and Ta2O5. The measured ’s show that the loss increases with increasing proportions of Ta2O5 in the coating. These results suggest that the bulk coating materials are the dominant source of mechanical loss in the coatings, and that tantalum pentoxide has a higher mechanical loss than silica.
These observations are all consistent with the trends seen in the thinner samples discussed in section III.1.
It is important to note that the measured factors for the samples are mode-dependent. This dependence will be discussed in the following section.
III.2.2 Quantitative analysis
Calculating the coating loss for the thicker samples requires a slightly different method than for the thin samples. For the thin samples, the loss in the substrate was negligible, so the coating loss could be calculated directly from the measured loss in the coated sample. For the thick samples, a much smaller fraction of the energy was stored in the coating. Thus the loss in the substrate must be considered when calculating the loss in the coating.
For each mode of a thick coated sample, we calculate the energy ratio . We then rewrite eqn. 1 as:
| (7) |
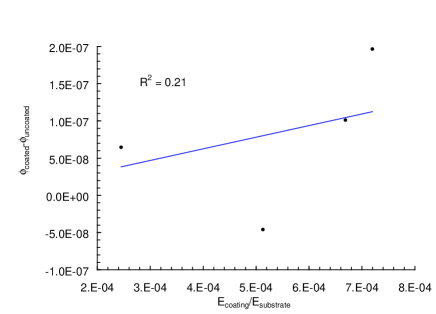
To obtain , we plot versus for each mode. Figure 5 shows this plot for one sample with thirty alternating layers of SiO2 and Ta2O5. It can be seen that the data appears far from the expected straight line.
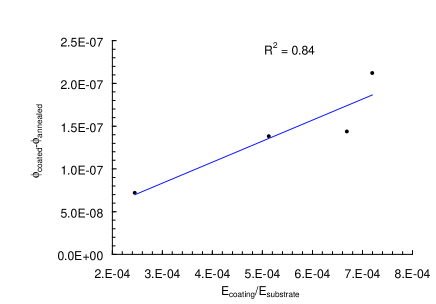
From Figure 4 it can be seen that there were significant changes in the factors of modes of a sample which was annealed but not coated. The ’s of some modes increased while others decreased. In our case, the mechanism for changes in is not known but we postulate it may be due to some redistribution of stress in the samples, which may produce mode-dependent losses Numata . Thus while using the measured values for the of the uncoated substrate seems invalid, replacing these values by the factors of the modes of the annealed, but uncoated mass, should in principle now allow us to obtain a value for . The results of this are shown in figure 6.
It can be seen that there is a significant improvement of the fit to the data using this analysis. Carrying out the same types of analyses on the data from the other coated samples gave very similar results.
III.2.3 Results
The loss factors obtained for each type of coating studied are shown in table 3.
| Coating Type | Number of Samples | |
|---|---|---|
| B | 1 | |
| C | 2 | |
| D | 2 | |
| E | 2 | |
| F | 2 |
The results shown in table 3 confirm our earlier observations indicating that the dominant source of mechanical loss is associated with the bulk coating materials, and also confirm that the tantalum pentoxide component of the coatings has a higher mechanical loss factor than the silica component. This last deduction can be treated more quantitatively.
As with the thin samples, we use eqn. 6 and the results for from coating types C, E, and F, to calculate the loss for the silica and tantala layers. The results are:
We also performed a consistancy check on the thick samples by measuring two samples that had coatings of type C applied by MLD MLD . The measured coating losses were for sample 1, and for sample 2. Like the thin samples, the thick samples yielded similar results for the two coating manufacturers. In both cases the coatings from MLD MLD showed slightly higher loss than the equivalent coatings produced by SMA/Virgo SMA .
IV Conclusions
For advanced interferometric gravitational wave observatories to be able to
reach realistic astronomical distances, low mechanical loss mirror coatings are
necessary. Observatories currently in operation use a multi-layer dielectric
coating of silica and tantala. We have measured the loss in this coating to be
, which is in basic agreement with the results from our previous
work Harry02 ; Crooks . Those references discuss how this coating loss may effect the
sensitivity of Advanced LIGO.
We have shown in this work that the loss in this coating is
predominantly the bulk loss in the tantala layers.
Work is underway to investigate other coating materials and processes that may
give lower mechanical loss while retaining the high reflectivity, low scatter,
and low optical loss required by these advanced detectors.
V Addendum
The coating applied to the thick disk as reported in reference Harry02 is incorrect. The correct coating thickness of 4.66 m results in a calculated coating of .
References
- (1) LIGO Science Collaboration, P. Fritschel ed., Advanced LIGO System Design, LIGO-T010075-00-D (2001). Available at http://www.ligo.caltech.edu/docs/T/T010075-00.pdf.
-
(2)
LIGO Science Collaboration, LSC White Paper on Detector Research and Development (1999). Available at
http://www.ligo.caltech.edu/docs/T/T990080-00.pdf. - (3) K. Srinivasan, D. Coyne, R. Vogt, LIGO document LIGO-T97016-00-D (1997), Available at http://www.ligo.caltech.edu/docs/T/T970176-00.pdf.
- (4) Yu. Levin, Phys. Rev. D 57 659 (1998).
- (5) D. Crooks, P. Sneddon, G. Cagnoli, J. Hough, S. Rowan, M. M. Fejer, E. Gustafson, R. Route, N. Nakagawa, D. Coyne, G. M. Harry, A. M. Gretarsson, Class. Quantum Grav. 19 4229 (2002).
- (6) G. M. Harry, A. M. Gretarsson, P. R. Saulson, S. D. Penn, W. J. Startin, S. E. Kittelberger, D. R. M. Crooks, J. Hough, G. Cagnoli, N. Nakagawa, S. Rowan, M. M. Fejer, Classical and Quantum Gravity 19 (2002) 897-918.
- (7) N. Nakagawa, A. M. Gretarsson, E. K. Gustafson, M. M. Fejer, Phys.Rev. D65 102001 (2002).
- (8) P. Sneddon and S. Rowan, private communication, publication in preparation.
- (9) Corning Incorporated, Corning, New York 14831-0001, United States.
- (10) WavePrecision Inc., 5390 Kazuko Court, Moorpark, CA 93021, USA.
- (11) Service des Materiaux Avances/Virgo, Lyon, France.
- (12) ALGOR, Inc., 150 Beta Drive, Pittsburgh, PA 15238-2932 USA.
- (13) K. Numata, et al., Phys. Lett. A276 37 (2000).
- (14) B. S. Lunin and S. N. Torbin, Vestnik Moskovskogo Universiteta, ser. 2, Khimia, 41 93 (2000).
- (15) S. D. Penn, G. M. Harry, A. M. Gretarsson, S. E. Kittelberger, P. R. Saulson, J. J. Schiller, J. R. Smith, S. O. Swords, Rev. Sci. Instrum. 72 3670 (2001).
- (16) L. D. Landau and E. M. Lifshitz, Theory of Elasticity, 3rd edition, Pergamon Press, Oxford, 1986.
- (17) P. J. Martin, A. Bendavid, et al., “Mechanical and Optical Properties of Thin Films of Tantalum Oxide Deposited by Ion-assisted Deposition”, in “Thin films: Stresses and Mechanical Properties IV”, Mat. Res. Soc. Symp. Proc. 308 583 (1993)
- (18) MLD Technologies, 2672 Bayshore Parkway, Suite #701, Mountain View, CA 94043 USA.
- (19) V. B. Braginksy, V. P. Mitrofanov, V. I. Panov, Systems with Small Dissipation, The University of Chicago Press, (1985)
- (20) J. E. Logan, N. A. Robertson and J. Hough, Phys. Lett. A170 352-358 (1992)
- (21) S. Rowan, S. M. Twyford, J. Hough, D. H. Gwo, R. Route, Phys. Lett. A246 471-8 (1998)